Scientific article
http://dx.doi.org/10.5154/r.rchsh.2016.11.028
Chronic infection of the citrus tristeza virus in Citrus sinensis / C. aurantium trees in a restrictive thermal regime in Yucatán Infección crónica del virus de la tristeza de los cítricos en árboles de Citrus sinensis / C. aurantium en un régimen térmico restrictivo en Yucatán Patricia Rivas-Valencia1; Emiliano Loeza-Kuk2*; Santiago Domínguez-Monge3; Claudia Tania Lomas-Barrié2 1
Instituto Nacional de Investigaciones Forestales, Agrícolas y Pecuarias - Campo Experimental Valle de México. Carretera Los Reyes-Texcoco km 13.5, Coatlinchán, Texcoco, México, C. P. 56250, MÉXICO. 2 Instituto Nacional de Investigaciones Forestales, Agrícolas y Pecuarias - Campo Experimental Mocochá. Carretera Mérida-Motul km 25, Mocochá, Yucatán. C. P. 97454, MÉXICO. 3 Colegio de Postgraduados-Campus Montecillo, Programa de Fitopatología. Carretera México-Texcoco km 36.5, Montecillo, Texcoco, México, C. P. 56230, MÉXICO. *Corresponding author:
[email protected], tel. 018000882222 ext. 88232
Abstract
T Keywords: moderate isolate, epidemic, electrophoretic pattern, vigor, Toxoptera citricida.
he citrus tristeza virus (CTV) is a pathogen present in almost all citrus areas. It reduces production in plantations with susceptible rootstocks, such as sour orange trees. The aim of this study was to temporally characterize the behavior of CTV considering its population structure (PS), vigor, concentration in tissues and availability of vectors, this on the basis of an analysis of the thermal conditions in Yucatán. In two sweet orange (C. sinensis) orchards in Yucatán, trees grafted onto sour orange (C. aurantium) were sampled and evaluated in terms of vigor for 12 years. Samples were analyzed by immunoprinting, single-strand conformation polymorphism (SSCP), and specific amplifications by real-time and conventional polymerase chain reaction (PCR). The incidence of CTV increased 40 % in four years. All samples analyzed (81) were negative for severe isolates; only T-30 isolates and minor changes in tree vigor were identified. The PS indicated changes with a tendency towards complexity (11 electrophoretic patterns in six haplotypes), a similarity coefficient of 0.80 and intrapopulation diversity of 65 %. The thermal regime (TR) was restrictive during 75 % of the year for CTV transmission and the optimum development of vector aphids. Pathogen PS and TR have contributed to the fact severe CTV epidemics have not been recorded; therefore, sour orange continues as a key element in the region’s citrus production despite the risk involved (commercializing propagating material that does not comply with NOM 079-FITO-2002). Resumen
E Palabras clave: aislado moderado, epidemia, patrón electroforético, vigor, Toxoptera citricida.
l virus de la tristeza de los cítricos (CTV) es un patógeno presente en casi todas las áreas citrícolas; el cual, reduce la producción en plantaciones con portainjertos susceptibles, como el naranjo agrio. El objetivo de este estudio fue caracterizar temporalmente el comportamiento del CTV considerando su estructura poblacional (EP), vigor, concentración en tejidos y disponibilidad de vectores. Esto último a partir del análisis de las condiciones térmicas en Yucatán. Se muestrearon y evaluaron en vigor durante 12 años los árboles de dos huertas de naranjo dulce (C. sinensis), injertados en agrio (C. aurantium) en Yucatán. Las muestras se analizaron por inmunoimpresión, polimorfismo de conformación de cadena simple (SSCP) y amplificaciones específicas por la reacción en cadena de la polimerasa (PCR) en punto final y tiempo real. La incidencia de CTV se incrementó 40 % en cuatro años. Todas las muestras analizadas (81) fueron negativas para aislados severos; solo se identificaron aislados tipo T-30 y cambios menores en el vigor de los árboles. La EP indicó cambios con tendencia a la complejidad (11 patrones electroforéticos en seis haplotipos), coeficiente de similaridad de 0.80 y diversidad intrapoblacional de 65 %. El régimen térmico (RT) fue restrictivo durante 75 % del año para la transmisión del CTV y el desarrollo óptimo de áfidos vectores. La EP del patógeno y el RT han contribuido a que no se registren epidemias severas de CTV; por lo cual, el naranjo agrio continúa como un elemento clave en la producción citrícola de la región con el riesgo que esto implica (comercializar material propagativo que no cumple la NOM 079-FITO-2002).
Please cite this article as follows (APA 6): Rivas-Valencia, P., Loeza-Kuk, E., Domínguez-Monge, S., & Lomas-Barrié, C., T. (2017). Chronic infection of the citrus tristeza virus in Citrus sinensis / C. aurantium trees in a restrictive thermal regime in Yucatán. Revista Chapingo Serie Horticultura, 23(3), 187-202. doi: http://dx.doi.org/10.5154/r.rchsh.2016.11.028
Received: November 16, 2016/ Accepted: July 31, 2017.
www.chapingo.mx/revistas/horticultura
188
Chronic infection of the citrus tristeza virus...
Introduction
Introducción
Citrus tristeza is a disease that has had a great impact in all the citrus regions of the world due to the death of almost 100 million trees grafted onto sour orange (BarJoseph, Batuman, & Roistacher, 2010). The pathogen responsible is the citrus tristeza virus (CTV), a 20 kb positive-sense, single-stranded RNA Closterovirus with 12 open reading frames and nontranslatable regions 5’ and 3’ terminus (Karasev, 2000). The CTV species is made up of a collection of homologous sequences that differ from each other by up to 4 %. Within the CTV population there are isolates with sequence variants or haplotypes (Ayllón et al., 2006; Rubio et al., 2001). Each isolate can induce different symptoms (Herrera-Isidrón, Ochoa-Sánchez, Rivera-Bustamante, & Martínez-Soriano, 2009; Weng et al., 2007), or even be asymptomatic (Bové, Vogel, Albertini, & Bové, 1988; Rivas-Valencia et al., 2010).
La tristeza de los cítricos es una enfermedad que ha tenido gran impacto en todas las regiones citrícolas del mundo, debido a la mortandad de casi 100 millones de árboles injertados en naranjo agrio (Bar-Joseph, Batuman, & Roistacher, 2010). El patógeno responsable es el virus de la tristeza de los cítricos (CTV, por sus siglas en inglés), un Closterovirus de cadena sencilla de RNA en sentido positivo de 20 kb, con 12 marcos abiertos de lectura y regiones no traducibles en las terminaciones 5’ y 3’ (Karasev, 2000). La especie del CTV está conformada por una colección de secuencias homólogas que varían entre sí hasta 4 %. Dentro de la población del CTV existen aislados con variantes de secuencia o haplotipos (Ayllón et al., 2006; Rubio et al., 2001). Cada aislado puede inducir síntomas diferentes (Herrera-Isidrón, Ochoa-Sánchez, Rivera-Bustamante, & Martinez-Soriano, 2009; Weng et al., 2007), o incluso ser asintomático (Bové, Vogel, Albertini, & Bové, 1988; Rivas-Valencia et al., 2010).
CTV is transmitted semi-persistently by Aphis gossypii and Toxoptera citricida, among other aphids (Yokomi et al., 1994). Transmissibility may also be specific (Hermoso-de Mendoza, Ballester-Olmos, & Pina-Lorea, 1984; Roistacher & Bar-Joseph, 1987), as well the ability to interfere with other isolates of different virulence (Costa & Müller, 1980; van Vuuren, Collins, & da Graça, 1993). As in other biological systems, vector abundance, viral replication rate and viral transmission are significantly modified by environmental conditions (Hermoso-de Mendoza et al., 1984; Raccah, Loebenstein, & Bar-Joseph, 1976). Among the most studied climatic elements are temperature, relative humidity and rainfall (Piyaratne et al., 2014; Wallin & Loonan, 1971). The ideal temperature for the biological cycle of the vectors, and the replication and transmission of the virus is between 20 and 26 °C (Garnsey et al., 2005; Raccah et al., 1976; Yokomi & de Borde, 2005). In Mexico, the first CTV detections were in Tamaulipas (1983) and Veracruz (1986) (Secretaría de Agricultura, Ganadería, Desarrollo Rural, Pesca y Alimentación [SAGARPA], 2001). Until 2007, the Dirección General de Sanidad Vegetal (DGSV) detected and eliminated infected plants (Servicio Nacional de Sanidad, Inocuidad y Calidad Agroalimentaria [SENASICA], 2014). However, despite the eradication of the initial foci, the disease has continued to spread (Góngora-Canul et al., 2005; Rivas-Valencia et al., 2010; Ruiz-García et al., 2009; Silva-Vara et al., 2001). Currently, T. citricida is found in 18 citrus-producing states (SENASICA, 2014), putting them at risk of having severe citrus tristeza epidemics. The prevalent CTV isolates in Yucatán have been the moderate type (Rivas-Valencia et al., 2010), while severe infections have been detected in Nuevo León, Colima, Baja California, Veracruz and Tamaulipas (Herrera-Isidrón et al., 2009; Loeza-Kuk et al., 2005; Mendoza, Salazar, Alvarado, Cruz, & Barrera, 2003; Silva-Vara et al., 2001).
El CTV es transmitido de forma semipersistente por Aphis gossypii y Toxoptera citricida, entre otros áfidos (Yokomi et al., 1994). La transmisibilidad también puede ser específica (Hermoso-de Mendoza, BallesterOlmos, & Pina-Lorea, 1984; Roistacher & Bar-Joseph, 1987), así como la capacidad para interferir con otros aislados de distinta virulencia (Costa & Müller, 1980; van Vuuren, Collins, & da Graça, 1993). Como en otros sistemas biológicos, la abundancia de los vectores, la tasa de replicación viral y su transmisión son modificadas sensiblemente por las condiciones ambientales (Hermoso-de Mendoza et al., 1984; Raccah, Loebenstein, & Bar-Joseph, 1976). Entre los elementos climáticos más estudiados sobresalen la temperatura, humedad relativa y precipitación pluvial (Piyaratne et al., 2014; Wallin & Loonan, 1971). La temperatura ideal para el ciclo biológico de los vectores, y la replicación y transmisión del virus está entre 20 y 26 °C (Garnsey et al., 2005; Raccah et al., 1976; Yokomi & de Borde, 2005). En México, las primeras detecciones del CTV se realizaron en Tamaulipas (1983) y Veracruz (1986) (Secretaría de Agricultura, Ganadería, Desarrollo Rural, Pesca y Alimentación [SAGARPA], 2001). Hasta 2007, la Dirección General de Sanidad Vegetal detectó y eliminó plantas infectadas (Servicio Nacional de Sanidad, Inocuidad y Calidad Agroalimentaria [SENASICA], 2014). Sin embargo, a pesar de la erradicación de los focos iniciales, la dispersión de la enfermedad ha continuado (Góngora-Canul et al., 2005; Rivas-Valencia et al., 2010; Ruiz-García et al., 2009; Silva-Vara et al., 2001). Actualmente, T. citricida, se encuentra en 18 estados citrícolas (SENASICA, 2014), con riesgo de provocar epidemias severas de tristeza de los cítricos. La prevalencia de aislados de CTV en
Revista Chapingo Serie Horticultura | Vol. XXIII, núm. 3, septiembre-diciembre 2017.
Rivas-Valencia et al.
In Yucatán, with the arrival of T. citricida in 2000 (Michaud & Álvarez, 2000), an increase in isolates and severe symptoms of CTV was predicted as in other countries (Halbert et al., 2004; Matos et al., 2013); however, these have not been detected. It is unknown whether the absence of severe symptoms is linked to local climatic conditions that mask severe isolates. In this sense, it was necessary to carry out a long-term study to detect changes in the population structure linked to virus replication, productive effects on the host, vector survival, dispersion and the climatic component that offer relevant information for the management, control and prediction of the epidemic expression of CTV. Therefore, the aim of this study was to temporally characterize CTV behavior, considering its population structure (PS), vigor, concentration in tissues and availability of vectors, this on the basis of an analysis of the thermal conditions in Yucatán. Materials and methods Location of study area In October 2009 and November 2010 and 2014, two commercial citrus orchards were sampled: Cabaché 2 (20° 20’ 25.8’’ North latitude and 89° 26’ 48.2’’ West longitude) and Unión 2 (20° 20’ 26.2’’ North latitude and 89° 26’ 21’’ West longitude), located in Ticul, municipality of Yucatán, Mexico, both orchards with CTV incidence since 2002 and 25-year-old trees.
Yucatán ha sido de tipo moderado (Rivas-Valencia et al., 2010); mientras que infecciones severas se han detectado en Nuevo León, Colima, Baja California, Veracruz y Tamaulipas (Herrera-Isidrón et al., 2009; Loeza-Kuk et al., 2005; Mendoza, Salazar, Alvarado, Cruz, & Barrera, 2003; Silva-Vara et al., 2001). En Yucatán, con la llegada de T. citricida en el 2000 (Michaud & Álvarez, 2000), se pronosticó un incremento de aislados y síntomas severos de CTV como en otros países (Halbert et al., 2004; Matos et al., 2013); sin embargo, éstos no se han detectado. Se desconoce si la ausencia de síntomas graves está ligada a las condiciones climáticas locales que enmascaran a los aislados severos. En este sentido, fue necesario realizar un estudio a largo plazo para detectar los cambios en la estructura poblacional ligada a la replicación del virus, los efectos productivos en el hospedante, la supervivencia del vector, dispersión y el componente climático que ofrezcan información relevante para el manejo, control y predicción de la expresión epidémica del CTV. Por lo anterior, el objetivo de este estudio fue caracterizar temporalmente el comportamiento del CTV, considerando su estructura poblacional (EP), vigor, concentración en tejidos y disponibilidad de vectores. Esto último a partir del análisis de las condiciones térmicas en Yucatán. Materiales y métodos Ubicación del área de estudio
CTV sampling and detection The sampling carried out in Cabaché 2 was restricted to 24 rows with 24 trees each and in Unión 2 to 9 rows with 24 trees each, in order to detect new CTV-positive trees and update the registry initiated in 2003 (RivasValencia et al., 2010). The material consisted of young shoots collected from the four cardinal points of the tree at 1.50 m in height and later stored at 4 °C until processing in the laboratory. Detection of CTV-positive trees was performed with direct-ELISA immunoprinting (Plant Print Diagnostics S.L. and Agdia S.C.), according to the procedure of Ruiz-García et al. (2009). Molecular characterization and population structure of CTV RNA extraction First, 100 mg of fresh leaf midribs from each sample were used for the extraction of total RNA with Trizol® Reagent (Invitrogen™), according to the manufacturer’s protocol. For the polymerase chain reaction (PCR), cDNA was obtained by reverse transcription with hexamers, and
En octubre de 2009 y noviembre de 2010 y 2014 se realizaron muestreos en dos huertas comerciales de cítricos: Cabaché 2 (20° 20’ 25.8’’ latitud norte y 89° 26’ 48.2’’ longitud oeste) y Unión 2 (20° 20’ 26.2’’ latitud norte y 89° 26’ 21’’ longitud oeste), ubicadas en Ticul, municipio de Yucatán, México; ambas huertas con incidencia de CTV desde el 2002 y con 25 años de edad. Muestreo y detección del CTV El muestreo realizado en Cabaché 2 fue restrictivo a 24 hileras por 24 árboles y en Unión 2 fue de 9 hileras por 24 árboles, con la finalidad de detectar nuevos positivos a CTV y actualizar el registro iniciado en 2003 (Rivas-Valencia et al., 2010). El material colectado consistió en brotes jóvenes obtenidos de los cuatro puntos cardinales del árbol a 1.50 m de altura almacenándose en refrigeración a 4 oC hasta su procesamiento en laboratorio. La detección de árboles positivos a CTV se realizó con inmunoimpresión ELISA-directa (Plant Print Diagnostics S.L. y Agdia S.C.), de acuerdo con el procedimiento de Ruiz-García et al. (2009).
Revista Chapingo Serie Horticultura | Vol. XXIII, núm. 3, septiembre-diciembre 2017.
189
190
Chronic infection of the citrus tristeza virus...
a portion of the p25 gene encoding the coat protein (CP) (273 bp; Table 1) was amplified and analyzed on agarose gel (Kong, Rubio, Polek, & Falk, 2000). The PCR products were subjected to single-strand conformation polymorphism (SSCP), which allows detecting most sequence variants without having to use cloning procedures to separate them, especially when there is a dominant sequence (Iglesias et al., 2008). Afterwards, 5 µl of the amplification product were denatured for 10 min at 99 °C in a solution containing 95 % formamide, 20 mM EDTA, blue bromophenol and xylene cianol. The fragments were separated by 12 % polyacrylamide gel electrophoresis in a Bio-Rad Protean II® chamber with TBE buffer 1x at 200 v for 2 h 30 min at room temperature. The gel was stained with silver according to the protocol of Beidler, Hilliard, and Rill (1982). Analysis of electrophoretic patterns To compare the differences between the electrophoretic patterns, a matrix with presence vectors (1) and absence (0) of band signal SSCP was constructed from Nei and Li’s (Nei & Li, 1979) coefficient. A dendrogram was generated by the unweighted pair group method with arithmetic mean (UPGMA) using the software NTSYSpc ver. 2.10L and an analysis of molecular variance was performed with the software GenAlEx 6.5 (Peakall & Smouse, 2012).
Caracterización molecular y estructura poblacional de CTV Extracción de RNA Se utilizaron 100 mg de nervadura fresca de cada muestra para la extracción de RNA total con Trizol® Reagent (Invitrogen™), según protocolo del fabricante. Para la reacción en cadena de la polimerasa (PCR, por sus siglas en inglés), se obtuvo cDNA por reverso transcripción con hexámeros, se amplificó una parte del gen p25 que codifica a la capa proteica (CP) (273 pb; Cuadro 1) y se analizó en gel de agarosa (Kong, Rubio, Polek, & Falk, 2000). Los productos de la PCR se sometieron a polimorfismo de conformación de cadena simple (SSCP, por sus siglas en inglés), que permite detectar a la mayoría de las variantes de secuencia sin recurrir a procedimientos de clonación para separarlos, especialmente cuando existe una secuencia dominante (Iglesias et al., 2008). Se tomaron 5 µl del producto de la amplificación y se desnaturalizaron por 10 min a 99 ºC en una solución que contenía 95 % formamida, 20 mM EDTA, bromofenol azul y xilen-cianol. Los fragmentos se separaron mediante electroforesis en gel de poliacrilamida al 12 % en una cámara Bio-Rad Protean II® con amortiguador TBE 1x a 200 v por 2 h 30 min a temperatura ambiente. El gel se tiñó con plata según el protocolo de Beidler, Hilliard, y Rill (1982).
Table 1. Primers used for detection and characterization of citrus tristeza virus isolates in Yucatán. Cuadro 1. Iniciadores utilizados para detección y caracterización de aislados del virus de la tristeza de los cítricos en Yucatán. Primers / Iniciadores
Sequencez 5’ to 3’ / Secuenciaz 5’ a 3’
Amplicon (pb) / Amplicón (pb)
Citation / Cita
CPK-F CPK-R
AACGCCCTTCGAGTCTGGGGTAGGA TCAACGTGTGTTGAATTTCCCAAGC
273
Kong et al. (2000)
PM34
TGGTGTAAATCCCAACCAGACGGTTG
229
Ayllón et al. (2001)
PM35 RF-137
ATCGCGCATCTGGCGCAAAC CCGTARAGGGACKATCGGC
115
T36-1F T36-1R
CGGAATAGGTCCAGCCTTTAAGCTCT TGGTGTTAAGTTTGCGCCAGATGC 6-FAM / TTCTGGTCTTCGGCCATCGCTGTTAA / BHQ1
143
ATGCTAGCGATGGTCAAATGGACG
110
T36-1pro* T30-3F T30-3R T30-3pro
TTCGCTCGCGAAAGCAAACATCTC Cy5/AATTCTCGCTGAGAGCCAACGTTGGT/ BHQ2
CoxF
GTATGCCACGTCGCATTCCAGA
CoxR
GCCAAAACTGCTAAGGGCATTA
Cox pro§
Ananthakrishnan et al. (2010)
68
TET/ATCCAGATGCTTACGCTGG/ BHQ2
z
R = A or G, K = T or G, FAM = 6-carboxyfluorescein), Cy5 = cyanine-5, TET = tetraclorofluorescein. *Prefix pro indicates probes labelled for identification of isolates in real-time PCR. § Cytochrome oxidase, internal reaction control z
R = A o G, K = T o G, FAM = 6-carboxyfluorescein), Cy5 = cyanine-5, TET = tetraclorofluorescein. *Prefijo pro indica sondas marcadas para la identificación de aislados en PCR tiempo real. § Citrocromo oxidasa, control interno de reacción.
Revista Chapingo Serie Horticultura | Vol. XXIII, núm. 3, septiembre-diciembre 2017.
Rivas-Valencia et al.
Selective PCR
Análisis de patrones electroforéticos
Additionally, the cDNA of the samples was processed to differentiate T-385 (moderate: PM34/RF137 primers) and T-36 (severe; PM35/RF137 primers) isolates (Table 1; Ayllón et al., 2001).
Para comparar las diferencias entre los patrones electroforéticos, se construyó una matriz con vectores de presencia (1) y ausencia (0) de señal de bandas de SSCP a partir del coeficiente de Nei y Li (Nei & Li, 1979). Se generó un dendrograma por el método de promedio aritmético de grupos de pares no ponderados (UPGMA, por sus siglas en inglés) usando el programa NTSYSpc ver. 2.10L y se realizó un análisis de varianza molecular con el programa GenAlEx 6.5 (Peakall & Smouse, 2012).
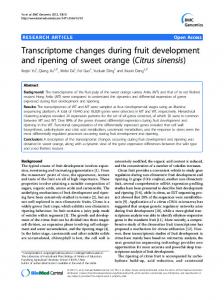
The same cDNA obtained was subjected to real-time PCR to differentiate T-30 and T-36 isolates (Table 1, Ananthakrishnan, Venkataprassana, Roy, & Brlansky, 2010) and to determine the relative concentration of the isolates present in the plant. The final reaction volume was 25 μl containing 1X PCR buffer, 2.5 mM MgCl2, 100 nM dNTPs, 200 nM of primers and probe for T-30 (100 nM were used for T-36), 100 nM of primers for citrus cytochrome oxidase (COX), 50 nM COX probe (internal control) and 1 U Taq DNA polymerase (Invitrogen™). The reactions were carried out in a Cepheid-brand SmartCycler® thermocycler with a profile of 90 s, 40x (94 ºC, 30 s and 60 ºC, 90 s). Photographic record and vigor evaluation The digital photographic record of positive trees was carried out in 2004, 2006, 2009 and 2015 (with Samsung® L200). Tree vigor assessment was performed using a diagrammatic scale that takes into account the vigor of the primary and secondary branches based on leaf density, appearance and coloring to relate it to the presence of pathogens, with an emphasis on CTV (Figure 1).
PCR selectiva Adicionalmente, el cDNA de las muestras se procesó para diferenciar aislados de tipo T-385 (moderado; iniciadores PM34/RF137) y T-36 (severo; iniciadores PM35/RF137) (Cuadro 1; Ayllón et al., 2001). El mismo cDNA obtenido se sometió a la PCR en tiempo real (qPCR) para diferenciar aislados tipo T-30 y T-36 (Cuadro 1; Ananthakrishnan, Venkataprassana, Roy, & Brlansky, 2010) y determinar la concentración relativa de los aislados presentes en la planta. El volumen de reacción final fue de 25 μL que contenía buffer PCR 1X, 2.5 mM de MgCl2, 100 nM dNTPs, 200 nM de iniciadores y sonda para T-30 (para T-36 se usaron 100 nM), 100 nM de iniciadores para citocromo oxidasa de cítricos (COX), 50 nM de sonda COX (control interno) y 1U de Taq DNA polimerasa (Invitrogen™). Las reacciones se realizaron en un termociclador SmartCycler® (Cepheid) con perfil de 90 s, 40x (94 ºC, 30 s y 60 ºC, 90 s).
Climate analysis Registro fotográfico y evaluación de vigor Maximum and minimum temperatures and accumulated precipitation were analyzed. A daily thermal oscillation index and an index of days with favorable conditions for the citrus tristeza pathosystem were generated using daily data from 1966 to 2014 from the Dzán conventional weather station (Comisión Nacional del Agua - Servicio Meteorológico Nacional [CONAGUA-SMN]), located 4.3 km from the orchard; also, data from an automated station in Maní belonging to the Instituto Nacional de Investigaciones Forestales, Agrícolas y Pecuarias (INIFAP) weather station network was used. Results and discussion Sampling and detection of CTV-positive trees In 2009 and 2010, 3,712 tissue prints were made in Cabaché 2 and 1,728 in Unión 2 for the detection of CTV. All trees sampled were grafted onto sour orange (Citrus aurantium L.). In Cabaché 2, a 40 % increase in positive trees (83 trees) was detected, compared to the number found in 2006 by Rivas-Valencia et al. (2010).
El registro fotográfico digital de los árboles positivos se realizó en 2004, 2006, 2009 y 2015 (con Samsung® L200). La evaluación del vigor de los árboles se realizó con una escala diagramática que toma en cuenta el vigor de las ramas primarias y secundarias considerando densidad foliar, aspecto y coloración de hojas para relacionarla con la presencia de patógenos, con énfasis en CTV (Figura 1). Análisis climático Se analizó la temperatura máxima y mínima, así como la precipitación acumulada. Se generó un índice de oscilación térmica diaria e índice de días con condiciones favorables para el patosistema tristeza de los cítricos, con datos diarios de 1966 a 2014 de la estación climática convencional Dzan (Comisión Nacional del Agua Servicio Meteorológico Nacional [CONAGUA-SMN]) localizada a 4.3 km del área de estudio. Además, se usaron datos de temperatura mínima y máxima de cada 15 min de 2014 de la estación meteorológica automatizada de Maní localizada a 5.5 km de las huertas
Revista Chapingo Serie Horticultura | Vol. XXIII, núm. 3, septiembre-diciembre 2017.
191
192
Chronic infection of the citrus tristeza virus...
1
3
2
4
5
Figure 1. Diagrammatic scale for citrus vigor evaluation associated with citrus tristeza virus on the Yucatán peninsula (1 = excellent, 2 = good, 3 = bad, 4 = very bad and 5 = dead). Figura 1. Escala diagramática para la evaluación del vigor de cítricos asociado al virus de la tristeza de los cítricos en la península de Yucatán (1 = excelente, 2 = bueno, 3 = malo, 4 = muy malo y 5 = muerto).
In Unión 2, seven positive trees were detected that were not consistent between dates (data not shown). In 2014, 95 trees were sampled, including those with a negative historical record to CTV as controls, of which 81 were positive and 14 negative (Table 2). In orchards located in Nuevo León with the same variety/rootstock combination, an annual dispersion of 0.27 and 0.19 % was observed (Silva-Vara et al., 2001), which is comparatively lower than estimated in Yucatán (10 %). Molecular characterization and population structure All positive samples by immunoprinting amplified part of the p25 gene of the CTV’s CP (81 samples; Figure 2A). Isolates subjected to selective PCR were moderate (81). Real-time PCR confirmed the prevalence of moderate T-30 isolates and they had a low viral particle concentration, with an average Ct (threshold cycle) of 25.6 ± 2.94 (Table 3). This variation is dependent on the
pertenecientes al Instituto Nacional de Investigaciones Forestales, Agrícolas y Pecuarias (INIFAP). Resultados y discusión Muestreo y detección de árboles positivos a CTV En 2009 y 2010, se realizaron 3,712 impresiones en Cabaché 2 y 1,728 en Unión 2 para la detección de CTV. Todos los árboles muestreados estaban injertados en naranjo agrio (Citrus aurantium L.). En Cabaché 2, se detectó un incremento de 40 % de árboles positivos (83 árboles), con respecto a lo encontrado en 2006 por Rivas-Valencia et al. (2010). En Unión 2, se detectaron siete árboles positivos que no fueron consistentes entre fechas (datos no mostrados). En 2014, se muestrearon 95 árboles, incluyendo aquellos con registro histórico negativo a CTV como controles, de los cuales 81 fueron positivos y 14 negativos (Cuadro 2). En huertas de Nuevo León con la misma combinación variedad/portainjerto,
Revista Chapingo Serie Horticultura | Vol. XXIII, núm. 3, septiembre-diciembre 2017.
Rivas-Valencia et al.
Table 2. Number of trees positive to citrus tristeza virus by immunoprinting and percentage of incidence in two commercial orchards in Ticul, Yucatán, Mexico. Cuadro 2. Número de árboles positivos al virus tristeza de los cítricos por inmunoimpresión y porcentaje de incidencia en dos huertas comerciales de Ticul, Yucatán, México. Orchard§ ⁄ Huerta§
2002 z
2003
2004
2006
2009-2010
2014
CTV
CTV
Y (%)
CTV
Y (%)
CTV
Y (%)
CTV
Y (%)
CTV
Cabaché 2
9
11
4.04
46
16.91
49
18.01
83
17.62
81
Unión 2
1
0.2
-
-
-
-
-
7
3.24
-
§
Mixed orchard (sapodilla, mamey, avocado, banana and coconut) with irregular topological arrangement. CTV = citrus tristeza virus, Y = restrictive absolute incidence. For 2014, only positive trees detected in 2009 and 2010 were sampled. z
§
Huerta mixta (chicozapote, mamey, aguacate, plátano y coco) con arreglo topológico irregular. CTV = virus de la tristeza de los cítricos, Y = incidencia absoluta restrictiva. Para 2014, solo se muestrearon los árboles positivos detectados en 2009 y 2010. z
type of isolate, time of infection, species of citrus and vigor of the trees, in addition to the temperature that limits the replication of the virus. In warm conditions, CTV reduces its rate of replication; however, the effect is lower in moderate isolates (Targon et al., 2005), so they are able to overcome, in the occupation of infection niches, the severe isolates. The PS in 2009-2010 with SSCP showed electrophoretic patterns (EPs) with a greater number of bands (12), representing at least six haplotypes in the same tree (Figure 2B). In 2014, up to 10 bands were detected, represented in 11 EPs with at least five haplotypes (Figure 2C). This shows the dynamics in the pathosystem with temporal changes in PS, but not in prevalence. Rivas-Valencia et al. (2010) found, in this same orchard in 2006, three patterns of up to three bands; that is, a combination of up to two haplotypes per isolate. The existence of dominant T-30 sequences was determined by the SSCP analysis.
A
se observó una dispersión anual de 0.27 y 0.19 % (SilvaVara et al., 2001), lo cual comparativamente es menor a lo estimado en Yucatán (10 %). Caracterización molecular y estructura poblacional Todas las muestras positivas por inmunoimpresión amplificaron parte del gen p25 de la CP del CTV (81 muestras; Figura 2A). Los aislados sometidos a la PCR selectiva fueron moderados (81). La PCR en tiempo real confirmó la prevalencia de aislados moderados de tipo T-30 y presentaron una concentración de partículas virales baja, con una media de Ct (threshold cycle) de 25.6 ± 2.94 (Cuadro 3). Esta variación es dependiente del tipo de aislado, tiempo de infección, especie de cítrico y el vigor de los árboles; además de la temperatura que limita la replicación del virus. En condiciones cálidas, el CTV reduce su tasa de replicación; sin embargo, el efecto es menor en
B
C
Figure 2. A) Electrophoresis in agarose (1 %) of p25 partial amplicons of citrus tristeza virus (CTV) (273 bp), B) and C) single-strand conformation polymorphism (SSCP) in 12 % polyacrylamide with fragments of the p25 gene of CTV isolates from Cabaché 2 (2010 and 2014), Yucatán, Mexico. Roman numerals indicate the type of electrophoretic pattern. Figura 2. A) Electroforesis en agarosa (1 %) de amplicones parciales de p25 del virus de la tristeza de los cítricos (CTV) (273 pb), B) y C) polimorfismo de conformación de cadena simple (SSCP) en poliacrilamida al 12 % con fragmentos del gen p25 del CTV de aislamientos de Cabaché 2 (2010 y 2014), Yucatán, México. Los números romanos indican el tipo de patrón electroforético.
Revista Chapingo Serie Horticultura | Vol. XXIII, núm. 3, septiembre-diciembre 2017.
193
194
Chronic infection of the citrus tristeza virus...
The dendrogram constructed from the absence and presence of bands separated the isolates into four groups, with a similarity coefficient of 0.80 (Figure 3). The proportion of isolates for groups I, II, III and IV was 13.6, 39.7, 13.63 and 32.95 %, respectively. Isolates from another geographical area of the peninsula were located in group IV, which indicates a common origin for the two populations. The analysis of variance showed that there is greater diversity within the populations (65 %) than among them (35 %, Table 4); this is in accordance with the number of electrophoretic patterns (11) and haplotypes (five) found. Previous studies have revealed that genomic diversity within and among CTV isolates is attributed to a certain pathogenicity (Albiach-Martí et al., 2010; Papaylannis, Santos, Kyriakou, Kapari, & Nolasco, 2007), which depends on the structure of the CTV population present (Kong et al., 2000). Evaluation of vigor of trees with chronic infection The photographic record in 2004, 2006, 2009 and 2015 was 46, 49, 83 and 37, respectively. Throughout the 12 years, the vigor of the infected trees presented different degrees of deterioration (Figure 4).
aislados moderados (Targon et al., 2005), por lo que son capaces de superar, en la ocupación de nichos de infección, a los aislados severos. La EP en 2009-2010 con SSCP mostró patrones electroforéticos (PE) con mayor número de bandas (12), que representan al menos seis haplotipos en un mismo árbol (Figura 2B). En 2014, se detectaron hasta 10 bandas, representadas en 11 PE con al menos cinco haplotipos (Figura 2C). Lo anterior muestra la dinámica en el patosistema con cambios temporales de la EP, pero no así de prevalencia. Rivas-Valencia et al. (2010) encontraron, en esta misma huerta en 2006, tres patrones de hasta tres bandas; es decir, una combinación de hasta dos haplotipos por aislado. Con el análisis de SSCP se determinó la existencia de secuencias dominantes tipo T-30. El dendrograma construido a partir de la ausencia y presencia de bandas separó los aislados en cuatro grupos, con un coeficiente de similaridad de 0.80 (Figura 3). La proporción de aislados para los grupos I, II, III y IV fue de 13.6, 39.7, 13.63 y 32.95 %, respectivamente. Aislados provenientes de otra área geográfica de la península se ubicaron en el grupo IV, que indica un origen común para las dos poblaciones.
Table 3. Historical vigor of trees positive to the citrus tristeza virus and concentration of T-30 copies in Cabaché 2, Ticul, Yucatán, Mexico. Cuadro 3. Vigor histórico de árboles positivos al virus de la tristeza de los cítricos y concentración de copias de T-30 en Cabaché 2, Ticul, Yucatán, México. Vigor
Árbol ⁄ Tree
2004
2006
2010
2015
L1-A11
2a
2
2
L1-A12
3
3
L1-A14
2
L1-A17
Vigor
Ctz
Árbol ⁄ tree
2004
2006
2010
2015
2
25.95§
L6-A4
1
1
1
-
24.90
4
4
25.28
L6-A5
1
1
1
-
25.95
3
3
4
23.86
L6-A17
1
1
-
1
27.50
1
1
1
1
26.76
L7-A12
-
-
-
-
32.91
L1-A18
2
2
1
*
24.65
L8-A3
2
2
2
-
29.66
Ct
L2-A11
2
2
2
*
31.99
L8-A4
2
2
2
-
28.27
L2-A17
1
2
2
2
27.91
L9-A2
2
2
2
-
28.61
L3-A9
1
1
1
2
26.57
L9-A3
2
-
-
-
26.56
L3-A12
2
2
2
3
28.90
L9-A5
-
2
2
-
23.56
L3-A14
2
2
2
2
25.60
L9-A6
1
1
1
1
25.99
L3-A15
2
2
2
3
25.94
L11-A5
-
1
1
-
28.44
L3-A16
1
1
1
1
25.70
L11-A14
-
1
1
1
22.50
L4-A9
2
-
-
-
27.74
L12-A11
1
1
1
1
23.23
L6-A3
2
2
2
-
23.60
L12-A14
1
1
1
1
20.90
zCT = threshold cycle. *Only live rootstock. § Values < 22 high concentration and > 25 low concentration. a1 = excellent, 2 = good, 3 = bad, 4 = very bad and 5 = dead. zCT = threshold cycle. *Solo portainjerto vivo. § Valores < 22 concentración alta y > 25 concentración baja. a 1 = excelente, 2 = bueno, 3 = malo, 4 = muy malo y 5 = muerto.
Revista Chapingo Serie Horticultura | Vol. XXIII, núm. 3, septiembre-diciembre 2017.
Rivas-Valencia et al.
El análisis de varianza mostró que dentro de las poblaciones hay mayor diversidad (65 %) que entre ellas (35 %; Cuadro 4); esto de acuerdo con el número de patrones electroforéticos (11) y de haplotipos (cinco) encontrados. Estudios previos, revelaron que la diversidad genómica dentro y entre los aislados del CTV se atribuye a cierta patogenicidad (Albiach-Martí et al., 2010; Papaylannis, Santos, Kyriakou, Kapari, & Nolasco, 2007); la cual depende de la estructura de la población del CTV presente (Kong et al., 2000). Evaluación de vigor de árboles con infección crónica El registro fotográfico en 2004, 2006, 2009 y 2015 fue de 46, 49, 83 y 37, respectivamente. A lo largo de los 12 años, el vigor de los árboles infectados presentó diferentes grados de deterioro (Figura 4).
0.75
0.81
0.88 Coefficient / Coeficiente
0.91
1.00
Figure 3. Dendrogram obtained from 88 electrophoretic profiles of citrus tristeza virus (CTV) isolates, Yucatán, Mexico. Seven isolates from a different geographical origin were included. Figura 3. Dendrograma obtenido de 88 perfiles electroforéticos de aislados del virus de la tristeza de los cítricos (CTV), Yucatán, México. Se incluyeron siete aislados de un origen geográfico diferente.
The interaction between citrus species and isolates with different severity has been extensively studied (Albiach-Martí et al., 2000). In this study, tree response to CTV infection showed few changes, consistent with infection by moderate isolates. Also, trees with a vigorous and healthy appearance showed a higher relative concentration of CTV. The concentration of viral particles in trees with vigor 1 was similar (Table 3) to young C. aurantifolia plants confined in a greenhouse (Ct = 23), while in less vigorous trees the
La interacción entre especies de cítricos y aislados con diferente severidad se ha estudiado ampliamente (Albiach-Martí et al., 2000). En este estudio, la respuesta de los árboles a la infección del CTV mostró pocos cambios, en concordancia con una infección por aislados moderados. Asimismo, los árboles con aspecto vigoroso y saludable mostraron mayor concentración relativa de CTV. La concentración de partículas virales en árboles con vigor 1 fue similar (Cuadro 3) a plantas jóvenes de C. aurantifolia confinadas en invernadero (Ct = 23); mientras que en árboles menos vigorosos, la concentración viral fue menor (Ct = 27). De manera general, la concentración viral detectada fue baja al compararse con plantas de C. aurantifolia mantenidas a 28 °C (Ananthakrishnan et al., 2010). Caracterización regional climática El climograma de la Figura 5A indicó que el área de estudio posee un clima tipo Aw1(w’’)(i’)g (García, 1998), que corresponde a cálido subhúmedo intermedio con sequía interestival, poca oscilación térmica y marcha anual de la temperatura tipo Ganges. Este no es un clima
Table 4. Analysis of molecular variance of electrophoretic patterns obtained from a fragment of the p25 gene (273 bp) from Yucatán isolates, Mexico (2014). Cuadro 4. Análisis de varianza molecular de patrones electroforéticos obtenidos de un fragmento del gen p25 (273 pb) de aislados originarios de Yucatán, México (2014). Sources of variation / Fuente de variación
DFz / GLz
Variance estimators / Estimadores de varianza
Variation (%) / Variación (%)
Significance* / Significancia*
Among populations / Entre poblaciones /
1
1.50
35
0.35
Within populations / Dentro de poblaciones
86
2.78
65
--
DF = degrees of freedom. *Probability of occurrence of statistical probability variance values more extreme than those observed (P ≤ 0.05). z
z
GL = grados de libertad. *Probabilidad de ocurrencia de valores de varianza de probabilidad estadística más extremos a los observados (P ≤ 0.05).
Revista Chapingo Serie Horticultura | Vol. XXIII, núm. 3, septiembre-diciembre 2017.
195
196
Chronic infection of the citrus tristeza virus...
A
B
C
Figure 4. Vigor of trees positive to the citrus tristeza virus (CTV). A) 2004, B) 2009 and C) 2015. Commercial orchard in Ticul, Yucatán, Mexico. Figura 4. Vigor de árboles positivos al virus de la tristeza de los cítricos (CTV). A) 2004, B) 2009 y C) 2015. Huerta comercial de Ticul, Yucatán, México.
viral concentration was lower (Ct = 27). In general, the viral concentration detected was low when compared to C. aurantifolia plants maintained at 28 °C (Ananthakrishnan et al., 2010). Regional climatic characterization The graph of temperature and precipitation (Figure 5A) indicated that the study area has an Aw1(w’’)(i’)g climate type (García, 1998), which corresponds to warm intermediate subhumid with midsummer
común en el que se desarrollan y expresan los aislados tipo severo, excepto en Florida, E.U.A. (Cuadro 5). En Tamaulipas, aún y cuando la incidencia de aislados de tipo severo fue registrada, en años posteriores no fue posible detectarlos nuevamente (Rivas-Valencia et al., 2010); lo cual indica el efecto de la temperatura en los aislados severos. En la marcha anual de la temperatura, enero presenta el promedio menor de las temperaturas mínimas mensuales (ptmm) con 15.7 °C; mientras que en junio el ptmm
Revista Chapingo Serie Horticultura | Vol. XXIII, núm. 3, septiembre-diciembre 2017.
Rivas-Valencia et al.
drought, little thermal oscillation and a Ganges-type annual temperature march. This is not a common climate in which severe isolates are developed and expressed, except in Florida, U.S.A. (Table 5). In Tamaulipas, even though the incidence of severe isolates was recorded, in subsequent years it was not possible to detect them again (Rivas-Valencia et al., 2010), indicating the effect of temperature on severe isolates. In the annual temperature march, January has the lowest average monthly minimum temperature (ammt) with 15.7 °C, while in June the ammt reaches its maximum value with 21.4 °C. Similarly, January shows the lowest average monthly maximum temperature
alcanza su máximo valor con 21.4 °C. De manera análoga, en enero se presenta el promedio menor de temperaturas máximas mensuales (PTMM) con 30.8 °C; mientras que en mayo alcanza su valor máximo con 36.8 °C. Esta variación se traduce frecuentemente en una oscilación térmica diaria (OT) muy extremosa, que en mayo alcanza 19.6 °C (Figura 5B). Estas condiciones son restrictivas durante la mitad del año para los componentes involucrados en el patosistema estudiado. Aunque Florida comparte un clima similar con Yucatán, en los sitios con expresión de aislados severos, la oscilación térmica mensual se define como extremosa (Cuadro 5). El CTV depende de los áfidos involucrados para la transmisión; sin embargo, éstos pierden su capacidad
Table 5. Climate and thermal condition of sites with incidence of severe isolates of the citrus tristeza virus. Cuadro 5. Clima y condición térmica de sitios con incidencia de aislados severos del virus de la tristeza de los cítricos. Classification of TO /
Site ⁄ Sitio
Type of CTVz isolate / Tipo de aislado de CTVz
Climate§ / Clima§
Annual TO ∕
OT anual
Monthly TO / OT mensual
Dzán, Yucatán, México
NS*
Aw1w’’(i’)g
5.6
14.5
VE/ ME
Mante, Tamaulipas, México
S
Aw 0w’’(e’)
10.8
13.5
E
Cundinamarca, Bogotá, Colombia
S
Cb’(w2)(x’)w’’ig
1.45
8.5
E
Meta, Villavicencio, Colombia
S
Am(i)g
2.7
9.4
E
Ora, Salta, Argentina
S
(A)Ca(w2)(w)w’’(e)
11.6
11.3
E
Montecasero, Corrientes, Argentina
S
(A)Ca f w’’(e)
13.5
10.7
E
Entre Ríos, Concordia, Argentina
S
(A)Ca(fm)w’’(e’)
14.1
11.7
E
Tucuman, Alta Gracia, Argentina
S
(A)Ca(w2)(w)(e)
13.2
11.6
E
Jujuy, Calilegua, Argentina
S
(A)Ca(w 0)(w)(e)
12.2
12.6
E
S
(A)Ca s(e)
13
7.8
E
Marcus, Salomon, and Bar-Joseph (1987)
Seferihisar, Izmir, Turkey / Seferihisar, Izmir, Turquía
S
Ca s(e’)
18.9
9.2
E
Çevik, Yardimci, and Korkmaz (2013)
Kastela, Split, Croatia / Kastela, Split, Croacia
S
Ca s(e’)
18
6.4
E
Černi et al. (2005)
Immokalee, Florida, United States / Immokalee, Florida, Estados Unidos
S
Aw1(x’)w’’(e)
10.5
10.1
E
Halbert et al. (2004)
Sharon plain, Tel Aviv, Israel
Data obtained from the World Meteorological Organization (WMO, 2016). z CTV = citrus tristeza virus, TO = thermal oscillation. *NS = non-severe isolate, S = severe isolate, I = isothermal, E = extreme, VE = very extreme. § Climates classified according to García (1998). Datos obtenidos del World Meteorological Organization (WMO, 2016). z CTV = virus de la tristeza de los cítricos, OT = oscilación térmica. *NS = aislado no severo, S = aislado severo, I = isotermal, E = extremoso, ME = muy extremoso. § Climas clasificados según García (1998).
Revista Chapingo Serie Horticultura | Vol. XXIII, núm. 3, septiembre-diciembre 2017.
Clasificación de la OT
Citation /
Cita
Loeza-Kuk et al. (2005) Oliveros-Garay, MartínezSalazar, Torres-Ruiz, and Acosta (2009)
Iglesias et al. (2008)
197
In Yucatán, favorable temperatures for the pathosystem are partially reached from October to December and from January to March, which coincides with the findings previously reported by Patiño-Arellano, RodríguezLeyva, Mora-Aguilera, Lomelí-Flores, and Díaz-Gómez (2012), where the abundance of T. citricida, T. aurantii, A. spiraecola and A. gossypii populations is concentrated in those months. Even so, in this interval the TO is extreme (10 to 14 °C), or eventually very extreme (> 14 °C, Figure 5B). These values are a stress factor, even more important than the minimum and maximum temperatures per se. Studies on the impact of extreme TO reveal an increase in mortality of other insects (Ma, Hoffmann, & Ma, 2015), especially when maximum environmental temperatures exceed lethal levels for the insect (Chanthy, Martin, Gunning, & Andrew, 2012). In Yucatán, the months with the highest number of hours conducive to aphids and the virus (>22 14 °C; Figura 5B). Estos valores son un factor de estrés, incluso más importante que las temperaturas mínimas y máximas
Revista Chapingo Serie Horticultura | Vol. XXIII, núm. 3, septiembre-diciembre 2017.
Rivas-Valencia et al.
trees, even with the presence of T. citricida, which has not occurred in other producing areas (Matos et al., 2013). However, this does not exempt the structure from being modified by severe isolates such as T-36 or VT, as in other producing areas (da Graça & van Vuuren, 2010; Roistacher, da Graça, & Müller, 2010). In the Dominican Republic over a 10-year period, T-30 isolates were displaced by T-36 and VT, introduced by the exchange of infected propagating material (Matos et al., 2013). In Yucatán, the use of sour orange as a rootstock is a risk factor in two ways: 1) for its susceptibility to CTV and 2) for the unknown origin and quality of the propagating material used, which sometimes does not comply with NOM-079-FITO-2002 (SAGARPA 2002). Conclusions Changes in the pathogen’s population structure were identified in the trees of the orchards studied; however, no severe CTV symptoms or isolates were found, nor was there a significant detriment to the vigor of the CTVpositive trees. Nonetheless, CTV dispersion increased by 40 % in four years. Among the climatic variables, the daily thermal oscillation and the number of hours conducive to the pathosystem operate to its detriment and reduce its impact, making this a restrictive thermal regime. These conditions have allowed the sour orange rootstock to persist as the producers’ preferred choice. However, it is necessary to provide alternative rootstocks, due to the risk that exists in the commercialization of propagating material that does not comply with the regulations. End of English version References / Referencias Albiach-Martí, M. R., Mawassi, M., Godwa, S., Satyanarayana, T., Hilf, M. E., Shanker, S.,… Dawson, W. O. (2000). Sequences of citrus tristeza virus separated in time and space are essentially identical. Journal of Virology, 74(15), 6856-6865. doi: 10.1128/JVI.74.15.68566865.2000 Albiach-Martí, M. R., Robertson, C., Gowda, S., Tatineni, S., Belliure, B., Garnsey, S. M., Folimonova, S. Y., Moreno, P., & Dawson, W. O. (2010). The pathogenicity determinant of Citrus tristeza virus causing the seedling yellows syndrome maps at the 30-terminal region of the viral genome. Molecular Plant Pathology, 11(1), 55-67. doi: 10.1111/j.1364-3703.2009.00572.x Ananthakrishnan, G., Venkataprassana, T., Roy, A., & Brlansky, R. H. (2010). Characterization of the mixture of genotypes of a citrus tristeza virus isolate by reverse transcription-quantitative real-time PCR. Journal of Virological Methods, 164(1-2), 75-82. doi: 10.1016/j.jviromet.2009.12.001 Ayllón, M. A., López, C., Navas-Castillo, J., Garnsey, S. M.,
per se. Estudios del impacto de OT extremosas revelan un aumento en la mortalidad de otros insectos (Ma, Hoffmann, & Ma, 2015), sobre todo cuando las temperaturas máximas ambientales exceden las críticas letales para el insecto (Chanthy, Martin, Gunning, & Andrew, 2012). En Yucatán, los meses con el mayor número de horas propicias para los áfidos y el virus (>22