Coll-de-Tuero et al. BMC Nephrology 2012, 13:87 http://www.biomedcentral.com/1471-2369/13/87
RESEARCH ARTICLE
Open Access
Chronic kidney disease in the type 2 diabetic patients: prevalence and associated variables in a random sample of 2642 patients of a Mediterranean area Gabriel Coll-de-Tuero1, Manel Mata-Cases2, Antonio Rodriguez-Poncelas3*, Josep MA Pepió4, Pilar Roura5, Belen Benito6, Josep Franch-Nadal7 and Marc Saez8
Abstract Background: Kidney disease is associated with an increased total mortality and cardiovascular morbimortality in the general population and in patients with Type 2 diabetes. The aim of this study is to determine the prevalence of kidney disease and different types of renal disease in patients with type 2 diabetes (T2DM). Methods: Cross-sectional study in a random sample of 2,642 T2DM patients cared for in primary care during 2007. Studied variables: demographic and clinical characteristics, pharmacological treatments and T2DM complications (diabetic foot, retinopathy, coronary heart disease and stroke). Variables of renal function were defined as follows: 1) Microalbuminuria: albumin excretion rate > 30 mg/g or 3.5 mg/mmol, 2) Macroalbuminuria: albumin excretion rate > 300 mg/g or 35 mg/mmol, 3) Kidney disease (KD): glomerular filtration rate according to Modification of Diet in Renal Disease < 60 ml/min/1.73 m2 and/or the presence of albuminuria, 4) Renal impairment (RI): glomerular filtration rate < 60 ml/min/1.73 m2, 5) Nonalbuminuric RI: glomerular filtration rate < 60 ml/min/1.73 m2 without albuminuria and, 5) Diabetic nephropathy (DN): macroalbuminuria or microalbuminuria plus diabetic retinopathy. Results: The prevalence of different types of renal disease in patients was: 34.1% KD, 22.9% RI, 19.5% albuminuria and 16.4% diabetic nephropathy (DN). The prevalence of albuminuria without RI (13.5%) and nonalbuminuric RI (14.7%) was similar. After adjusting per age, BMI, cholesterol, blood pressure and macrovascular disease, RI was significantly associated with the female gender (OR 2.20; CI 95% 1.86–2.59), microvascular disease (OR 2.14; CI 95% 1.8–2.54) and insulin treatment (OR 1.82; CI 95% 1.39–2.38), and inversely associated with HbA1c (OR 0.85 for every 1% increase; CI 95% 0.80–0.91). Albuminuria without RI was inversely associated with the female gender (OR 0.27; CI 95% 0.21–0.35), duration of diabetes (OR 0.94 per year; CI 95% 0.91–0.97) and directly associated with HbA1c (OR 1.19 for every 1% increase; CI 95% 1.09–1.3). Conclusions: One-third of the sample population in this study has KD. The presence or absence of albuminuria identifies two subgroups with different characteristics related to gender, the duration of diabetes and metabolic status of the patient. It is important to determine both albuminuria and GFR estimation to diagnose KD. Keywords: Kidney disease, Renal impairment, Albuminuria, Diabetic nephropathy
* Correspondence:
[email protected] 3 Primary Healthcare Center Anglès, Research Unit, I.A.S, Salt, Spain Full list of author information is available at the end of the article © 2012 Coll-de-Tuero et al.; licensee BioMed Central Ltd. This is an Open Access article distributed under the terms of the Creative Commons Attribution License (http://creativecommons.org/licenses/by/2.0), which permits unrestricted use, distribution, and reproduction in any medium, provided the original work is properly cited.
Coll-de-Tuero et al. BMC Nephrology 2012, 13:87 http://www.biomedcentral.com/1471-2369/13/87
Background The concept of kidney disease is based on the presence of albuminuria and/or impaired renal function that lasts for more than three months [1]. Kidney disease is associated with an increased total mortality and cardiovascular morbimortality in the general population [2] and in patients with Type 2 diabetes (T2DM) [3]. Patients with T2DM with renal impairment have an increased mortality risk, specially a higher risk of cardiovascular (CV) death, when compared to other diabetic patients without renal impairment [4]. Moreover, albuminuria predicts an increased risk of myocardial infarction, stroke, CV death, total death and heart failure in patients with T2DM in comparison with non-diabetic patients [5]. However, not all T2DM patients with renal impairment have albuminuria [6]. Therefore, the National Kidney Foundation (NKF) [1] recommends the determination of plasma creatinine to estimate glomerular filtration rate (GFR), because renal impairment and albuminuria are independently associated with strokes [7]. The simultaneous presence of renal impairment and albuminuria is associated with an increased risk of CV morbidity, increased risk of total mortality, and progression of renal disease [8]. During a 15-year follow-up, the United Kingdom Prospective Diabetes (UKPDS) study showed that 5% of the patients with T2DM had a 2-fold increase in creatinine levels, 20% had macroalbuminuria defined as a urinary albumin concentration ≥ 300 mg/l, 40% developed renal impairment, 45% developed microalbuminuria defined as a urinary albumin concentration 50–299 mg/l and 75% experienced a CV event [9]. Early detection of kidney disease in patients with diabetes is important because close monitoring of cardiovascular risk factors, and specific drugs acting on the renin-angiotensin system slow down the progression of renal disease [10]. There have been several reports on the prevalence of kidney disease and forms of renal disease in patients with T2DM of Mediterranean countries [11-13]. Only one study has been conducted in a randomly selected population sample in Spain [14], and they characterized renal impairment regardless of albuminuria. The main objective of this study was to determine the prevalence of kidney disease in patients with T2DM, forms of renal disease (renal impairment, albuminuria, renal impairment without albuminuria, nonalbuminuric renal impairment and diabetic nephropathy) and associated variables in a large sample of patients in primary care. Methods Study design and organization The Continuous Quality Improvement Gedaps program gathered information from primary care centres on the clinical markers and health outcomes a sample of patients. A detailed description of the evaluation methodology has been previously
Page 2 of 9
described [15]. During the last evaluation in 2007, several meetings around Catalonia were conducted to encourage the involvement in the study regardless of participation in previous evaluations, and to present changes in the data entry using a webpage (http://www.redgdps.org/index.php? idregistro=259). Health providers were instructed to obtain a random sample from the medical records of patients with T2DM with more than six months follow-up from diagnosis. A total sample of 5 patients multiplied by the number of basic care units (physician/nurse) with a minimum of 30 patients per centre was required. The exclusion criteria were as follows: type 1 diabetes mellitus; follow-up exclusively conducted by an endocrinologist; and short life expectancy (terminal patients or those who received home care). Only patients with plasma creatinine available were included for the current study. Due to the retrospective nature of the study, based only on clinical records, patients were not required to give written informed consent. To assure anonymity data were collected and recorded using two different files: one included demographic variables and the other one clinical variables linked by a consecutive record number. The study design and the GCQI program were presented and approved by the Consell Assessor de la Diabetes (Advisory Board on Diabetes) of the Health Departament of the Autonomous Government in Catalunya that acted as Institutional Review Board. Study population The following demographic and clinical characteristics were compared: age, gender, weight, height, BMI, blood pressure, HbA1c, creatinine, total cholesterol, HDL cholesterol, albuminuria, duration of diabetes (in years), estimated cardiovascular risk according to the Framingham equation calibrated to the Spanish population [16] (threshold > 10% at 10 years), antidiabetic treatment, antihypertensive treatment, lipid-lowering therapy, antiplatelet therapy, and smoking status. Obesity was considered if the BMI was greater than 30 kg/m2. We found 1164 type 2 diabetic patients who had no available albuminuria. Figure 1 shows the samples used to calculate the prevalence of the different forms of kidney disease. The following outcomes were considered: diabetic foot (ulcers and amputations), retinopathy, coronary heart disease (CHD, including angina), and stroke (including transient ischemic attack). Two composite variables including all microvascular complications (albuminuria and/or retinopathy) and macrovascular complications (CHD and/or stroke) were separately created. All collected data included the last value recorded in the medical records during 2007. NKF [1] defines chronic kidney disease by the persistence of a low GFR and/or albuminuria during a period of at least three months. In our study, since no previous measurement of creatinine or albuminuria was available,
Coll-de-Tuero et al. BMC Nephrology 2012, 13:87 http://www.biomedcentral.com/1471-2369/13/87
Page 3 of 9
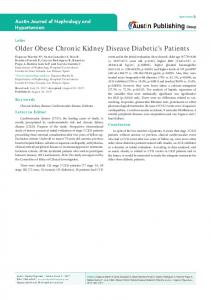
Random sample of patients with T2DM included in the 2007 Gedaps evaluation (n= 3150)
Type 2 diabetic patients with creatinine available (n= 2,642)
Prevalence of renal impairment
Type 2 diabetic patients with available urinary albumin excretion rate (n= 1,478)
Prevalence of kidney disease according to KDIGO worgroup, nonalbuminuric renal impairment and albuminuria alone. Figure 1 Flow-chart of study.
it was impossible to know whether or not these conditions had persisted longer than three months. Thus, we defined kidney disease based and renal impairment based on a single determination. Serum creatinine was measured on a multiparameter analyzer (Cobas 711, Roche Modular System, Indianapolis, IN, USA) by the Jaffé Method with bichromatic measurements according to the manufacturer’s specifications. Albuminuria was measured by inmmunoturbidimetry on a Cobas 400 analyzer (Roche, Indianapolis, IN, USA). The GFR was calculated using the equation previously published by the MDRD study group [17]. Variables of renal function were defined as follow: 1) Microalbuminuria: Albumin excretion rate (AER) > 30 mg/g (3.5 mg/nmol), 2) Macroalbuminuria: AER > 300 mg/g (35 mg/nmol), 3) Kidney disease: GFR < 60 ml/min/1.73 m2 and/or the presence of micro or macroalbuminuria, 4) Renal impairment: GFR < 60 ml/min/1.73 m2, 5) Nonalbuminuric renal impairment: GFR < 60 ml/min/1.73 m2 without micro or macroalbuminuria and, 5) Diabetic nephropathy (DN): macroalbuminuria or microalbuminuria plus diabetic retinopathy [18]. Patients with available creatinine and UAER were also classified according to the recent proposal of KDIGO workgroup [19]. Statistical analysis Quantitative variables were described using means and standard deviations. Categorical variables were summarised using absolute and relative frequencies (i.e., percentages). Bivariate relationships between categorical variables were tested using non-parametric chi-squared tests. Bivariate relationships between categorical and quantitative variables were assessed using ANOVA tests (one factor). Descriptive statistics and bivariate inferences were
performed using the SPSS (v. 15) statistical program. The multivariate analyses of variables associated with different types of kidney disease in patients with T2DM were assessed by means of logistic regressions. The variables for the adjustment were selected on the basis of significant bivariate relationships. Response variables were assigned a value of 1 when the particular type of kidney disease (i.e., renal impairment, DN and kidney disease) occurred, and patients without any type of kidney disease were assigned a value of 0. The estimation of the logistic regressions was performed using the R freeware statistical package (version 2.11.1).
Results Sample characteristics
From a total sample of 3150 patients with T2DM included in the 2007 Gedaps evaluation, we included 2,642 patients who have a plasma creatinine available. Mean age was 68 years (SD 11.6), and 51.5% of the patients were men. The average duration of diabetes was 7 years (SD 5.6). The mean HbA1c was 6.84% (SD 1.46), and 67.6% of patients had an HbA1c value less than or equal to 7%. The mean blood pressure was 137/ 76 mmHg. Table 1 shows the main characteristics of the population. To rule out a bias attributable to patients without albuminuria data, we compared a subgroups with available albuminuria data (1,478 patients), and to the 1,164 patients not having albuminuria data. Of all variables compared (age, gender, years of evolution, HbA1c, systolic blood pressure, diastolic blood pressure and creatinine), only age showed differences (67.59 vs 68.58; p = 0.03).
Coll-de-Tuero et al. BMC Nephrology 2012, 13:87 http://www.biomedcentral.com/1471-2369/13/87
Page 4 of 9
Table 1 Characteristics of the sample of patients with type 2 diabetes (n = 2,642) Total
Men
Women
p value
68.06 (11.60)
66.81 (11.63)
69.31 (11.59)
< 0.001
Gender,n (%)
2642
1361 (51.5)
1281(48.5)
ns
Years of diabetes duration, mean (SD)
7.05 (5.60)
6.58 (5.06)
7.39 (6.04)
10 years, n (%)
497 (18.8)
231 (17.0)
266 (20.8)
< 0.05
BP, mmHg,mean (SD)
137.23/76.52 (14.60/9.05)
136.98/76.49 (14.68/9.10)
137.08/76.43 (14.71/8.89)
ns SBP ns DBP
Hypertension,n (%)
1847 (69.9)
894 (65.6)
953 (74.3)