PNAS PLUS
Circadian clock-dependent and -independent posttranscriptional regulation underlies temporal mRNA accumulation in mouse liver Jingkui Wanga,1, Laura Symula,1, Jake Yeunga, Cédric Gobeta,b, Jonathan Sobela, Sarah Lückc, Pål O. Westermarkd, Nacho Molinae, and Felix Naefa,2 a Institute of Bioengineering, School of Life Sciences, Ecole Polytechnique Fédérale de Lausanne, CH-1015 Lausanne, Switzerland; bNestlé Institute of Health Sciences, CH-1015 Lausanne, Switzerland; cInstitute for Theoretical Biology, Charité–Universitätsmedizin Berlin, D-10115 Berlin, Germany; dInstitute of Genetics and Biometry, Leibniz Institute for Farm Animal Biology, D-18196 Dummerstorf, Germany; and eInstitut de Génétique et de Biologie Moléculaire et Cellulaire, CNRS, INSERM, University of Strasbourg, 67404 Illkirch, France
The mammalian circadian clock coordinates physiology with environmental cycles through the regulation of daily oscillations of gene expression. Thousands of transcripts exhibit rhythmic accumulations across mouse tissues, as determined by the balance of their synthesis and degradation. While diurnally rhythmic transcription regulation is well studied and often thought to be the main factor generating rhythmic mRNA accumulation, the extent of rhythmic posttranscriptional regulation is debated, and the kinetic parameters (e.g., half-lives), as well as the underlying regulators (e.g., mRNA-binding proteins) are relatively unexplored. Here, we developed a quantitative model for cyclic accumulations of premRNA and mRNA from total RNA-seq data, and applied it to mouse liver. This allowed us to identify that about 20% of mRNA rhythms were driven by rhythmic mRNA degradation, and another 15% of mRNAs regulated by both rhythmic transcription and mRNA degradation. The method could also estimate mRNA halflives and processing times in intact mouse liver. We then showed that, depending on mRNA half-life, rhythmic mRNA degradation can either amplify or tune phases of mRNA rhythms. By comparing mRNA rhythms in wild-type and Bmal1−/− animals, we found that the rhythmic degradation of many transcripts did not depend on a functional BMAL1. Interestingly clock-dependent and -independent degradation rhythms peaked at distinct times of day. We further predicted mRNA-binding proteins (mRBPs) that were implicated in the posttranscriptional regulation of mRNAs, either through stabilizing or destabilizing activities. Together, our results demonstrate how posttranscriptional regulation temporally shapes rhythmic mRNA accumulation in mouse liver.
|
circadian clock posttranscriptional regulation RNA binding proteins
if an mRNA is rhythmically transcribed but degraded at a constant rate, the peak of mRNA abundance (phase) will be delayed between 0 h and maximally 6 h after synthesis, with a damped oscillation. However, if degradation rate is also rhythmic, then the phase delay can flexibly vary between 0 and 24 h, and the relative amplitudes could be either damped or magnified. Thus, the combined effects of rhythmic synthesis and rhythmic degradation can, in principle, lead to temporal gene expression profiles with diverse amplitudes and phases (9). Mechanisms regulating the degradation of transcripts include the recruitment of RNA-binding proteins (RBPs) to the 3′-untranslated region (3′-UTR) of transcripts, as well as targeting of transcripts by miRNAs (10). Biochemical studies of individual genes have shown that half-lives of mRNAs can fluctuate during the circadian cycle (11). Notably, studies on mammalian core clock genes, such as Per1 (12), Per2 (13), Per3 (14–16), and Cry1 (17), found fluctuating mRNA half-lives governed by RNA-binding regulators. mRNA degradation also regulates systemically driven rhythmic transcripts, such as Tfrc, Fus, and Cirbp (7, 18). However, understanding how the respective contributions of transcription and mRNA degradation shape temporal regulation of physiology Significance Rhythms in gene expression propelled by the circadian clock and environmental signals are ubiquitous across cells and tissues. In particular, in mouse tissues, thousands of transcripts show oscillations with a period of 24 hours. Keys question are how such rhythms propagate and eventually exert functions, but also how these are generated. Here, we developed a mathematical model based on total RNA-seq to classify genes according to the respective contributions of transcriptional and posttranscriptional regulation toward mRNA expression profiles. We found that about one-third of rhythmically accumulating mRNA are under posttranscriptional regulation. Such regulation is only partially dependent on the circadian clock, showing that systemic pathways and feeding patterns contribute important posttranscriptional control of gene expression in liver.
| mRNA half-lives |
S
tudies of circadian rhythms have shown how life on Earth resonates to the daily recurring environmental cycles, with profound influences on multiple levels, ranging from behavior to physiology, all of the way to gene expression rhythms in organs and individual cells (1, 2). One of the most intriguing questions in chronobiology is how the transmission of rhythmic signals from the core oscillator to clock output functions is implemented across the many regulatory layers of gene expression (3). Significant fractions, up to 20%, of expressed transcripts are found to oscillate with a 24-h period in various organs (4). In mouse liver, genome-wide profiling of transcription and RNA accumulation over the 24-h day showed that mRNA abundances can oscillate without rhythmic transcription, suggesting posttranscriptional control of a significant fraction of the rhythmic transcriptome (5–8). Whether the mRNA degradation rate of a transcript, or equivalently its half-life, is constant or rhythmic predicts quantitatively distinct temporal profiles of mRNA accumulation (9). Specifically,
www.pnas.org/cgi/doi/10.1073/pnas.1715225115
Author contributions: F.N. designed research; J.W., L.S., J.Y., C.G., and N.M. performed research; J.S., P.O.W., and N.M. contributed new reagents/analytic tools; J.W., L.S., J.Y., C.G., and S.L. analyzed data; and J.W., L.S., J.Y., and F.N. wrote the paper. The authors declare no conflict of interest. This article is a PNAS Direct Submission. This open access article is distributed under Creative Commons Attribution-NonCommercialNoDerivatives License 4.0 (CC BY-NC-ND). 1
J.W. and L.S. contributed equally to this work.
2
To whom correspondence should be addressed. Email:
[email protected].
This article contains supporting information online at www.pnas.org/lookup/suppl/doi:10. 1073/pnas.1715225115/-/DCSupplemental.
PNAS Latest Articles | 1 of 10
SYSTEMS BIOLOGY
Edited by Joseph S. Takahashi, Howard Hughes Medical Institute and University of Texas Southwestern Medical Center, Dallas, TX, and approved January 5, 2018 (received for review August 29, 2017)
and gene expression in a complex organ such as the liver remains challenging at a genome-wide scale. While transcription during the diurnal cycle in tissues can be estimated in vivo through Pol II loading on genes (7), or approximated with nascent RNA (6) or pre-mRNA (5, 8, 19), direct measurements of mRNA degradation rates, which may also vary over the course of the day, poses challenges. Experimental approaches using inhibitors of transcription as well as metabolic pulse labeling of nascent RNA can yield genome-wide insights in mRNA production and degradation in eukaryotic cells (20–24). However, these techniques may complicate analyses due to potential biases. For example, antibiotics that block transcription can arrest growth, and metabolic labeling of RNAs can inhibit rRNA synthesis (25, 26). While these methods have been successfully used in plants (27), they are not currently adapted to measure dynamics of synthesis and degradation of mammalian mRNAs in vivo, such as in the intact liver. Noninvasive techniques such as dual-color labeling of introns and exons by single-molecular FISH could infer transcription and degradation rates of individual genes in mouse liver, although this approach relied on other quantities that are also challenging to measure, such as transcription elongation rates (28). Recently, a promising avenue to identify regulatory control points in gene expression is to integrate measurements on multiple omics levels with predictions from kinetic production–degradation models (9, 18, 22, 29, 30). Here, we extended the approach in ref. 9 by developing a model selection framework to systematically identify the contributions of transcriptional and posttranscriptional regulation from times series pre-mRNA and mRNA profiles in mouse liver, without additional external input such as mRNA half-lives. We found that rhythmic transcription with constant mRNA degradation drove a majority of rhythmic mRNAs (∼65%), while rhythmic mRNA degradation with constant or rhythmic transcription regulated ∼35%. Importantly, our method yielded estimates of mRNA half-lives and RNA processing times for thousands of transcripts in mouse liver. We predicted rhythmically active RBPs that regulate rhythmic mRNA degradation. Overall, our analysis revealed that rhythmic mRNA degradation is exploited not only to generate rhythms but also to flexibly fine-tune oscillatory amplitudes and peak timings of mRNA rhythms depending on the mRNA half-life. Finally, we analyzed transcriptomes of liver from Bmal1−/− mice to show that rhythmic mRNA degradation was often independent of functional BMAL1, but originated most likely from systemic signals driven by feeding–fasting or sleep–wake cycles. Results A Kinetic Model Identifies Rhythmically Transcribed and Rhythmically Degraded Transcripts from Total RNA-Seq. The temporal accumu-
lation of mRNAs in cells is governed by many processes including transcription, (cotranscriptional) splicing, polyadenylation, mRNA export, and mRNA degradation. In the context of 24-h diurnal rhythms, we can assume that mRNA levels are for the most part determined by the kinetics of transcription and mRNA degradation, since the other RNA processing steps occur on faster timescales (28, 31–33). Here, we combined a kinetic model for mRNA accumulation with time course measurements of pre-mRNA and mRNA (Fig. 1A) simultaneously quantified from the same biological samples, using recently published RNA-seq data from 48 total RNA time points collected along a daily cycle with 2-h resolution in mouse liver (8) (SI Materials and Methods and Dataset S1). To confidently use those RNA-seq data to distinguish between rhythmic transcript synthesis and degradation, we first confirmed that temporal profiles for the pre-mRNAs of circadian clock genes, estimated using intronic reads (Materials and Methods), corroborated with those estimated from nascent RNA sequencing (Fig. S1A) (6). Indeed, because pre-mRNAs are short lived 2 of 10 | www.pnas.org/cgi/doi/10.1073/pnas.1715225115
and rapidly processed within seconds to minutes (22, 23, 29, 34), their profiles estimated from total RNA-seq have been shown to provide good proxies for transcription (5, 19, 30, 35). Genomewide, the peak times (also referred to as phases) of pre-mRNA accumulation for cycling genes identified from total and nascent RNA-seq data were highly correlated (Fig. S1B). As expected from previous works on daily rhythmic transcription (5–7, 36), pre-mRNAs showed a biphasic enrichment near ZT8 (ZT, zeitgeber time) and ZT20 (Fig. S1 C and D), consistent with the day and night transcriptional waves in the liver. Moreover, premRNA levels preceded the accumulation of the corresponding mRNAs by 1.7 h on average (Fig. S1E). Assuming constant mRNA degradation, the relative amplitudes of pre-mRNAs would be higher than those of mRNAs, which is observed on average (Fig. S1E). However, the observed subset of transcripts with higher peak-to-trough amplitudes in the mRNA likely indicates posttranscriptional regulation, as analyzed below. In the following, we often use the term amplitude for peak-to-trough amplitude, as it is clear from the context what is meant. Next, we developed a computational method to analyze rhythmic transcription and degradation, which uses absolute premRNA and mRNA levels as inputs to distinguish, on a gene-bygene basis, between four kinetic models (M1–M4) (Fig. 1A). These four models assume the following: constant RNA synthesis (CS) and constant degradation (CS-CD, also termed M1), or rhythmic synthesis (RS) and constant degradation (RS-CD or M2), constant synthesis and rhythmic degradation (CS-RD or M3), and rhythmic synthesis with rhythmic degradation (RS-RD or M4). By combining a maximum-likelihood approach with the Bayesian information criterion (BIC), we then select an optimal model. We first validated this model selection and parameter estimation by simulating data for all four models using realistic parameters, including noise levels (SI Materials and Methods). We found that the classification accuracy was nearly perfect for M1 and M2 (Fig. S2A). For M3, the performance depended on the amplitude of the simulated mRNA, but was near perfect for mRNA amplitudes above 1.1-fold (Fig. S2B). For M4, the classification properly identified rhythmic degradation when this changed the amplitude and peak time of mRNA levels beyond what is obtained from pure rhythmic synthesis (Fig. S2 A–C). These simulations also allowed us to determine when the kinetic parameters are reliably identifiable, and the regimes in which some parameters are structurally or practically not identifiable (SI Materials and Methods). In general, the estimated model parameters followed those in the simulations (Fig. S2D), including mRNA processing time and half-life, except for M3. Indeed, in M3, while the ratio of half-life to processing time is well estimated, we found that the mean half-life alone is often practically nonidentifiable (37) (Fig. S2 D–F). In this situation, we nevertheless obtain a lower bound on the relative amplitude of rhythmic mRNA degradation, which is biologically relevant. Moreover, the peak time of rhythmic degradation, whose precise estimation depends on the half-life, can still be placed within a 6-h window, from being antiphasic to that of mRNA accumulation, to peaking 6 h after peak mRNA accumulation. To assess whether half-life could be reliably identified, we implemented the profiling likelihood (PL) method (37) (SI Materials and Methods, Fig. S2F, and Dataset S1). We thus conclude that that despite the identifiability issue for kinetic parameters in M3, the model selection was overall able to detect even small temporal changes in rhythmic degradation (Fig. S2B). Given these validations, we then applied our model to the total RNA-seq measurements and retrieved the optimal model as well as the estimated parameters of 12,216 expressed genes in liver (SI Materials and Methods and Dataset S1). To appreciate the diversity of the temporal profiles and their regulations, we first show representative examples from each model (Fig. 1 B–D and Fig. S3 A–C). As expected, genes assigned to M2 (constant degradation, RS-CD) showed damped amplitudes and phase Wang et al.
PNAS PLUS SYSTEMS BIOLOGY
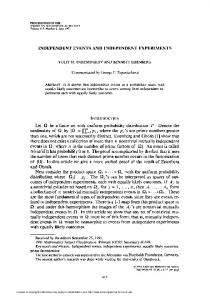
Fig. 1. Kinetic model identifies contributions and parameters of rhythmic transcription and rhythmic degradation regulating mRNAs from total RNA-seq. (A) Temporal accumulations of mRNA and pre-mRNA from time-resolved total RNA-seq were used to fit four kinetic models (M1–M4). The rate equation for the temporal accumulation of mRNA mðtÞ depends on pre-mRNA pðtÞ and the degradation rate γðtÞ, which are either constant or parameterized with periodic functions (Materials and Methods). The models allow for constant (C) or rhythmic (R) synthesis (S) and degradation (D) in the four combinations: M1 (constant synthesis and constant degradation, CS-CD), M2 (rhythmic synthesis and constant degradation, RS-CD), M3 (constant synthesis and rhythmic degradation, CS-RD), and M4 (rhythmic synthesis and rhythmic degradation, RS-RD). Probabilities for each model are estimated using Schwarz weights (Materials and Methods); the optimal model for each mRNA (one per gene; Materials and Methods) also yields gene-specific parameters (e.g., mRNA half-life, processing time, phases, and amplitudes of rhythmic degradation rates). We applied this approach genome-wide. (B–D) Temporal profiles of mRNA and pre-mRNA of genes assigned to models M2–M4. Data for mRNA (blue) and pre-mRNA (green) with error bars (SE over four biological replicates) are shown as relative expression, that is, the total normalized counts divided by the average value over time. Solid curves are the fitting for the optimal model and estimated parameters (blue, mRNA; green, pre-mRNA; red, degradation). Peak times (phase) and amplitudes are summarized in circle plots. The radial scale of these plots is relative to the largest relative amplitude of mRNA, pre-mRNA, or rhythmic degradation. Absolute half-lives [logð2Þ=γ 0, in hours], if identifiable, are labeled. (B) M2: (Left) Cp had long estimated hl (7.9 h), which damped amplitude of mRNA compared with that of pre-mRNA; (Right) Rorc mRNA was identified in M2 (RS-CD) with estimated constant hl of 2.1 h. (C) M3: Fus mRNA was identified in M3 (CS-RD). The peak time of rhythmic degradation (RD) was ZT18.3 and the relative amplitude of RD was 0.3. Mean half-life was nonidentifiable (Materials and Methods). (D) M4: (Left) Per3 mRNA was identified in M4 (RS-RD). The RD showed a maximum at ∼ZT18, and a relative amplitude of 0.5 mean degradation rate was identifiable with mean hl of 1.6 h; (Right) Cbs mRNA showed a phase delay between mRNA and pre-mRNA > 6 h, which could be explained by M4. Parameters of RD showed a maximum at ∼ZT9 with a mean hl of 8.6 h.
delays in temporal mRNA accumulation compared with premRNA. For example, Rorc showed mRNA accumulation with a short delay and slightly damped amplitude compared with premRNA (Fig. 1B); its mRNA half-life (hl) was estimated to be 2.1 h. Meanwhile, long-lived genes such as Cp (estimated hl, 7.9 h) had long phase delays (∼6 h) and significantly damped oscillations (more examples for M2 in Fig. S3A). Our approach also identified rhythmic mRNAs regulated by rhythmic degradation and constant synthesis (CS-RD, M3), such as Fus (Fig. 1C). This observation is consistent with previous studies showing Wang et al.
that Fus had constitutive RNA polymerase II (Pol II) loading and its mRNA rhythm was generated posttranscriptionally (7). Although the absolute value of the mRNA degradation rate for Fus was unidentifiable, we could estimate a peak-to-trough amplitude of at least 1.8-fold. Finally, we found that rhythmic synthesis and degradation (RS-RD, M4) can simultaneously regulate mRNA rhythms, resulting in amplified amplitudes or long phase delays (Fig. 1D and Fig. S3C). For instance, Per3 mRNA stability was previously reported as time dependent, besides being transcriptionally regulated by BMAL1:CLOCK (14, 16, 36). Here, we PNAS Latest Articles | 3 of 10
observed that Per3 mRNA accumulation oscillated with relative amplitude comparable, or only slightly higher, than the premRNA with a delay that was short given the estimated hl of 1.6 h (Fig. 1D, gray line). This short delay was accomplished by rhythmic mRNA degradation, which varied by approximately threefold during the day, with the peak at ZT18 (hl, 1 h) and the trough at ZT6 (hl, 3 h). Without rhythmic degradation, Per3 would either show dampened oscillations or lower average accumulation levels. Time of peak mRNA accumulation of Cbs, another M4 gene, occurred more than 6 h later than that of its pre-mRNA. This long delay follows from the combined rhythmic synthesis and degradation. These examples illustrate that rhythmic degradation can influence mRNA accumulation profiles in diverse manners, depending on the relationships of means values, phases, and amplitudes of mRNA synthesis and degradation, as detailed mathematically in ref. 9. Together, these results demonstrate that our model can reliably distinguish among different regulatory scenarios leading to rhythmically accumulating mRNAs, in particular ones involving rhythmic mRNA degradation. Despite some limitations for constantly transcribed genes, we could also estimate gene-specific parameters such as mRNA half-lives. Rhythmic Degradation Regulates 35% of Rhythmically Accumulating Transcripts. We then focused on the predicted classes for all
rhythmically accumulating mRNAs [6,014 mRNA profiles selected through harmonic regression, false discovery rate (FDR) < 5%] and assessed whether they fell into M2, driven by rhythmic transcription alone; M3, driven by rhythmic degradation alone; or M4, driven by both rhythmic transcription and degradation. Rhythmic transcription with constant degradation (M2) regulated 3,949 (∼65%) mRNAs (Fig. 2A), consistent with pre-
viously reported results (7, 9). Constant transcription with rhythmic degradation (M3) regulated 1,167 mRNAs (∼20%). Genes in M3 were enriched for translation regulation, RNA transport, and mRNA catabolic processes (Dataset S2). Last, rhythmic transcription and degradation combined (M4) controlled 898 mRNAs (15%), whose functions were enriched for lipid and steroid biosynthetic processes, and circadian regulation (Dataset S2). To assess these results using an independent approach, we applied the production–abundance test (PA test) to identify transcripts subjected to posttranscriptional regulation (9) (Dataset S3). The PA test is based on the null hypothesis of constant degradation rather than the data-driven model selection developed here, and is thus limited to the rejection of models M1/M2. The PA test requires proxies for transcription (Pol II ChIP, nascent RNAs, or pre-mRNAs), mRNA accumulation, and experimentally measured mRNA half-lives [e.g., from mouse fibroblast cell lines (21, 38)]. Transcripts identified as incompatible with M1/M2 by the PA test were clearly enriched in genes classified as M3 and M4 (Fig. 2B). Conversely, genes assigned to M3 and M4 by our method displayed overall lower significant scores by the PA test compared with M1 and M2 genes (Fig. 2B). We then investigated the phases and amplitudes of M2–M4 genes. We observed that, although the mechanisms generating the rhythms differed, peak times of rhythmic mRNAs were similar across the three groups (Fig. 2C). However, even though genes in M4 were more abundantly expressed compared with those in M2 or M3 (Fig. S3D), indicating that they might have longer half-lives, the peak-to-trough amplitudes of oscillating mRNAs in M4 were larger than ones in M2 or M3 (Fig. 2D; see also further discussion below). Interestingly, we found that
Fig. 2. Rhythmic mRNA degradation regulates 35% of rhythmically accumulating mRNAs (∼20% in M3 and 15% in M4). (A) Numbers and percentages of rhythmic mRNAs (6,014 with FDR < 0.05, harmonic regression) identified in M2 (3,949), M3 (1,167), and M4 (898). (B, Left) Percentages of mRNAs subjected to RD estimated using the PA test, which were assigned to either M3 or M4 by our method. The analysis is stratified in function of the stringency of the PA test (log10 P values). We used published measurements of half-lives from cell lines as input for the PA test. (Right) Distribution of P values from the PA test according to the classification from our method. (C and D) Distributions of peak times (C) and amplitudes (D) of rhythmic mRNAs in M2–M4.
4 of 10 | www.pnas.org/cgi/doi/10.1073/pnas.1715225115
Wang et al.
PNAS PLUS
mRNAs in M2, M3, and M4 more often showed a rhythmic poly(A) tail length compared with M1 (Fig. S3E), potentially due to the influence of poly(A) tail length on mRNA stability (39) and possibly reflecting the proposed coupling between rhythmic transcription and polyadenylation (39). Estimated mRNA Half-Lives and RNA Processing Times in Mouse Liver.
In addition to disentangling transcriptional and posttranscriptional contributions governing temporal mRNA profiles, our models estimated peak time and amplitude of rhythmic degradation as well as parameters that are otherwise difficult to estimate in vivo, notably mRNA degradation rate and pre-mRNA processing time (Fig. 3 A and B, Fig. S4A, and Dataset S1). mRNA half-lives in M2 and M4 (half-lives of M3 are not shown due to poor identifiability; see above) were overall short compared with the 24-h day, with a median of ∼2.5 h, consistent with the observation that most of mRNAs continued to oscillate (3). M4 was enriched in long half-lives compared with M2, with a long-tailed distribution ranging up to 20 h (Fig. 3A). mRNA half-lives of several core clock and clock output genes, for example, Clock, Per1/3, Nr1d1/2, and Dbp, were estimated between 1 and 2 h, which is in the range of estimates in cell culture (40) (Fig. 3C). Although the estimated half-lives in the liver correlated with measurements in NIH 3T3 cells (38) (Fig. S4A), the significant spread probably reflects cell type-specific degradation kinetics, in addition to technical variability. Of note, comparison of measured half-lives in NIH 3T3 and mouse embryonic stem cells (41) shows a similar dispersion (Fig. S4B). Since the PA test is sensitive to the half-lives used as input, the partial overlap between the two methods might reflect cell typespecific half-lives (Fig. 2B). Overall, half-lives estimated in mouse liver were shorter compared with those in cell lines. Likewise, the effective pre-mRNA processing times could be estimated for M2 and M4 (Fig. 3B). The found values in the range of 5–10 min are similar with earlier estimates in cell culture models (22, 23, 29, 42). Median processing times of mRNAs in both M2 and M4 were found around 7 min. Overall, we estimated half-lives and processing times for over 3,000 mRNA transcripts in mouse liver (Dataset S1), including those of core clock and clock output genes (Fig. 3C). At the genome-wide level, we observe a correlation between processing times and mRNA half-lives (Fig. S4A), which has been previously observed in mouse dendritic cells (22). Phases and Amplitudes of Rhythmic mRNA Degradation. Considering
only well-identified mRNA degradations for M3 and M4 (Materials and Methods), we found that the estimated phases and amplitudes (Fig. 4) were consistent with those from the PA test (Fig. S4C). Peak times of RD in M3 were distributed throughout Wang et al.
the day (Fig. 4A and Fig. S4D) but depleted around the day– night transition at ZT12. By contrast, peak times of mRNA degradation in M4 showed a marked peak at ZT12. Intriguingly, genes within this peak (between ZT10 and ZT16) encoded for proteins related to the endoplasmic reticulum and vesicle transport to the Golgi, such as Insig1, Sec13, Sec22b, and Sec23b (43, 44) (Dataset S4A). The amplitudes of mRNA degradation for M3 and M4 showed similar distributions (Fig. 4 and Fig. S4D) ranging up to 16-fold, with (∼30%) showing amplitudes greater than 2-fold. Several of those transcripts with high degradation fold changes (log2 FC > 2.5) were linked with RNA splicing [gene ontology (GO) term analysis, P = 9e-4]. Rhythmic mRNA Degradation Serves as an Amplifier for Long-Lived mRNAs and Phase Tuner for Short-Lived mRNAs. Why would a cell
use rhythmic degradation when it can generate rhythms transcriptionally? To address this question, we first analyzed the
Fig. 4. Phases and amplitudes of rhythmic mRNA degradation. (A and B) Distribution of estimated phases and peak-to-trough amplitudes (in log2) of rhythmic degradation in M3 (A) and M4 (B) for transcripts with identifiable and high-confidence degradation parameters (coefficient of variation of estimated relative amplitude 12 h). For C1, the 12-h delayed RD (relative to the peak synthesis) increased amplitudes of mRNA oscillations, which were even higher than those of the pre-mRNAs (Fig. 5C). Indeed, if mRNA degradation for those genes were set constant in simulations, mRNA oscillations were strongly dampened (Fig. 5C). Meanwhile, the peaks times of these mRNAs were not much affected by RD due to the 12-h phase delay between RD and RS (Fig. 5D). For illustration, rhythmic degradation amplified mRNA amplitudes of Smagp and Acat3 mRNA without affecting the phases (Fig. 5E and Fig. S5A). Thus, for C1 mRNAs, a possible role of RD is to compensate the damping caused by the mRNA half-life while maintaining the phase. In contrast to mRNAs in C1, the amplitudes of short-lived mRNAs in C2 and C3 were not much influenced by RD (Fig. 5 F and I). However, we found that the peak times of mRNAs were either advanced (C2) or delayed (C3) (Fig. 5 G and J) relative to simulated constant degradation. Rhythmic degradation of mRNAs in C2 advanced peak times of mRNAs by an average of 1.8 h (Fig. 5G), and thus mRNAs in C2 oscillated almost synchronously with the pre-mRNAs (Fig. 5G), and with comparable amplitudes (Fig. 5F). Many core clock and clock-controlled genes were found in C2 (Fig. 5H and Fig. S5B), illustrating the role of RD in advancing phases. Such genes included Wee1 kinase (Fig. 5H), an inhibitor of CDK1 during the cell cycle, reported as controlled by the circadian clock (45). Finally, we found that RD delayed peak times for mRNAs in C3 by an average of 2.7 h (Fig. 5J), while maintaining amplitudes (Fig. 5I). We note that some mRNA peak times were delayed beyond 6 h (the maximal allowed with only rhythmic transcription) compared with that of pre-mRNA (Fig. 5K and Fig. S5C). For example, rhythmic degradation enabled Slc4a4 mRNA to peak at ZT6, 6.5 h later than the pre-mRNA (Fig. 5K), while assuming constant degradation we would have expected only a 2-h delay. Our results thus suggest that rhythmic degradation of shortlived mRNAs tends to fine-tune phases, allowing mRNAs to either oscillate nearly in sync with pre-mRNAs, or delay peak times to beyond theoretical limits under constant degradation assumptions. On the other hand, rhythmic degradation in the case of longer-lived mRNAs primarily increased amplitudes.
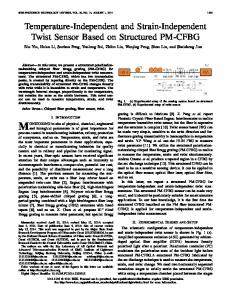
rhythmic parameters as under AL feeding (Fig. 6A, three top groups; see Materials and Methods for the selection of the groups), which is not surprising since such night RF only slightly perturbs the feeding rhythm (46). Second, loss of BMAL1 did not affect the rhythmic expression of 569 out of the 920 mRNAs (62%, top group in Fig. 6A), suggesting that a majority of rhythmic mRNA degradation does not depend on BMAL1, but may instead be regulated by systemic signals originating from feeding rhythms, light–dark, temperature, or sleep–wake cycles. Of the remaining 351 rhythmic mRNAs that were altered in Bmal1−/− (38%, second and third groups in Fig. 6A), 292 (32%, third group) became arrhythmic and 59 (6%, second group) remained rhythmic with shifted phases or altered amplitudes, indicating that their regulation depends on both BMAL1 and systemic cues. Interestingly, BMAL1-dependent and -independent mRNAs showed distinct phase distributions (Fig. 6B): mRNAs whose rhythmic degradation was BMAL1-independent (and thus driven by feeding rhythms or systemic signals) were enriched in the late morning (ZT6–ZT8), while those with BMAL1-dependent degradation enriched in the late night (ZT23). GO term analysis on these two groups (SI Materials and Methods and Dataset S4 B–D) showed that the BMAL1-dependent group was enriched in regulators of actin filament polymerization or the positive regulation of WNT signaling, while genes whose degradation was driven by rhythms in feeding or systemic signals were enriched in mRNA processing and transport pathways. Interestingly, this latter category contained genes related to poly(A) tail regulation and degradation (Pan2, Parn, Pabpc1, and Magohb) or involved in the promotion of nonsense mediated mRNA decay (Smg7, Upf3b, Ncbp2, and Etf1). Finally, we sought to identify putative regulators underlying rhythmic mRNA degradation in each group. We focused here on mRNA binding proteins (mRBPs) since mRNA rhythms were shown to be only weakly affected by perturbation of miRNA biogenesis in mouse liver (19). Briefly, we first used known mRBP target recognition specificities (binding motifs) (47) to scan the 3′-UTR regions of each mRNA. Next, we modeled the rhythmic degradation rates for each transcript as a linear combination of unknown mRBP activities associated with each mRBP binding motif (SI Materials and Methods and Dataset S6) (35, 48, 49). This method allowed us to predict the phase and amplitude of mRBP activities that optimally explained the rhythmic degradation rates of genes in the two main groups (Fig. 6C). In support of these predicted degradation activities, candidate mRBPs showed rhythmic accumulations in proteins from total liver extracts (50). Interestingly, mRBPs such as MATR3, NCL, FXR1, and NCL, oscillated in opposite phase of predicted degradation activity, corroborating with previous studies that these mRBPs can stabilize mRNAs (51–53) (Fig. 6D). Biochemical studies of SYNCRIP (HNRNP Q) have reported to increase (54) as well as decrease mRNA stability (15), depending on the specific mRNA studied. Taken together, our analyses suggest that mRNA accumulation in the liver is influenced by both clock-dependent and -independent control of mRNA stability, likely through the action of specific mRBP activities.
BMAL1 Dependence of Rhythmic mRNA Degradation in Liver. We next investigated the roles of the circadian clock and of rhythmic systemic cues in the temporal regulation of rhythmic mRNA degradation. For this, we compared the RNA-seq profiles from the WT ad libitum (AL) fed mice used so far with profiles from WT and Bmal1−/− mice under night-restricted feeding (RF) (food available only from ZT12 to ZT24, the period of activity for mice) (8). We focused on the genes classified in M3 under AL feeding, whose rhythmic mRNA expression is solely driven by rhythmic degradation (Dataset S5). First, the majority (79%, n = 920) of these mRNAs continued to oscillate under RF with the same
Discussion We developed a computational method to model temporal total RNA-seq profiles, which can distinguish contributions of transcription and mRNA degradation toward rhythmic mRNA accumulation. Applied to liver transcriptome, we found that about 35% of rhythmic mRNAs are regulated at the posttranscriptional level, most likely through rhythmic mRNA degradation. Such posttranscriptional rhythms could amplify the amplitudes or tune the phases of mRNA oscillations, enabling precise temporal control of mRNA levels. For example, we found that the phase of mRNA of clock genes, such as Per1 and Per3, and clock output
6 of 10 | www.pnas.org/cgi/doi/10.1073/pnas.1715225115
Wang et al.
PNAS PLUS SYSTEMS BIOLOGY
Fig. 5. Rhythmic mRNA degradation serves as an amplifier for long-lived mRNAs and phase tuner for short-lived mRNAs. (A, Left) Histogram of phase delays in M4 (peak time of RD minus peak time of RS). (Right) Phase delay vs. mRNA half-lives suggests three classes of transcripts. C1, Long-lived mRNAs (hl > 5 h; green); C2, short-lived mRNAs with short delay (hl < 5 h, delay < 12 h; orange); and C3, short-lived mRNAs with long delay (hl < 5 h, delay > 12 h; dark red). (B, Left) Histogram of relative amplitude ratio ð«γ =«s Þ between RD and RS. (Right) Scatterplot of relative amplitude ratio vs. mRNA half-life color-coded for C1–C3. (C) Scatterplot of relative amplitudes [(maximal expression − minimal expression)/2 × (mean of expression)] of mRNAs in C1 vs. predicted under assumption of constant degradation (Left) and vs. relative amplitudes of pre-mRNAs (Right) in log scale. (D) Scatterplot of peak times of mRNAs in C1 vs. predicted peak times under assumption of constant degradation (Left) and vs. peak times of pre-mRNAs (Right). (E, Left) Temporal profiles of pre-mRNA (green) and mRNA (blue) of C1 gene Smagp (values are normalized read counts divided by the temporal average; error bars show SE over four biological replicates). The gray line shows predicted mRNA profile under assumption of constant degradation (relative amplitude of mRNA degradation «γ set to zero). (Right) Arrows in the circle plot depict the phase (angular coordinate) and relative amplitude (radial coordinate) of pre-mRNA (green), mRNA (blue), and predicted mRNA under the assumption of constant degradation. (F–H) Idem as C–E for genes in C2. Rhythmic degradation advances peak times of mRNAs in C2 without affecting relative amplitude. Pre-mRNA and mRNA of Wee1 oscillates with comparable phases, whereas assuming constant degradation, its mRNA would show larger phase delays. (I–K) Idem for genes in C3. Rhythmic degradation delays peak times of mRNAs in C3 without affecting relative amplitude. Pre-mRNA and mRNA of Slc4a4 show large delays, whereas assuming constant degradation, its mRNA would show smaller phase delays (K). (A–K) Transcripts were selected as for Fig. 4, with, in addition, a threshold on the rhythmicity of their pre-mRNA and mRNA to ensure reliable phase estimation (FDR < 0.05 rhythmicity test, and relative amplitude >0.1; Materials and Methods).
Wang et al.
PNAS Latest Articles | 7 of 10
Fig. 6. BMAL1-dependent and -independent rhythmic mRNA degradation. (A) Heat map of mRNA relative expression of genes classified in M3 in mouse liver in the following conditions (biological replicates are averaged): WT ad libitum (AL WT, Right; this condition was used for the main analysis, 12 times points, 48 samples), WT restricted feeding (RF WT, Middle; 6 time points, 12 samples), and Bmal1−/− restricted feeding (RF Bmal1−/−; 6 time points, 12 samples). All data are from ref. 8 and provided in Dataset S5, together with the parameter estimates. Genes above the thickest horizontal separator have similar rhythmic parameters in AL WT and RF WT. The two thinner horizontal separators split the genes into those that keep the same rhythmic parameters in RF Bmal1−/− (Top, 569 mRNAs, group 1), those that are expressed in a constant manner (Bottom, 292 mRNAs, group 2), and those that exhibit 24-h oscillations with altered rhythmic parameters (Middle, 59 mRNAs). (B) mRNA peak time distributions for groups 1 and 2. (C) Phases of inferred activities of mRBP motifs in groups 1 (blue) and 2 (red). Activities are inferred using a penalized linear model that integrates mRBP binding site at the 3′-UTR of mRNA with phase and amplitude of mRNA degradation (Materials and Methods). Angles on the circle indicate peak activity times (ZT times). (D) Inferred activities and protein abundance of candidate mRBPs over time (50). mRBPs are predicted to regulate stability of transcripts from group 1 (plotted in blue), from group 2 (in red), or in some cases from both groups (in purple). Rhythmic activities that are antiphasic to rhythmic protein accumulation predict a stabilizing effect.
genes, such as Wee1 and Tef, are tuned to match that of premRNA accumulation, allowing phase to be encoded transcriptionally. In addition, this method allowed us to infer mRNA halflives and processing times of over 3,000 transcripts in the intact and unperturbed mouse liver. The kinetic models analyzed here provide more robust answers regarding the role of posttranscriptional regulation than simpler comparisons between oscillating pre-mRNA and mRNA. Indeed, even if pre-mRNA and mRNA are both rhythmic, rhythmic posttranscriptional regulations can still be involved. To overcome these caveats, our kinetic model takes into account relationships of peak times, amplitudes, and read counts of pre-mRNA and mRNA accumulations. Importantly, in contrast to previous methods (9), ours does not require experimentally measured mRNA half-lives as input, which are usually measured in cell culture experiments, but rather leverages the temporal RNA-seq profiles to estimate mRNA half-lives in intact organs over time of day. Although our method might underestimate the contribution of weakly rhythmic degradation, especially for transcripts with rhythmic pre-mRNA and mRNA levels (Fig. S2), our estimated 35% of rhythmic mRNAs subjected to circadian mRNA degradation is consistent with previous explicit kinetic models (7, 9). Other studies have found that a larger fraction of rhythmic mRNA (78%) could be regulated by rhythmic degradation (5), which may be partially due to low and noisy intron levels interpreted as constant synthesis. 8 of 10 | www.pnas.org/cgi/doi/10.1073/pnas.1715225115
Clearly, our mathematical model relies on a several assumptions regarding the kinetics of posttranscriptional processes. In particular, we assume that processes such as splicing, polyadenylation, or nuclear export occur on a faster timescale compared with mRNA degradation. In some cases, these assumptions might not hold. For instance, Cirbp was reported to be regulated on the level of both its splicing efficiency and mRNA degradation (18). Nevertheless, Cirbp was correctly classified as subject to posttranscriptional regulation. For simplicity, we have interpreted our results assuming that the profiles of pre-mRNA reflected the transcription rates. Although this might not always be the case, such as for Cirbp, where the oscillatory pre-mRNA originates from rhythmic splicing efficiency rather than transcription, the genome-wide similarity of nascent RNA and pre-mRNA profiles (Fig. S1 A and B) suggest that rhythmic transcription is the most frequent scenario. Moreover, the distribution of estimated mRNA half-lives and RNA processing times are in the range of previously measured values, indicating that our simple model captures the main dynamics regulating mRNA abundances. Regarding mRNA degradation, we have not considered the interesting possibility that mRNA aging, for example, through the shortening of poly(A) tails, might require more complicated modeling. Since a group of transcripts has been shown to exhibit deadenylation rhythms (39), a future extension of the model might explicitly consider mRNAs of different ages, and possibly infer aging parameters from measurements of poly(A) tail length distributions. In the current description, an effective rhythmic Wang et al.
Materials and Methods For each section below, further details are included in SI Materials and Methods. Data Processing for Total RNA-Seq in Mouse Liver Around the Clock. To quantify the temporal accumulation of pre-mRNA and mRNA in mouse liver, we used total RNA-seq data from ref. 8 (GEO accession no. GSE73554), in which livers of wild-type C57BL/6J male mice between 10 and 14 wk of age, under 12-h light/12-h dark and ad libitum feeding conditions, were collected every 2 h during 1 d (four biological replicates = 48 time points in total). Modeling the Temporal Profiles of mRNA and Pre-mRNA. Here, we modeled the temporal accumulations of mRNA with the following differential equation:
Model Selection with the Bayesian Information Criterion. To select the optimal model for each gene, given the measured read counts of mRNA and premRNA, an approach combining the maximum likelihood (55–57) and the Bayesian information criterion (BIC) was used: BIC = −log(L) + K log(N), in which log(L) is the log-likelihood, K is the number of parameters, and N is the number of data points. Validation of the Method with Simulations. To validate our model selection and parameter estimation, we tested the method with simulated data (200 synthetic genes) for models (M1–M4), taking kinetic parameters from realistic distributions. Inference of mRBPs Involved in Rhythmic mRNA Degradation. To infer mRBPs with rhythmic activities from the identified rhythmic mRNA degradations, we used genes from the two groups of Fig. 6 and mRBP motif library in ref. 47. 3′-UTR of mRNAs (RefSeq) for those genes were scanned with FIMO (58) to find hits to mRBP motifs, which are potentially responsible for rhythmic mRNA degradation. The rhythmic variation of mRNA degradation (in log scale) was assumed as a linear combination of diurnal activities of mRBP motifs [analogous to linear models for transcription factor activities (35, 48)]. To control for overfitting and also redundancy of motifs, we employed regularized elasticnet linear regression [implemented in R package glmnet (59)]. Rhythmicity Assessment Temporal RNA-Seq Datasets. Rhythmicity in mRNA abundances for transcripts classified in M3 (Dataset S1) in different conditions was assessed using a model selection approach as described in ref. 8. GO Analysis. GO analysis was performed using the TopGO R package (60).
in which m(t) and p(t) denote the temporal accumulations (concentrations) of mRNA (m) and pre-mRNA (p), respectively. In M1 and M3, pre-mRNA accumulation is described by a constant p0. γ(t) describes temporal varia-
ACKNOWLEDGMENTS. We thank Amit Zeisel and Eytan Domany for discussions at initial stages of the project, as well as David Gatfield and Hien Du for sharing results of unpublished experiments. This work was supported by Swiss National Science Foundation Grant 31003A-153340, European Research Council Grant ERC-2010-StG-260667, CycliX, a grant from the Swiss SystemsX.ch (www.systemsx.ch) initiative evaluated by the Swiss National Science Foundation, and by Ecole Polytechnique de Lausanne. J.Y. benefits from the Natural Sciences and Engineering Research Council of Canada Postgraduate Studies Doctoral Scholarship.
1. Partch CL, Green CB, Takahashi JS (2014) Molecular architecture of the mammalian circadian clock. Trends Cell Biol 24:90–99. 2. Dibner C, Schibler U (2015) Circadian timing of metabolism in animal models and humans. J Intern Med 277:513–527. 3. Mermet J, Yeung J, Naef F (2017) Systems chronobiology: Global analysis of gene regulation in a 24-hour periodic world. Cold Spring Harb Perspect Biol 9:a028720. 4. Zhang R, Lahens NF, Ballance HI, Hughes ME, Hogenesch JB (2014) A circadian gene expression atlas in mammals: Implications for biology and medicine. Proc Natl Acad Sci USA 111:16219–16224. 5. Koike N, et al. (2012) Transcriptional architecture and chromatin landscape of the core circadian clock in mammals. Science 338:349–354. 6. Menet JS, Rodriguez J, Abruzzi KC, Rosbash M (2012) Nascent-seq reveals novel features of mouse circadian transcriptional regulation. Elife 1:e00011. 7. Le Martelot G, et al.; CycliX Consortium (2012) Genome-wide RNA polymerase II profiles and RNA accumulation reveal kinetics of transcription and associated epigenetic changes during diurnal cycles. PLoS Biol 10:e1001442. 8. Atger F, et al. (2015) Circadian and feeding rhythms differentially affect rhythmic mRNA transcription and translation in mouse liver. Proc Natl Acad Sci USA 112: E6579–E6588. 9. Lück S, Thurley K, Thaben PF, Westermark PO (2014) Rhythmic degradation explains and unifies circadian transcriptome and proteome data. Cell Rep 9:741–751. 10. Garneau NL, Wilusz J, Wilusz CJ (2007) The highways and byways of mRNA decay. Nat Rev Mol Cell Biol 8:113–126. 11. Kojima S, Gatfield D, Esau CC, Green CB (2010) MicroRNA-122 modulates the rhythmic expression profile of the circadian deadenylase Nocturnin in mouse liver. PLoS One 5: e11264. 12. Kojima S, et al. (2007) LARK activates posttranscriptional expression of an essential mammalian clock protein, PERIOD1. Proc Natl Acad Sci USA 104:1859–1864.
13. Woo K-CCK-C, et al. (2009) Mouse period 2 mRNA circadian oscillation is modulated by PTB-mediated rhythmic mRNA degradation. Nucleic Acids Res 37:26–37. 14. Kwak E, Kim T-D, Kim K-T (2006) Essential role of 3′-untranslated region-mediated mRNA decay in circadian oscillations of mouse Period3 mRNA. J Biol Chem 281: 19100–19106. 15. Kim D-Y, et al. (2011) hnRNP Q mediates a phase-dependent translation-coupled mRNA decay of mouse Period3. Nucleic Acids Res 39:8901–8914. 16. Kim SH, et al. (2015) Rhythmic control of mRNA stability modulates circadian amplitude of mouse Period3 mRNA. J Neurochem 132:642–656. 17. Woo K-CC, et al. (2010) Circadian amplitude of cryptochrome 1 is modulated by mRNA stability regulation via cytoplasmic hnRNP D oscillation. Mol Cell Biol 30: 197–205. 18. Gotic I, et al. (2016) Temperature regulates splicing efficiency of the cold-inducible RNA-binding protein gene Cirbp. Genes Dev 30:2005–2017. 19. Du N-H, Arpat AB, De Matos M, Gatfield D (2014) MicroRNAs shape circadian hepatic gene expression on a transcriptome-wide scale. Elife 3:e02510. 20. Yang E, et al. (2003) Decay rates of human mRNAs: Correlation with functional characteristics and sequence attributes. Genome Res 13:1863–1872. 21. Schwanhäusser B, et al. (2011) Global quantification of mammalian gene expression control. Nature 473:337–342. 22. Rabani M, et al. (2011) Metabolic labeling of RNA uncovers principles of RNA production and degradation dynamics in mammalian cells. Nat Biotechnol 29:436–442. 23. Eser P, et al. (2016) Determinants of RNA metabolism in the Schizosaccharomyces pombe genome. Mol Syst Biol 12:857. 24. de Pretis S, et al. (2015) INSPEcT: A computational tool to infer mRNA synthesis, processing and degradation dynamics from RNA- and 4sU-seq time course experiments. Bioinformatics 31:2829–2835. 25. Pelechano V, Pérez-Ortín JE (2008) The transcriptional inhibitor thiolutin blocks mRNA degradation in yeast. Yeast 25:85–92.
dmðtÞ=dt = kpðtÞ − γðtÞmðtÞ,
Wang et al.
PNAS PLUS
tion of mRNA degradation rate. In M1 and M2, γ(t) is set to a constant γ 0. The parameter k represents the rate of pre-mRNA processing (defined here as the effective rate for processing of pre-mRNA into mRNA, combining intermediate steps such as splicing, pre-mRNA decay, and nuclear export) from pre-mRNA to mRNA, which is assumed to be fast on the scale of γ(t) and can thus be approximated as a gene-specific constant. For each gene, temporal profiles of mRNA and pre-mRNA were fitted with the four models (M1–M4) and the kinetic parameters, as well as their SEs and identifiabilities, were estimated.
PNAS Latest Articles | 9 of 10
SYSTEMS BIOLOGY
degradation rate could also reflect a rhythmic shift in the average poly(A) tail length, coupled with length-depended mRNA lifetimes. In this study, we also investigated potential causes of rhythmic mRNA degradation. mRNA half-lives are determined by structural elements such as the length of their poly(A) tail and secondary structure influencing the accessibility and binding of specific mRBPs or miRNAs (10). While in mouse liver miRNAs have been previously shown to only marginally drive rhythmic accumulation, the potential role of rhythmic actives mRBPs has not been identified genome-wide. Moreover, the respective roles of the circadian clock or other rhythmic cues such as feeding/ fasting cycles were not known. Here, our analysis not only predicted several mRBPs underlying rhythms in mRNA degradation, but we could also distinguish between regulators with clock-dependent as well as clock-independent activities, showing approximately equal regulatory proportions. Temporal protein accumulation profiles for the predicted mRBPs supported some of the identified candidates and, interestingly, distinguished between stabilizing and destabilizing effects on mature mRNAs. We thus found that systemic signals as well as the local clock can drive rhythmic mRNA degradation. Future studies integrating posttranscriptional with transcriptional regulation to explain clockand system-driven mRNA abundances may reveal the coordination of DNA- and RNA-binding regulators that shape temporal transcriptomes in diverse mammalian tissues.
26. Burger K, et al. (2013) 4-thiouridine inhibits rRNA synthesis and causes a nucleolar stress response. RNA Biol 10:1623–1630. 27. Sidaway-Lee K, Costa MJ, Rand DA, Finkenstadt B, Penfield S (2014) Direct measurement of transcription rates reveals multiple mechanisms for configuration of the Arabidopsis ambient temperature response. Genome Biol 15:R45. 28. Bahar Halpern K, et al. (2015) Bursty gene expression in the intact mammalian liver. Mol Cell 58:147–156. 29. Zeisel A, et al. (2011) Coupled pre-mRNA and mRNA dynamics unveil operational strategies underlying transcriptional responses to stimuli. Mol Syst Biol 7:529. 30. Gaidatzis D, Burger L, Florescu M, Stadler MB (2015) Analysis of intronic and exonic reads in RNA-seq data characterizes transcriptional and post-transcriptional regulation. Nat Biotechnol 33:722–729, and erratum (2016) 34:210. 31. Brugiolo M, Herzel L, Neugebauer KM (2013) Counting on co-transcriptional splicing. F1000Prime Rep 5:9. 32. Singh J, Padgett RA (2009) Rates of in situ transcription and splicing in large human genes. Nat Struct Mol Biol 16:1128–1133. 33. Wahle E (1991) Purification and characterization of a mammalian polyadenylate polymerase involved in the 3′ end processing of messenger RNA precursors. J Biol Chem 266:3131–3139. 34. Martin RM, Rino J, Carvalho C, Kirchhausen T, Carmo-Fonseca M (2013) Live-cell visualization of pre-mRNA splicing with single-molecule sensitivity. Cell Rep 4: 1144–1155. 35. Wang J, et al. (2017) Nuclear proteomics uncovers diurnal regulatory landscapes in mouse liver. Cell Metab 25:102–117. 36. Rey G, et al. (2011) Genome-wide and phase-specific DNA-binding rhythms of BMAL1 control circadian output functions in mouse liver. PLoS Biol 9:e1000595. 37. Raue A, et al. (2009) Structural and practical identifiability analysis of partially observed dynamical models by exploiting the profile likelihood. Bioinformatics 25: 1923–1929. 38. Friedel CC, Dölken L, Ruzsics Z, Koszinowski UH, Zimmer R (2009) Conserved principles of mammalian transcriptional regulation revealed by RNA half-life. Nucleic Acids Res 37:e115. 39. Kojima S, Sher-Chen EL, Green CB (2012) Circadian control of mRNA polyadenylation dynamics regulates rhythmic protein expression. Genes Dev 26:2724–2736. 40. Suter DM, et al. (2011) Mammalian genes are transcribed with widely different bursting kinetics. Science 332:472–474. 41. Sharova LV, et al. (2009) Database for mRNA half-life of 19 977 genes obtained by DNA microarray analysis of pluripotent and differentiating mouse embryonic stem cells. DNA Res 16:45–58. 42. Alpert T, Herzel L, Neugebauer KM (2017) Perfect timing: Splicing and transcription rates in living cells. Wiley Interdiscip Rev RNA 8:1–3.
10 of 10 | www.pnas.org/cgi/doi/10.1073/pnas.1715225115
43. Yabe D, Komuro R, Liang G, Goldstein JL, Brown MS (2003) Liver-specific mRNA for Insig-2 down-regulated by insulin: Implications for fatty acid synthesis. Proc Natl Acad Sci USA 100:3155–3160. 44. Sun L-P, Seemann J, Goldstein JL, Brown MS (2007) Sterol-regulated transport of SREBPs from endoplasmic reticulum to Golgi: Insig renders sorting signal in Scap inaccessible to COPII proteins. Proc Natl Acad Sci USA 104:6519–6526. 45. Matsuo T, et al. (2003) Control mechanism of the circadian clock for timing of cell division in vivo. Science 302:255–259. 46. Adamovich Y, et al. (2014) Circadian clocks and feeding time regulate the oscillations and levels of hepatic triglycerides. Cell Metab 19:319–330. 47. Ray D, et al. (2013) A compendium of RNA-binding motifs for decoding gene regulation. Nature 499:172–177. 48. Balwierz PJ, et al. (2014) ISMARA: Automated modeling of genomic signals as a democracy of regulatory motifs. Genome Res 24:869–884. 49. Sobel JA, et al. (2017) Transcriptional regulatory logic of the diurnal cycle in the mouse liver. PLoS Biol 15:e2001069. 50. Mauvoisin D, et al. (2014) Circadian clock-dependent and -independent rhythmic proteomes implement distinct diurnal functions in mouse liver. Proc Natl Acad Sci USA 111:167–172. 51. Salton M, et al. (2011) Matrin 3 binds and stabilizes mRNA. PLoS One 6:e23882. 52. Qian J, et al. (2015) The RNA binding protein FXR1 is a new driver in the 3q2629 amplicon and predicts poor prognosis in human cancers. Proc Natl Acad Sci USA 112:3469–3474. 53. Abdelmohsen K, Gorospe M (2012) RNA-binding protein nucleolin in disease. RNA Biol 9:799–808. 54. Weidensdorfer D, et al. (2009) Control of c-myc mRNA stability by IGF2BP1-associated cytoplasmic RNPs. RNA 15:104–115. 55. Love MI, Huber W, Anders S (2014) Moderated estimation of fold change and dispersion for RNA-seq data with DESeq2. Genome Biol 15:550. 56. Robinson MD, McCarthy DJ, Smyth GK (2010) edgeR: A Bioconductor package for differential expression analysis of digital gene expression data. Bioinformatics 26: 139–140. 57. Hodge VJ, Austin J (2004) A survey of outlier detection methodoligies. Artif Intell Rev 22:85–126. 58. Grant CE, Bailey TL, Noble WS (2011) FIMO: Scanning for occurrences of a given motif. Bioinformatics 27:1017–1018. 59. Friedman J, Hastie T, Tibshirani R (2010) Regularization paths for generalized linear models via coordinate descent. J Stat Softw 33:1–22. 60. Alexa A, Rahnenfuhrer J, Lengauer T (2006) Improved scoring of functional groups from gene expression data by decorrelating GO graph structure. Bioinformatics 22: 1600–1607.
Wang et al.