Mar 2, 2015 - SF6. Circuit Breakers. Key words: density monitoring, high-voltage circuit breaker, SF6 ... type being sulfur hexafluoride (SF6) circuit breakers [3]. Figure ..... gov/electricpower-sf6/documents/conf06_bessede.pdf. [3] J. Biasse ...
F
E
A
T
U
R
E
A
R
T
I
C
L
E
Density Monitoring of High-Voltage SF6 Circuit Breakers Key words: density monitoring, high-voltage circuit breaker, SF6
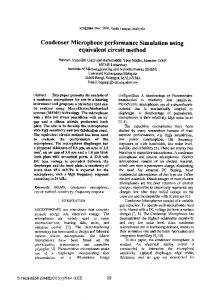
Introduction Circuit breakers play a vital role in ensuring the stability and reliability of a power system [1]. When a circuit breaker operates, the contacts inside the circuit breaker open and the electrical arc is extinguished resulting in the electrical circuit being interrupted [2]. Circuit breakers are named by the medium that is used to extinguish the electrical arc, with the most common type being sulfur hexafluoride (SF6) circuit breakers [3]. Figure 1 shows a typical design of a 132-kV live tank and dead tank circuit breaker. Sulfur hexafluoride is one of the heaviest known gases with a molecular weight of 146.06 g/mol and a density of 6.07 g/L (20°C, 1 bar) [4]. The dielectric strength of SF6 is approximately 3 times greater than air, and it has a volumetric specific heat capacity 3.7 times greater than air [3], [5]. Currently, there are no other mediums that have the same insulating and arc-extinguishing properties as SF6 [6]. Sulfur hexafluoride is a potent greenhouse gas with a global warming potential of 23,900 when compared with CO2 [3]. It is estimated that SF6 used in the electrical industry only accounts for 0.1% of the total amount of manmade global warming [2]. The IEC standards and voluntary agreements attempt to reduce the amount of SF6 gas released into the atmosphere by the electrical industry. The IEC standard 62271-203 states that the maximum allowed SF6 leak rate shall not exceed 0.5% per year for closed pressure systems [6]. An SF6 circuit breaker can have an operational lifetime of more than 40 years and is susceptible to defects during this time. A report conducted by CIGRE determined that SF6 leaks accounted for 40% of all minor failures [1]. Possible causes of SF6 leaks include hardening of gaskets, chemical attack, corrosion, and deterioration of O-rings [2].
Investigate the Frequency of SF6 Leaks During the Lifetime of a Circuit Breaker The CIGRE document [1] is a widely referenced document for SF6 leak rate data. The average age of circuit breakers in this enquiry was less than six years; however, a circuit breaker can be in service for up to 40 years. A review on SF6 leaks
6
Peter Cheetham and Ali Hellany University of Western Sydney, School of Computing, Engineering and Mathematics Steven Jones TransGrid, 200 Old Wallgrove Road, Eastern Creek, 2766, New South Wales, Australia This article analyses different aspects of density monitoring that need to be considered to successfully retrofit a high-voltage SF6 circuit breaker with density-monitoring equipment. was conducted by the authors on more than 1,000 SF6 circuit breakers installed in TransGrid's network. TransGrid is the owner, operator, and manager of the HV electricity transmission network in New South Wales, Australia. The aim of this review was to compare the SF6 leak rate data of TransGrid with what was published in the CIGRE report. The configuration of TransGrid's network meant that a comparison could only be performed in the 63 ≤ kV < 100, 100 ≤ kV < 200, and 300 ≤ kV < 500 voltage ranges. The CIGRE data refer to SF6 leaks for circuit breakers installed between January 1, 1983, and January 1, 1992, while the TransGrid data refer to SF6 leaks for circuit breakers installed between January 1, 2004, and January 1, 2013. Although there is a 20-year difference between when these circuit breakers were installed, the frequency of leak rates during the first nine years of installation is approximately equal as shown in Figure 2 [7].
0883-7554/15/©2015/IEEE
IEEE Electrical Insulation Magazine
Figure 1. (A) A 132-kV live tank circuit breaker. (B) A 132-kV dead tank circuit breaker. Further analysis was performed on TransGrid circuit breakers, installed between 1970 and 2013, to determine the frequency of SF6 leaks as a circuit breaker ages. To show the relationship between age and SF6 leaks, the TransGrid data were filtered by the age of the circuit breaker when the SF6 leak occurred. By filtering the data in this manner, the year that the circuit breaker was installed was not taken into consideration. If the TransGrid data were expressed by installation date, it would give false trends as there have been time periods where no circuit breakers were installed in the network. From this analysis, it could be seen that as a circuit breaker increases in age, the frequency of SF6 leaks increases, which can be seen in Figure 3. Figure 3 shows a dramatic increase in SF6 leaks for all voltage ranges after a circuit breaker has been installed for over 10 years. As mentioned earlier two causes of SF6 leaks are O-ring deterioration and gasket hardening, both of which deteriorate when a circuit breaker is exposed to ambient conditions over numerous years. From Figure 2 and Figure 3 it can be seen that the data published in the CIGRE enquiry accurately represent SF6 leak rates for the first nine years of installation. However,
this narrow snapshot of the lifetime of a circuit breaker does not give the full extent and severity of SF6 leaks as a circuit breaker ages. The results of Figure 3 highlight the need for retrofitting existing circuit breakers with density-monitoring equipment to allow for the early detection of SF6 leaks. Circuit breakers with a known history of leaks or belonging to a model of circuit breakers with known leaks should be considered to be retrofitted with density-monitoring equipment. Therefore, effective SF6 monitoring is important for circuit breaker condition assessment and minimizing the loss of SF6 to the atmosphere.
Figure 2. Sulfur hexafluoride leak rates during the first nine years of installation.
Figure 3. Sulfur hexafluoride leak rates over the lifetime of a circuit breaker.
March/April — Vol. 31, No. 2
Determining an Optimal Sampling Rate Data from 12 density transducers installed on 12 separate 132-kV dead tank circuit breakers at a TransGrid substation were analysed to determine the optimal sampling rate. These density transducers derived the density level within the circuit breaker by measuring the pressure and internal SF6 gas temperature. Originally, the density transducers were set with a density based sampling rate, and a measurement was recorded whenever there was a 0.3 g/L change in density within the circuit breaker.
7
Figure 5. Sulfur hexafluoride leak rate experiment results.
Figure 4. Sulfur hexafluoride leak rate experiment setup. A density-based sampling rate was determined to be inefficient as the majority of measurements were fluctuations caused from ambient conditions. Also, as there was no set time interval it was difficult to compare the density measurements between circuit breakers and analyze data at specific times of the day. It was, therefore, decided to change the sampling rate from density based to time based to allow for greater versatility when trying to detect an SF6 leak. When deciding on a sampling rate for the time-based density measurements it was determined that it should allow for an accurate representation of the density level while reducing the number of measurements taken per day. Minimizing the number of measurements taken reduces the amount of data that needs to be stored and analyzed. To determine the ideal time-based sampling rate the transducers were set to record density measurements every minute for a three-week period. These data were then filtered into intervals of 5, 10, 15, 20, 30, 60, and 120 minutes and compared to the 1-minute measurements. This comparison allowed the difference between the different sampling rates and the 1-minute density signal to be examined. From the data, it was concluded that a 30-minute sampling rate allowed for an accurate representation of the density signal while reducing the number of measurements taken. Therefore, all transducers were set with a 30-minute sampling rate.
Determining What Transducers Can Be Retrofitted to a Circuit Breaker for SF6 Leak Rate Monitoring
The majority of SF6 density-monitoring systems currently available are fitted to a circuit breaker when it is purchased. There are two types of SF6 density transducers that are currently commercially available that can be retrofitted to a circuit breaker for SF6 density monitoring. The first type of density transducer
8
measures the pressure and internal SF6 gas temperature to derive density [8]. The gas temperature is typically recorded where the sensor is installed, which can affect the accuracy of the measurement due to heat flux [9]. The second type of transducer available uses the quartz oscillating principle to directly measure density [8]. The quartz oscillating principle compares the relationship between dynamic viscosity and density of a specific gas at a specific temperature [9]. Individual pressure and temperature sensors can also be purchased to measure for SF6 leaks, but the measurements must be entered into an equation to be expressed as a density value. For this system to work correctly the temperature sensor needs to provide an accurate representation of the ambient conditions. Therefore, mounting the temperature sensor in the right position is crucial if this setup is used. Currently, the Beattie-Bridgeman equation of state is the most-used equation to determine SF6 gas levels. The equation is used because it provides a relationship between temperature (T), pressure (p), and volume (V), which can be seen in (1) [10].
p(V ,T ) =
nc nRT n 2A 1 − ( V + nB ) − , V 2 VT 3 V2
(1)
where B = E − F/V, A = C − D/V, and R = 569.5020 × 10⁻⁶ bar m3/(kg∙K), C = 738.2200 × 10⁻⁶ bar m6/kg2, D = 513.2105 × 10⁻⁹ bar m9/kg3, E = 2.5070 × 10⁻³ m3/kg, F = 2.1224 × 10⁻⁶ m6/kg2, and c = 0. The Beattie-Bridgeman equation can be manipulated to provide a relationship between temperature (T), absolute pressure (p), and density (ρ), which can be seen in (2),
ρ3(RTF − D) + ρ2(C − RTE) − ρRT + p = 0.
(2)
An experiment was conducted to replicate an SF6 gas leak by transferring SF6 gas from one gas bottle to another. The aim of this experiment was to determine whether there was any difference between how each type of transducer trends an SF6 gas leak. The controlled leak was monitored by a quartz oscillating density transducer, pressure and temperature calculated density IEEE Electrical Insulation Magazine
Figure 6. The condition-monitoring network of TransGrid. transducer, a pressure transducer, and two temperature sensors. The transfer of SF6 gas between the bottles was controlled with a needle valve to reduce the SF6 leak rate to as minimal as feasibly possible. The experiment was conducted indoors in a non-climate-controlled environment where there was no direct sunlight affecting the transducer measurements; although, the ambient temperature varied between 17 and 29°C during the experiment. The experiment ran for approximately two weeks until equilibrium conditions between the gas bottles were reached; the experiment setup is shown in Figure 4. The results of this experiment can be seen in Figure 5, with the pressure and temperature sensor measurements being entered into the Beattie-Bridgeman equation. From Figure 5, it can be seen that there is a small difference in the measurements from each transducer; however, the same
March/April — Vol. 31, No. 2
trends can be seen. Therefore, any errors within the transducers can be seen as a once-off error which can easily be accounted for when trending an SF6 leak. The results of this experiment show that there is no significant difference between the types of transducers that can be retrofitted to a circuit breaker for SF6 density monitoring.
Condition-Monitoring Network of TransGrid An important aspect of density monitoring of HV SF6 circuit breakers is how the data from the density transducers are stored to enable analysis for SF6 leaks. The condition-monitoring network of TransGrid consists of multiple servers to allow users to remotely access condition-monitoring data. The basic framework of the condition-monitoring network of TransGrid can be seen in Figure 6. 9
Figure 7. Density measurements recorded at sunrise by transducers installed in different orientations toward the sun. From Figure 6, it can be seen that the condition-monitoring network of TransGrid allows for condition-monitoring data from various substations across New South Wales to be stored in one convenient location. A backup server ensures a level of redundancy in case the main condition-monitoring server fails. The demilitarized zone and associated firewalls separate the corporate data network from the main condition-monitoring server to limit and control access to high-risk condition-monitoring equipment installed within the substations. The object-based database used by TransGrid allows for new density transducers as well as other condition-monitoring equipment to be easily connected by using standard templates. The database is compatible with a variety of communication protocols including DNP3 and Modbus. By being able to accommodate different communication protocols, it does not limit which type of condition-monitoring equipment can be installed.
too many variables that would need to be included in order to get an accurate calculation. These variables include the orientation of the density transducer with respect to the sun, ambient conditions, and knowing the exact volume of the SF6 gas vessel and
Analyzing the Density Measurements The density data from the 12 dead tank 132-kV circuit breakers were analysed to determine whether any SF6 leaks were present. At first it was decided to try a formula-based leak-rate calculation, but from an early stage it was determined that there were 10
Figure 8. Percentage of density measurements at different time periods. IEEE Electrical Insulation Magazine
Figure 9. Total density measurements.
Figure 10. Density measurements from 10 pm to 4 am.
the exact weight of SF6 gas inside the circuit breaker at the start of the monitoring period. While the transducers were configured with a density-based sampling rate, it was clear how the orientation of the transducer toward the sun causes fluctuations in the density measurement. As the sun rises from east to west, transducers installed facing east experienced density fluctuations in the early morning as the sun rose, which can be seen in Figure 7, whereas transducers installed facing west experienced density fluctuations in the afternoon. This relationship can be seen in Figure 8, which shows the percentage of density measurements at different time periods of the day. A graphical approach was used to analyze the density measurements for an SF6 leak rate as it allowed for greater versatility when density-monitoring equipment was retrofitted to different types and models of circuit breakers. Initial analysis of the data showed that density fluctuations would be a major issue to overcome when developing an SF6 leak rate algorithm. A stable circuit breaker can fluctuate in density measurements by approximately 5 g/L over a 12-month period. This is a significant
amount as a circuit breaker only needs to lose approximately 6 to 7.5 g/L of SF6 to go from nominal operating density to a low-level density alarm. The operating density and the low-level density alarm were calculated using (2) and the pressure and temperature nameplate ratings of the circuit breaker. Analysis was performed on all of the data recorded by the 12 density transducers, with the density measurements of one of the circuit breakers shown in Figure 9. As discussed earlier the major problem in detecting an SF6 leak is the density fluctuations, which are evident in Figure 9. Filtering the density measurements at certain times of the day was used to reduce density fluctuations. It was noted that between 10 pm and 4 am there are no fluctuations caused by sunlight, and any residual heat within the circuit breaker from the sun has dissipated. Note that this time period may need to be adjusted depending on the sunrise and sunset times of where the circuit breakers are installed. The circuit breaker shown in Figure 9 has a small SF6 leak, which is hard to detect from the total density measurements. When the density measurements were filtered, the slight leak
Figure 11. (A) A 4-20-mA data logger connected to density transducer outputs; (B) 132-kV live tank SF6 circuit breaker fitted with density transducers; (C) density transducer installed to spare fill valve of white phase of the circuit breaker; and (D) self-sealing spare fill valve of the circuit breaker. March/April — Vol. 31, No. 2
11
Figure 12. Total density measurements. could be easily detected, as can be seen in Figure 10. By using this filtering method, 2 of the 12 circuit breakers fitted with density-monitoring equipment were identified as having an SF6 leak. The SF6 leaks would have been almost impossible to detect before the density measurements were filtered. Early linear regression trending of the SF6 data of the circuit breaker in Figure 10 suggests that a low-density-level alarm is not likely for over 1,000 days. A possible explanation for this slow leak rate is dead tank circuit breakers only have one gas compartment for all three phases compared with a live tank circuit breaker, which has an individual gas compartment for each phase. A low-pressure alarm should occur sooner for a live tank circuit breaker than a dead tank circuit breaker if the same amount of SF6 gas is being released. The larger the gas compartment, the smaller the leak-rate percentage will be, as can be seen in (3).
Leak Rate % = Alarm Pressure 1 − (3) Operating Pressure × 365, Mass of Gas × Days
Figure 13. Density measurements from 10 pm to 4 am. 12
where Mass of Gas is in kilograms, Alarm Pressure and Operating Pressure are in megapascals, and Days is the number of days between Operating Pressure and Alarm Pressure. In order to determine a way to predict when an SF6 leak rate will cause a low-pressure alarm, data from the circuit breaker with a severe SF6 leak needed to be obtained. Therefore, density-monitoring equipment was installed on each phase of a 132-kV live tank circuit breaker with a known history of leaks on white phase. The density transducers were installed on the spare fill valve of each phase of the circuit breaker. The circuit breaker was installed within a substation that was in the process of installing a new control room, and it was not feasible to lay a new cable to the existing control room to connect the density transducers to the condition-monitoring network of TransGrid. Therefore, a 4-20-mA data logger was installed within the circuit breaker control box to capture the measurements from the density transducers in the interim as the control room was being upgraded. Figure 11 shows the different components of the density-monitoring setup for the 132-kV live tank circuit breaker. The total density measurements on white and blue phase of the live tank circuit breaker can be seen below in Figure 12. There are two periods where no data were recorded due to an error involved with the data logger. From Figure 12, it can be clearly seen that there is a leak on white phase; however, density fluctuations from ambient conditions are still present. The standard deviation of the total density measurements of the line of best fit was calculated at approximately 0.31 g/L. The density measurements were then filtered between 10 pm and 4 am to remove the density fluctuations. The resulting measurements can be seen in Figure 13. From Figure 12 and Figure 13 it can be seen that white phase was slowly approaching a low-pressure alarm. Using (2) and the nameplate information of the circuit breaker it was calculated that a low-pressure alarm should occur when the density level is 40.65 g/L. Linear regression trending of the 10 pm to 4 am density measurements was performed to predict when the density level would reach 40.65 g/L and a low-pressure alarm would occur. The line of best fit from the 10 pm to 4 am density measurements was subtracted by 0.31 g/L (the standard deviation of the total density measurements) to account for any errors within the transducer. Therefore, a low-pressure alarm should occur between these two trend lines. Determining a time window for when the low-pressure alarm will occur allows for a small margin of error to ensure that a low-pressure alarm does not occur unexpectedly as SF6 leaks are unpredictable in nature. An SF6 top-up was performed on this circuit breaker before the predicted low-pressure alarm window. The analysis of the density measurements of this circuit breaker allowed for the SF6 top-up to be planned one month prior to working commencing. Therfore, no staff members had to be reassigned to refill the circuit breaker from an unexpected low-pressure alarm and the job was completed as part of the regular maintenance schedule. From Figure 12 it can be seen that some of the recorded total density measurements had fallen below the low-pressure alarm of 40.65 g/L and yet a low-pressure alarm had not occurred,
IEEE Electrical Insulation Magazine
which shows why density fluctuations from ambient conditions need to be filtered.
Conclusion From reviewing SF6 leak rate data, it was determined that the probability of an SF6 leak occurring increased as a circuit breaker aged. Therefore, density monitoring was retrofitted to existing circuit breakers to monitor for SF6 leaks. A sampling rate of 30 minutes allowed for accurate representation of the SF6 density level within the circuit breaker while reducing the number of measurements recorded. A condition-monitoring network needs to be able to provide the user with real-time information of the circuit breakers condition, as well as be able to cope with the installations of new condition-monitoring equipment. By filtering the density measurements between 10 pm and 4 am it eliminated fluctuations caused by ambient conditions. The filtering process allowed for the early detection of SF6 leaks that would have been almost impossible to detect from looking at the total density measurement.
Acknowledgment The authors would like to thank everyone at TransGrid and the University of Western Sydney who helped in the completion of this research.
References
[1] CIGRE, Final Report of the Second International Enquiry on High Voltage Circuit-Breaker Failures and Defects in Service. CIGRE, 1994. [2] J. L. Bessede, A. Buescher, R. Marshall, G. F. Montillet, and A. Stelter, Limiting SF6 Gas Emissions by Optimization of Design and Handling over the Life Cycle of HV Switchgear, 2006. Available: http://www.epa. gov/electricpower-sf6/documents/conf06_bessede.pdf. [3] J. Biasse, E. Otegui, and B. Tilwitz-von Keiser, “Benefits of proper SF6 handling to reduce SF6 emissions for sustainable Electricity Transmission and Distribution,” in 2010 China International Conference on Electricity Distribution (CICED), 2010, pp. 1–6. [4] D. Lauzon and H. Koch, “Sulfur Hexafluoride SF6,” in IEEE Power Engineering Society General Meeting, 2007, pp. 1–3. [5] D. Koch, SF6 properties, and use in MV and HV switchgear, 2003. Available: http://www2.schneider-electric.com/documents/technical-publications/en/shared/electrical-engineering/breaking-techniques-switchgear/ general-knowledge/ect188.pdf. [6] M. Kamei and O. Takai, “Influence of sensor information accuracy on condition-based maintenance strategy for GIS/GCB maintenance,” IEEE Trans. Power Del., vol. 26, pp. 625–631, 2011. [7] P. Cheetham and A. Hellany, “Density monitoring of high voltage SF6 circuit breakers,” in Electrical Insulation Conference (EIC), 2014, pp. 92–96. [8] M. Flubacher and M. Wagner, “Determination of life cycle cost savings due to online monitoring of circuit breakers,” Zurich, 2004. [9] L. Graber, “Improving the accuracy of SF6 leakage detection for high voltage switchgear,” IEEE Trans. Dielectr. Electr. Insul., vol. 18, pp. 1835–1846, 2011. [10] D. Zeisel, H. Menzi, and L. Ullrich, “A precise and robust quartz sensor based on tuning fork technology for (SF6)-gas density control,” Sensors Actuators A: Physical, vol. 80, pp. 233–236, 2000.
March/April — Vol. 31, No. 2
Peter Cheetham has completed a bachelor’s degree of electrical engineering (Hons) at the University of Western Sydney. He completed various placements with TransGrid while completing his degree including research on high voltage SF6 circuit breakers. He is currently studying for a master’s degree in electrical engineering at Florida State University and undertaking research on high-temperature superconductive (HTS) cables at the Centre of Advanced Power Systems. Ali Hellany has completed MEng (Hons) and PhD degrees from the University of Western Sydney (UWS). He also holds a master’s in telecommunication engineering from Odessa Telecommunication Institute, Ukraine. Presently, he is working as senior lecturer in the School of Computing, Engineering and Mathematics at UWS. Hellany has published numerous refereed research papers in national and international conference proceedings and journals. Hellany has research and teaching interests in areas of power conversion, electrical drives, EMC/EMI, and power-quality issues. He has been very active in the activities of various professional bodies such as IEEE (USA) and IEEE student branch. Steven Jones studied electrical engineering at the University of Technology Sydney. He then gained a research master’s from the University of New South Wales in insulation breakdown. He also has an MBA from Deakin University. He is currently manager projects at TransGrid responsible for all power transmission augmentation and replacement projects including substations, transmission lines, cables, and telecommunications. He is a past member of the CIGRÉ international Study Committee for High Voltage Equipment and is currently the Australian Technical Committee chairman of CIGRÉ.
13