during flexion and exte nsion positions of the elbow. The. MVAR coefficients are then used to define the Directed. Transfer Function (DTF), which estimates the ...
2008 International Conference on BioMedical Engineering and Informatics
CLASSIFICATION OF ELBOW ELECTROMYOGRAPHY SIGNALS BASED ON DIRECTED TRANSFER FUNCTIONS Rhonira Latif, Saeid Sanei, and Kianoush Nazarpour Centre of Digital Signal Processing, School of Engineering, Cardiff University, Wales, UK
Abstract—A new approach for classification of electromyography (EMG) of the flexion and extension signals is introduced here. Multivariate Autoregressive (MVAR) model has been applied to a two-channel set of EMG signals from the biceps and triceps muscles during flexion and exte nsion positions of the elbow. The MVAR coefficients are then used to define the Directed Transfer Function (DTF), which estimates the strength of the direction of the signals flow between the channels. The maximum strength of the DTF was used as the frequency domain features (training data) for EMG classification via support vector machine (SVM) algorithm. As the features obtained from the experiment uniquely describe the flexion and extension, the classifier becomes linear which lead to low level of misclassification. The overall method described here has a potential to detect and classify the type and level of muscular disorder from the way the muscle signals interact with each other.
I. INTRODUCTION
A. The MVAR Model and DTF For a k-channels EMG system, a vector of k-signal time series is x(t)=[x 1 (t), x 2 (t),……, x k (t)]T, where [.]T is the transpose operation. The MVAR model for these digitised signals is expressed as :
p x (t) = − ∑ A (i) x (t − i) + n (t) i =1
(1)
This represents a model of order p and n(t) = [n1 (t), n2 (t), …., n k (t)]T is a vector of a multivariate uncorrelated white noise process, with covariance matrix C ∈ R k × k while A(i) are the k ×k matrices of the model parameters. These parameters can be estimated by solving a multivariate version of the Yule-Walker equations [3].
Taking the z-transform of equation (1) and further manipulation gives
Electromyography (EMG) is used to record the physiological properties of muscles at rest (inactive) or during contraction (active). There are various techniques for EMG signal processing. The scheme explored here involves fitting the EMG signals to a Multivariate Autoregressive (MVAR) model [1][2]. An accurate model should be formed carefully before estimating the spectrum by accurately estimating the model parameters. This parametric method can result in a high-resolution frequency domain data [3]. The transfer function matrix of the modelled signal can then be used to compute the DTF. Kaminski et al. introduced DTF to measure the directionality of electroencephalogram (EEG) signals from each electrode to its neighbouring electrodes [4]. On the other hand SVM has been a very successful classification method based on risk minimisation [5]. In this paper, we propose that the DTF values of the EMG signals can be used as the features to classify the position of the elbow, which is either flexion or extension. SVM [5] is then used to classify these features. We have demonstrated the results of this technique for the real EMG data of flexion and extension. The novelty of the method arises from the fact that the dynamics of movement have been taken into account.
978-0-7695-3118-2/08 $25.00 © 2008 IEEE DOI 10.1109/BMEI.2008.135
II. ALGORITHM DEVELOPMENT
1295 371
X(z) = H(z) = N(z)
1 p 1 + ∑ A(i)z−i i =1
(2)
Or equivalently by replacing z = e j?T a frequency domain representation of the model, where ? is the angular frequency and T is the sampling period, is: H( f ) =
1 p − ji ω T 1 + ∑ A ( i )e i =1
(3)
H(f) is a k ×k transfer function matrix. As all of the information about the interrelation between the channels are contained in H(f), we can define DTF which is also a k ×k matrix as follows [4]. 2 2 DTF ij ( f ) =
H ij ( f ) k 2 ∑ H ( f ) m = 1 im
(4)
DTFij2 ( f ) are the elements of the matrix that describes the th
th
connection or transmission between the j channel to i channel of the system. Depending on the transmission magnitude, DTF values range from 0 to 1, as we can analyse from equation (4) that DTF is taken as the ratio between the inflow from channel j to channel i to all of the inflows of activity from other channels to the destination channel i. DTF value close to 1 indicates that most of the signal in channel i consists of the signal from channel j; value of DTF close to 0 indicates that there was no flow from channel j to channel i at the corresponding frequency [4]. Kaminski et al. also stated that if the MVAR model describes the investigated time series with high accuracy, then the value of DTF should be a good estimator of the directions and magnitudes of the signal flows [4]. We demonstrated the performance of the DTF-based approach for both simulated and experimental EMG signals.
the triceps is in a relax state. On the other hand, when this particular subject is trying to extend his arm, the EMG activity in his triceps is comparable to the biceps’. A. The MVAR Model ARfit is a collection of Matlab modules by Arnold Neumaier and Tapio Schneider for modelling multivariate time series with MVAR model [1][2]. ARfit is used to estimate the order, p and the parameters, A(i) of the MVAR model. The optimum order is chosen as the minimiser of the order selection criterion; either Akaike’s Final Prediction Error (FPE) criterion or Schwarz’s Bayesian Criterion (SBC). Lütkepohl found that SBC chooses the correct model order most often [7].
B. Classification of the Data Applying the amplitude values of the flow of the muscles’ signals (represented by the maximum DTF) as the frequency domain features to the classifier, one can classify the two primitive motions of the elbow. SVM is then applied for classification of these features. In an SVM classifier an optimal hyperplane is found in order to correctly classify the features into two distinct classes (flexion or extension) with the widest margin [5]. Then, this classifier can be used to identify the correct group for the new input features.
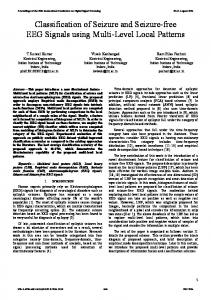
(a) During elbow flexion
III. IMPLEMENTATION OF THE DTF-SVM In this project, the EMG dataset of Englehart et al. have been used [6]. The EMG signals were taken from a subject when he performed two arm movements, i.e. elbow flexion and elbow extension. The electrodes (channels) were placed over the biceps and triceps muscles during each motion. According to Hudgins et al. in [6], this arrangement should provide the maximum pickup region for the acquisition of the EMG signals from all muscles in the upper arm. The 2 channels were recorded simultaneously during arbitrary muscular forces of flexion and extension. A differential amplifier with a signal gain of 5000 was used to amplify the EMG signals. The amplified signals were sampled at 1000Hz and segmented into 256 ms time windows resulting 100 segments for each motion. Refer [6] for details of the experimental protocol. Figure 1 shows one segment of the EMG signals recorded from the biceps (upper myogram) and triceps (lower myogram) during flexion and extension. During flexion, it is obvious that the EMG activity in biceps is more than that of the triceps muscle. So, we can conclude that in this cas e the biceps muscle is in contraction while
1296 372
(b) During elbow extensio n Fig. 1. One segment of the EMG signals from biceps (upper) and triceps (lower) for (a) flexion and (b) extension. In the simulation results, the optimum estimated model order for flexion was 6 while for extension the model order was estimated as 5. Since we considered two channels (biceps and triceps), the estimated parameters A(i) for the MVAR models were in 2×2 matrices. An important consideration in estimating the time series to become an MVAR model is the choice of the order. If the order is too small, the model may not capture the essential dynamics of the signal while too large order may result in over-fitting and instability as the model also captures undesired
components (noise) [3]. The simulation results indicate that different data segments may require different model orders. B. DTF 1) Simulated Signal In order to understand DTF, the patterns of flows were constructed for this simulation. In Figure 2, the signal in Channel 2 is 0.75 times the delayed signal from Channel 1, r(t), by one sample. Channel 3, s(t), is independent from r(t). Their sampling frequency is 200Hz.
2) Real biceps and triceps EMG Signals from elbow Now the described method is applied to the physiological signals. Channel 1 records the biceps while Channel 2 corresponds to EMG signal from triceps. The DTF graphs in Figure 4 show that there is approximately no flow of DTF (1? 2) and DTF (2? 1) as the two EMG signals from the two muscles might be independent from each other during flexion.
1>1
1 0.8
0.8
0.6
0.6
0.4
0.4
0.2
0.2
0
50
100
150
200
1>2
1
0.8
0.6
0.6
0.4
0.4
The DTF graphs for the simulated 3-channels signals are shown in Figure 3. We can observe that there is a considerable value of DTF (1? 2). All other DTF values are approximately equal to zero. It is interesting that DTF (2? 1) is zero since the signal from Channel 1 is transmitted to Channel 2 and not the other way round. Thus, there should be no flow from Channel 2 to 1. Also, there is no flow of signals from Channel 2 and 3 to 1. Most of the signals in Channel 1 are returned from itself.
0.5
0
1
1
0.5
10 20 30 40 50
1>2
0
1
0.5
0.5
0
0
1
10 20 30 40 50
1>3
0.5 0
2>1
1
0
3>1
0.5
10 20 30 40 50
2>2
0
1
10 20 30 40 50
3>2
0.5
10 20 30 40 50
2>3
0.5
10 20 30 40 50
1
0
1
10 20 30 40 50
3>3
0.5
10 20 30 40 50
0
100
150
200
150
200
2>2
0.2 50
100
150
200
0
50
100
Fig. 4. DTF graphs during flexion; 1.biceps and 2.triceps.
Fig. 2. Channel 1 is r(t), Channel 2 is 0.75r(t-1), and Channel 3 is s(t).
1>1
50
1
0.2
1
0
0.8
0
2>1
1
10 20 30 40 50
Fig. 3. DTF graphs as function of frequency. i > j means transmission from Channel i to Channel j or DTF (i? j).
1297 373
The EMG activities for extension are shown in Figure 5, where the results indicate the following activity flow; DTF (1? 2) and DTF (2? 1). Both signals might have interfered with each other during this particular subject’s elbow extension position. C. The Classification The maximum values of DTF (1? 2) and DTF (2? 1) to 4 decimal places are the two features extracted from the EMG signal segments which are linearly separable. 20 segments (10 during flexion and 10 during extension) of these EMG signals were randomly selected for training (to design the classifier) and the remaining segments were used to test the classifier. The SVM Matlab codes provided by Gunn [8] were used. Figure 6 shows the classification results of the dataset according to the extracted features. The group with ‘o’ corresponds to the extension motion while ‘? ’ indicates the flexion motion group. The groups are separated by a straight line, known as linear hyperplane, and the dotted lines are the margins. Table I shows the 5 random segments used to test this machine. The classification outputs were given in the predicted targets where +1 corresponds to flexion motion and -1 indicates the extension motion. The machine classified the inputs correctly with zero error.
1>1
1 0.8
0.8
0.6
0.6
0.4
0.4
0.2 0
0.2 50
100
150
200
1>2
1
0
0.8
0.6
0.6
0.4
0.4
0.2
0.2 50
100
50
150
200
0
100
150
200
150
200
2>2
1
0.8
0
IV. CONCLUSIONS
2>1
1
50
100
Fig. 5. DTF graphs during extension; 1.biceps and 2.triceps.
We have demonstrated that the DTF values obtained from the modelled EMG signals can be used to classify the elbow flexion and extension. The physiological properties of the biceps and triceps muscles during flexion and extension determine the characteristics of the generated EMG signals. The shape and the variation of the EMG signals show the state or condition of the muscles during a particular motion. The physiological aspect of the muscles for a healthy subject is important as this can become a reference to conclude on the muscle’s characteristics of other subjects. The DTF features can then be classified using SVM into groups of healthy and unhealthy classes. The classification that has been demonstrated before is limited for two dimensional features. A multichannel setup enables more accurate estimation of the dynamics of the movement.
V. REFERENCES
Fig. 6. Optimal separating hyperplane for classification of the extension, denoted by ‘o’, and flexion, denoted by ‘? ’.
TABLE I. THE DATA TESTED FOR CLASSIFICATION Test Motion DTF(2→ 1) DTF(1→ 2) 1 Extension 0.0242 0.0920 2 Flexion 0.0313 0.0008 3 Extension 0.0446 0.0508 4 Flexion 0.0524 0.0003 5 Extension 0.5729 0.3549
The classification process is simple since the features are separable. The features (DTF) for flexion and extension are exceptionally distinctive. Thus, the dataset can be separated by a linear hyperplane with a low classification error. In the case of non-separable dataset, a suitable kernel may be adopted to the non-linear separation system.
[1] A. Neumaier and T. Schneider, “Estimation of parameters and eigenmodes of multivariate autoregressive models,” ACM Transactions on Mathematical Software, vol. 27, pp. 27-57, 2001. [2] T. Schneider and A. Neumaier, “Algorithm 808: ARfita Matlab package for the estimation of parameters and eigenmodes of multivariate autoregressive models,” ACM Transactions on Mathematical Software, vol. 27, pp. 58-65, 2001. [3] Emmanual C. Ifeachor and Barrie W. Jervis, “Digital signal processing: a practical approach,” England: Pearson Education, 2nd Edition, pp. 682-721, 2002. [4] M. J Kaminski and K. J Blinowska , “A new method of the description of the information flow in the brain structures,” Biological Cybernetics, vol. 65, pp. 203210, 1991. [5] V. Vapnik, S. Golowich, and A. Smola, “Support vector method for function approximation, regression estimation and signal processing,” In Advances in Neural Information Processing System, pp. 281-287, 1997. [6] K. Englehart, B. Hudgins, P. A Parker, and M. Stevenson, “Classification myoelectric signal using time -frequency representation,” Medical Engineering and Physics, vol. 21, pp. 431-438, 1999. [7] Lütkepohl , “Comparison of the criteria for estimating the order of a vector autoregressive process,” Journal of Time Series Analysis, vol. 6, pp. 35-52, 1985. Correction, vol. 8, p. 373, 1987. [8] S. Gunn, “Support vector machines for classification and regression,” Technical Reports, Department of Electronics and Computer Science, Southampton University, 1998.
1298 374