Mar 31, 2005 - the successful development, deployment and maintenance of high-quality web-based ... This can be explained by the fact that web applications.
The Emerald Research Register for this journal is available at www.emeraldinsight.com/researchregister
The current issue and full text archive of this journal is available at www.emeraldinsight.com/1468-4527.htm
Classifying web metrics using the web quality model
Classifying web metrics
Coral Calero, Julia´n Ruiz and Mario Piattini ALARCOS Research Group, Computer Science Department, University of Castilla-La Mancha, Ciudad Real, Spain Abstract
227 Refereed article received 31 March 2005 Accepted 6 April 2005
Purpose – The purpose of this paper is to classify the most important metrics proposed for web information systems, with the aim of offering the user a global vision of the state of the research within this area. Design/methodology/approach – WQM distinguishes three dimensions related to web features, lifecycle processes and quality characteristics. A range of recently published (1992-2004) works that include web metrics definitions have been studied and classified within this model. Findings – In this work, a global vision of web metrics is provided. Concretely, it was found that about 44 percent of metrics are related to “presentation” and that most metrics (48 percent) are usability metrics. Regarding the life cycle, the majority of metrics are related to operation and maintenance processes. Nevertheless, focusing on metrics validation, it was found that there is not too much work done, with only 3 percent of metrics validated theoretically and 37 percent of metrics validated empirically. Practical implications – The classification presented tries to facilitate the use and application of web metrics for different kinds of stakeholders (developers, maintainers, etc.) as well as to clarify where web metric definition efforts are centred, and thus where it is necessary to focus future works. Originality/value – This work tries to cover a deficiency in the web metrics field, where many proposals have been stated but without any kind of rigour and order. Consequently, the application of the proposed metrics is difficult and risky, and it is dangerous to base decisions on their values. Keywords Worldwide web, Quality, Measurement Paper type Research paper
Introduction Web engineering aims to address and resolve the multifaceted problems of web-based systems development, and usually its main focus is the establishment and use of sound scientific and engineering management principles, as well as systematic approaches to the successful development, deployment and maintenance of high-quality web-based systems and applications (Heuser, 2004). Web applications are generally considered to be among the most difficult software constructs to size and cost (Umbers and Miles, 2004). Web Information Systems Engineering (WISE) differs from traditional information systems because of its unique technological platform and design philosophy (Oinas-Kukkonnen et al., 2001). In addition, with the quality-assurance process being a challenging one for the new discipline of web engineering (Deshpande´ et al., 2002), the This research is part of the CALIPO project (TIC 2003-07804-C05-03), supported by the Ministerio de Ciencia y Tecnologı´a, and the MESSENGER project (PCC-03-003-1), financed by “Consejerı´a de Ciencia y Tecnologı´a de la Junta de Comunidades de Castilla-La Mancha” (Spain).
Online Information Review Vol. 29 No. 3, 2005 pp. 227-248 q Emerald Group Publishing Limited 1468-4527 DOI 10.1108/14684520510607560
OIR 29,3
228
fact that WISE can provide realistic estimates early in a web application’s life cycle allows project managers and development organizations to manage resources effectively (Mendes et al., 2001). WISE aims to improve the quality of web sites, since according to Offutt (2002), high quality is the only mechanism that brings repeat users to web sites. Quality, however, is not always assured (Abraha˜o and Pastor, 2003; Cutter Consortium, 2000), perhaps because it is not universally definable and measurable (Ciancarini and Moretti, 2003). As stated in Kappel et al. (2004), a survey conducted by the Cutter Consortium (2000) found that the main problem areas of large-scale web application projects were failure to meet business needs (84 percent), project schedule delays (79 percent), budget overrun (63 percent), lack of required functionality (53 percent), and poor quality of deliverables (52 percent). This can be explained by the fact that web applications usually present disordered architectures, poor or non-existing documentation, and can only be analyzed, comprehended and modified with considerable effort (Di Lucca et al., 2004). In recent years, several experts have worked on different proposals to improve web quality, including methodologies (Castro et al., 2004; Ceri et al., 2000, 2004; Go´mez et al., 2001; Hennicker and Koch, 2000; Olsina et al., 2001), quality frameworks (Donaldson and Cowderoy, 1997; Katterattanakul and Siau, 2001), estimation models (Mendes et al., 2001), criteria (W3C WWW Consortium, 1999), usability guidelines (Krug, 2000; Nielsen, 2000), assessment methods (Schubert, 2003), and metrics. In fact, web metrics is a particularly valuable area of ongoing, commercially relevant research (Ruhe et al., 2003a, b). Since the 1990s, a wide ranging set of metrics has been proposed for quantifying web quality attributes (Abraha˜o et al., 2003; Alves de Silva and Ponti de Mattos Fortes, 2001; Bajaj and Krishnan, 1999; Baresi et al., 2003; Botafogo et al., 1992; Costagliola et al., 2004; Dhyani et al., 2002; Di Lucca et al., 2004; Fink, 2001; Herder, 2002; Henzinger, 2001; Ivory 2001, 2003; Ivory and Hearst, 2001; Ivory et al., 2001; Lafuente et al., 2001; Mendes and Counsell, 2000; Mendes et al., 2001, 2002a, b, 2003; Morisio et al., 1999; Olsina, 2000; Olsina et al., 2001, 2003; Olsina and Rossi, 2002; Reifer, 2000, 2002a, b; Rivlin et al., 1994; Rollo, 2000; Ruhe et al., 2003a; Umbers and Miles, 2004; Warren et al., 2001). Nevertheless, these metrics are sometimes not well defined and nor are they empirically or theoretically validated, and hence they can confuse interested users instead of helping them. Recently, Dhyani et al. (2002) have proposed a web classification framework to try to determine how the classified metrics can be applied to improve web information access and use. However, they have discarded important dimensions such as life-cycle processes and web features, losing very important information about metrics. With the aim of classifying metrics in a broad manner, we have elaborated the Web Quality Model (WQM), which distinguishes three dimensions related to web features, life-cycle processes and quality characteristics (Ruiz et al., 2003). The first version of our model was developed in 2003 and was refined in a survey (Calero et al., 2004) by using it in the classification of 326 web metrics. The last version of our model has been refined in this paper by including organizational life-cycle processes, in order to make possible the classification of metrics related to effort and reuse – an essential element for the provision of competitive bids and for the maintenance of success in the marketplace ((Ruhe et al., 2003a).
In the following section, we present the WQM model, explaining each of its dimensions. In the subsequent section, we summarize the result of the classification of the most relevant web metrics. Conclusions and future work are dealt with in the last section.
Classifying web metrics
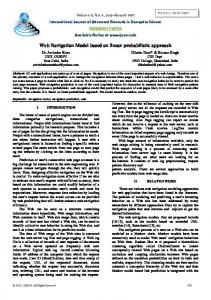
The Web Quality Model (WQM) Ramler et al. (2002) defined a cube structure in which they considered three basic aspects when testing a web site. Following on from this idea, we proposed (Ruiz et al., 2003) another “cube”, composed of those aspects to be taken into account in the evaluation of web site quality: features, life-cycle processes and quality aspects, which can be considered orthogonal. The model was reviewed by basing the features dimension on aspects relevant to the web found in the literature (Calero et al., 2004). Using this version of WQM, we classified 326 web metrics. In the current version, we have included changes in the life-cycle processes dimension by adding the organizational processes to the existing ones. In this section, we summarize the previous version of WQM, which is shown in Figure 1.
229
Web features dimension In this dimension, we include the three “classic” web aspects: content, presentation and navigation (Baresi et al., 2003; Fraternali, 1999; Go´mez et al., 2001). Navigation is an important design element, allowing users to acquire most of the information they are seeking and making that information easier to find. Presentation and content are prime components in making the page easier to use (Palmer, 2002). In content, we have included not only data such as text, figures, images, video clips, and so on, but also programs and applications that provide functionalities like scripts, CGI programs, Java programs, and others. Content also deals with structure and representation issues. Because of the close intertwining of functions and data, the border between them is not clearly drawn, and we consider them to be the same feature.
Figure 1. The Web Quality Model cube
OIR 29,3
Navigation is concerned with the facilities for accessing information as well as moving around the web. Presentation is related to the way in which content and navigation are presented to the user.
230
Quality characteristics dimension For the description of this dimension we use the Quint2 model (Niessink, 2002), based on the ISO 9126 standard, as a foundation (ISO/IEC, 2001). We have decided to use Quint2 instead of the standard because this model extends the ISO standard with new characteristics that are most appropriate for web products. Quint2 is a hierarchical model that fixes six basic characteristics, each of them with a set of sub-characteristics, to which a set of attributes is connected. These are the basic elements. The list below shows the characteristics of Quint2, indicating, where necessary, those sub-characteristics added or removed with respect to ISO 9126: (1) Functionality – a set of attributes that bear on the existence of a set of functions and their specified properties. The functions are those that satisfy stated or implied needs: . suitability – attribute of software that bears on the presence and appropriateness of a set of functions for specified tasks; . accuracy – attributes of software that bear on the provision of right or agreed results or effects; . interoperability – attributes of software that bear on its ability to interact with specified systems; . security – attributes of software that bear on its ability to prevent unauthorized access, whether accidental or deliberate, to programs or data; and . traceability (Quint2) – attributes of software that bear on the effort needed to verify correctness of data processing on required points. (2) Reliability – a set of attributes that bear on the capability of software to maintain its level of performance under stated conditions for a stated period of time: . maturity – attributes of software that bear on the frequency of failure by faults in the software; . fault tolerance – attributes of software that bear on its ability to maintain a specified level of performance in cases of software faults or of infringements of its specified interface. . recoverability – attributes of software that bear on the capability to re-establish its level of performance and recover the data directly affected in case of a failure, and on the time and effort needed for it; . availability (Quint2) – attributes of software that bear on the amount of time the product is available to the user at the time it is needed; and . degradability (Quint2) – attributes of software that bear on the effort needed to re-establish the essential functionality after a breakdown.
(3) Usability – a set of attributes that bear on the effort needed for use, and on the individual assessment of such use, by a stated or implied set of users: . understandability – attributes of software that bear on the users’ effort for recognising the logical concept and its applicability; . learnability – attributes of software that bear on the users’ effort for learning its application (for example, control, input, output); . operability – attributes of software that bear on the users’ effort for operation and operation control; . explicitness (Quint2) – Attributes of software that bear on the software product with regard to its status (progression bars, etc.); . attractivity (attractiveness in Quint2) – attributes of software that bear on the satisfaction of latent user desires and preferences, through services, behaviour and presentation beyond actual demand; . customisability (Quint2) – attributes of software that enable the software to be customized by the user to reduce the effort required for use and increase satisfaction with the software; . clarity (Quint2) – attributes of software that bear on the clarity of making the user aware of the functions it can perform; . helpfulness (Quint2) – attributes of software that bear on the availability of instructions for the user on how to interact with it; and . user-friendliness (Quint2) – attributes of software that bear on the users’ satisfaction. (4) Efficiency – a set of attributes that bear on the relationship between the level of performance of the software and the amount of resources used, under stated conditions: . time behaviour – attributes of software that bear on response and processing times and on throughput rates in performing its function; and . resource behaviour – attributes of software that bear on the amount of resources used and the duration of such use in performing its function. (5) Portability – a set of attributes that bear on the ability of the software to be transformed from one environment to another: . adaptability – attributes of software that bear on the opportunity for its adaptation to different specified environments without applying other actions or means than those provided for this purpose for the software in question; . installability – attributes of software that bear on the effort needed to install the software in a specified environment; . replaceability – attributes of software that bear on the opportunity and effort of using it in the place of specified other software in the environment of that software; and . co-existence (not included in Quint2) – the capability of the software to co-exist with other independent software in a common environment sharing common resources.
Classifying web metrics
231
OIR 29,3
232
(6) Maintainability – a set of attributes that bear on the effort needed to make specified modifications: . analysability – attributes of software that bear on the effort needed for diagnosis of deficiencies or causes of failures, or for identification of parts to be modified; . changeability – attributes of software that bear on the effort needed for modification, fault removal or for environmental change; . stability – attributes of software that bear on the risk of unexpected effect of modifications; . testability – attributes of software that bear on the effort needed for validating the (modified) software; . manageability (Quint2) – attributes of software that bear on the effort needed to (re)establish its running status; and . reusability (Quint2) – attributes of software that bear on its potential for complete or partial reuse in another software product. There is also a compliance sub-characteristic for all characteristics (attributes of software that make each characteristic adhere to application-related standards, conventions in law and similar prescriptions). Life-cycle processes dimension By introducing this dimension, we believe that we are also taking into consideration the different stakeholders involved in web development, who have different skills and therefore different priorities and attitudes (Mich et al., 2003). For example, the developer’s interests are considered in the development process. Hence, in this dimension we include the diverse processes of the web site life cycle, following the ISO 12207 standard (ISO/IEC, 1995; ISO, 2002). In the current version of the model we have considered both primary and organizational processes. As primary processes, we have included the development process, the operation process (which includes the operative support for users), and the maintenance process (which includes the evolution that the web site undergoes). As organizational processes, we have considered the project-management process (in order to classify estimation metrics), and the reuse program-management process (for classifying the reuse metrics). It is important to emphasize that the activities of these processes must not be developed sequentially, since, because of the characteristics of web development, it will be necessary to use more iterative models and even more flexible developments without following formal methodologies (Avison and Fitzgerald, 2003). Web metrics classification For the present study, we have extended the survey recorded in Calero et al. (2004), reviewing 60 papers from 1992 to 2004. From these, we have selected 40 where metric proposals (considered useful for classification purposes in WQM) were included. Furthermore, we have discarded those metrics that were outside the scope of our model (e.g. process metrics). We have also discarded metrics that did not provide any relevant information, as well as repeated metrics (proposed by more than one author),
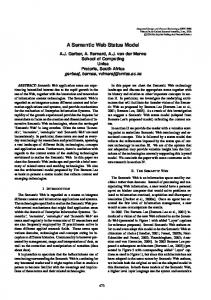
so that each metric is included only once. At the end of the selection, we had 385 metrics that were classified by the WQM. These metrics are listed in the Appendix. With regard to the classification itself, it should be noted that it is not a simple task, and we are conscious that some of the assignments may be arguable. In fact, some of the classifications from the survey conducted by Calero et al. (2004) have been changed in this version because of the inclusion of new values in the life-cycle processes dimension. Although the model does not restrict the number of cells that can be assigned to a given metric, we tried to minimize this number by assigning the metrics to the cells where they would be most useful. For the quality dimension, we show only the quality characteristic assigned, instead of the precise sub-characteristic, in order to make interpretation easier. For the assignment to a life-cycle process, we gave special consideration to operation and maintenance. In the web world, where the typical development timeline is 3-6 months (Reifer, 2000), it is difficult to distinguish when an operation finishes and maintenance begins. In case of doubt, we have classified metrics in both processes. Interpreting results The assignment of metrics to cells can be found in the Appendix, and the main figures of our classification are shown in Table I. The “% Absolute” row in Table I shows the percentage of metrics classified in each value dimension, and the sum of these values is greater than 100 percent since, as we have already explained, a metric can be classified in more than one cell in the cube. Because of this fact, we have extracted pro-rated (normalized) values, which are shown in the “% Pro-rated” row. Figure 2 shows metric distribution over the three dimensions of the model: web features, quality characteristics, and life-cycle processes, using pro-rated figures. Web features dimension. The results obtained in this dimension (about 44 percent of the metrics studied are “presentation” metrics) confirm the tendency in the web world to give presentation the greatest importance, making sites as attractive as possible for the end user. However, it is convenient to remark that there is usually confusion between presentation and navigation (Baresi et al., 2003). Therefore, there is the possibility that the results of navigation may vary depending on the person who carries out the classification. Quality characteristics dimension. About half of the metrics considered (48 percent) are usability metrics. We have to take into account that this data is pro-rated, because if we examine absolute data (Table I) we can see that 77 percent of metrics are related to usability. Again, this value confirms the end-user focus of trying to design usable web sites that attract users. But, it is curious that only 5 percent of metrics focus on reliability, when this characteristic is also extremely important for customer acceptance of web sites. In the end, we think that the diffusion of new devices (such as PDA, mobile phones, and so on) will encourage the definition of new portability metrics (currently only 8 percent of metrics). Life-cycle processes dimension. With respect to life cycle, operation (43 percent) and maintenance (30 percent) processes have the most metrics. These results can be justified by taking into account the evolutionary nature of the web. The fact that there
Classifying web metrics
233
44.42
Web site
43.9
171
35.8
% Pro-rated
47.8
184
Percentage
39.0
Total
150
% Absolute
Table I. Classification of metrics
Presentation
13.1
21.3
82
Functionality
Granularity level
20.3
22.1
85
Navigation
55.58
214
Web page
5.0
8.1
31
Reliability
47.8
77.4
298
Usability
8.2
13.2
51
Efficiency
7.5
12.2
47
Portability
3.38
13
18.4
29.9
115
Maintainability
Theoretical validation
Quality characteristics
17.2
26.2
101
43.2
66.0
254
Operation
37.40
144
30.0
45.7
176
Maintenance
Empirical validation
Development
Non-organizational
Lifecycle processes
234
Total
Content
Web features
87.01
1.9
2.9
11
Reuse
Auto 258
7.7
11.7
45
Effort
Organizational
OIR 29,3
Classifying web metrics
235
Figure 2. Metric distribution across the model dimensions
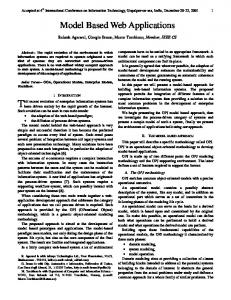
are not too many metrics defined for the development process (17 percent) can be explained by the fact that for companies doing business on the web, putting their software into the marketplace is the top priority. And so, rather than developing software from requirements through the waterfall development model, web development companies try to use rapid-application development methods and continuous prototyping (Reifer, 2000). Finally, we must indicate that there are only 10 percent of metrics for the organizational process (effort 8 percent and reuse 2 percent). We think that this result is not due to the unimportance of this process, but to the lack of research effort surrounding it (reflected in the low number of works found and considered for classification). Cell distribution. In this section, we show the results obtained from the triplets point of view in order to discover in which cells of the cube we can find many metrics defined. In Table II, the values obtained for each triplet of the cube are shown. As can be seen, the triplets where more metrics were found are the ones with usability as a quality sub-characteristic. Among them, the triplet (usability, operation, presentation) with 149 metrics, and the triplet (usability, maintenance, presentation) with 93 metrics are the most populated triplets of the cube. Moreover, the triplet (maintainability, maintenance, content) with 38 metrics, the triplets (functionality, development, content)
OIR 29,3
236
Table II. Values obtained for every triplet of the cube
Quality characteristic
Lifecycle process
Web feature
No. of metrics
Functionality Functionality Functionality Functionality Functionality Functionality Functionality Functionality Functionality Functionality Functionality Functionality Functionality Functionality Functionality Reliability Reliability Reliability Reliability Reliability Reliability Reliability Reliability Reliability Reliability Reliability Reliability Reliability Reliability Reliability Usability Usability Usability Usability Usability Usability Usability Usability Usability Usability Usability Usability Usability Usability Usability Efficiency Efficiency Efficiency Efficiency
Development Development Development Operation Operation Operation Maintenance Maintenance Maintenance Effort Effort Effort Reuse Reuse Reuse Development Development Development Operation Operation Operation Maintenance Maintenance Maintenance Effort Effort Effort Reuse Reuse Reuse Development Development Development Operation Operation Operation Maintenance Maintenance Maintenance Effort Effort Effort Reuse Reuse Reuse Development Development Development Operation
Content Presentation Navigation Content Presentation Navigation Content Presentation Navigation Content Presentation Navigation Content Presentation Navigation Content Presentation Navigation Content Presentation Navigation Content Presentation Navigation Content Presentation Navigation Content Presentation Navigation Content Presentation Navigation Content Presentation Navigation Content Presentation Navigation Content Presentation Navigation Content Presentation Navigation Content Presentation Navigation Content
34 7 10 8 13 10 11 5 4 34 12 6 3 0 0 9 5 6 3 12 0 5 10 11 7 5 6 2 0 0 31 26 42 47 149 39 31 93 27 31 32 9 0 0 0 9 7 5 15 (continued)
Quality characteristic
Lifecycle process
Web feature
No. of metrics
Efficiency Efficiency Efficiency Efficiency Efficiency Efficiency Efficiency Efficiency Efficiency Efficiency Efficiency Portability Portability Portability Portability Portability Portability Portability Portability Portability Portability Portability Portability Portability Portability Portability Maintainability Maintainability Maintainability Maintainability Maintainability Maintainability Maintainability Maintainability Maintainability Maintainability Maintainability Maintainability Maintainability Maintainability Maintainability
Operation Operation Maintenance Maintenance Maintenance Effort Effort Effort Reuse Reuse Reuse Development Development Development Operation Operation Operation Maintenance Maintenance Maintenance Effort Effort Effort Reuse Reuse Reuse Development Development Development Operation Operation Operation Maintenance Maintenance Maintenance Effort Effort Effort Reuse Reuse Reuse
Presentation Navigation Content Presentation Navigation Content Presentation Navigation Content Presentation Navigation Content Presentation Navigation Content Presentation Navigation Content Presentation Navigation Content Presentation Navigation Content Presentation Navigation Content Presentation Navigation Content Presentation Navigation Content Presentation Navigation Content Presentation Navigation Content Presentation Navigation
32 0 5 20 3 6 4 4 0 0 0 6 7 6 19 20 5 15 14 5 6 16 4 0 0 0 17 4 27 17 16 0 38 14 24 7 4 4 8 0 0
and (functionality, effort, content) with 34 metrics, as well as the triplet (efficiency, operation, presentation) with 32 metrics, deserve to be mentioned. On the other hand, it is important to observe that the cells related to reuse have few metrics, and some of them even have no defined metrics. In addition, the cells including effort have not received much attention in terms of metrics definition. This may be because of the fact that, until now, the only factor considered important for web quality was usability. From our point of view, however, things are changing, and metrics researchers are conscious of the importance of defining metrics for reuse and effort.
Classifying web metrics
237
Table II.
OIR 29,3
238
Other characteristics of the Web metrics Once metrics have been classified we can use them according to their concrete utility. However, it is necessary to have some other information about a metric to know not only what it can be used for, but also other characteristics such as, among others, its validation or its application level. In this section, we summarize the aspects we have considered together with the results obtained. We have considered the following properties (Calero et al., 2001): . granularity level, depending on whether the metric focuses on a single web page or on a web site as a whole; . theoretical validation helps us to know when and how to apply metrics, and their scale; . empirical validation, with the objective of proving the practical utility of the proposed metrics; and . automated support, i.e. whether or not there is a support tool that facilitates the calculation of the metrics. The results of this evaluation are shown in Table I together with the quality classification. As can be seen, there is a balanced distribution of metrics defined for web pages (44.42 percent) and web sites (55.58 percent). The results of the validation confirm that, unfortunately, web metric validation is not considered a major issue – especially theoretical validation (3 percent), but also empirical validation (37 percent). A large number of metrics are automated (67 percent). This is very important if we want to incorporate metrics into web development and maintenance projects. Conclusions and further work Web technologies and applications are becoming increasingly important in the information systems world. One of the main problems of web developments is their short life cycle, which can result in a lack of quality. Taking into account the importance of the web, however, this situation must be avoided as much as possible. A good mechanism for controlling the quality of a software product (and hence of a web site) is the use of metrics. But, at this point there are also some problems. In the literature, it is possible to find hundreds of web metrics, but no guidelines for their use. This chaotic situation makes the use of the defined metrics dangerous and difficult. In response to this chaos, in this paper we have presented the web metrics classification that we have performed with 385 metrics using WQM, a three-dimensional web quality model. As a result of this classification, we found that the triplet (usability, operation, presentation) with 149 metrics and the triplet (usability, maintenance, presentation) with 93 metrics are those with more defined metrics, and that most of the triplets that include reuse have no defined metrics. Regarding the metrics classified in this study, we do not claim that this survey is complete. It would be necessary to make an even more exhaustive study of the state of the art. We intend to define new metrics in those cells in which the non-existence of metrics is detected. We are interested in those cells that we think are, or will be, important for web technology. One of our priorities is the portability characteristic, which we think is particularly important when taking into account the new kinds of devices available.
It is also necessary to clarify that the classification will vary depending on the moment in which it is carried out, since the web is continually changing. For example, as mentioned previously, although the end user is the main priority in any case, the fact that new web applications are necessary for mobile devices could result in a change in web tendencies, which will be reflected in the classification. Besides, other kinds of factors can be influential. For instance, some years ago the most important aspect of a web site was usability, but now accessibility plays a very important role. These tendencies influence research and therefore the result of the classification. The final goal of our model is to determine, for each cell of the cube, the most useful metrics. To do so, we plan to apply techniques such as main-component analysis. After attaining the right set of metrics in each cell of the cube, we will be able to use them for constructing a “total web quality” expression by combining all the cells of the cube. This expression could be used to calculate the quality of a given web site.
References Abraha˜o, S. and Pastor, O. (2003), “Calidad de sistemas web”, in Piattini, M.G. and Garcı´a, F.O. (Eds), Calidad en el Desarrollo y Mantenimiento del Software, Editorial RA-MA, Madrid, pp. 119-38 (in Spanish). Abraha˜o, S., Condori-Fernandez, N., Olsina, L. and Pastor, O. (2003), “Defining and validating metrics for navigational models”, Proceedings of the 9th International Software Metrics Symposium (METRICS’03), Sydney, IEEE CS Press, Los Alamitos, CA, pp. 200-10. Alves de Silva, A. and Ponti de Mattos Fortes, R. (2001), “Web quality metrics: an analysis using machine learning systems”, International Conference on Information Systems, Analysis and Synthesis, World Multiconference on Systemics, Cybernetics and Informatics, Information Systems Technology, SCI 2001/ISAS 2001, Vol. XI. Avison, D.E. and Fitzgerald, G. (2003), “Where now for development methodologies?”, Communications of the ACM, Vol. 46 No. 1, pp. 79-82. Bajaj, A. and Krishnan, R. (1999), “CMU-WEB: a conceptual model for designing usable web applications”, Journal of Database Management, Vol. 10 No. 4, pp. 33-43. Baresi, L., Morasca, S. and Paolini, P. (2003), “Estimating the design effort of web applications”, Proceedings of the 9th International Metrics Symposium (METRICS’03), Sydney, IEEE CS Press, Los Alamitos, CA, pp. 62-72. Botafogo, R., Rivlin, E. and Schneiderman, B. (1992), “Structural analysis of hypertexts: identifying hierarchies and useful metrics”, ACM Transactions on Information Systems, Vol. 10 No. 2, pp. 142-80. Calero, C., Piattini, M. and Genero, M. (2001), “Empirical validation of referential integrity metrics”, Information Software and Technology, Vol. 43 No. 15, pp. 949-57. Calero, C., Ruiz, J. and Piattini, M. (2004), “A web metrics survey using WQM”, in Koch, N., Fraternali, P. and Wirsing, M. (Eds), Proceedings of the 4th International Conference on Web Engineering, ICWE 2004, LNCS 3140, Springer-Verlag, Heidelberg, pp. 147-60. Castro, V., Marcos, E. and Ca´ceres, P. (2004), “A user services-oriented method to model web information systems”, 5th International Conference on Web Information Systems Engineering – WISE 2004, Brisbane, 22-24 November. Ceri, C., Fraternali, P. and Bongio, A. (2000), “Web modeling language (WebML): a modeling language for designing web sites”, Computer Networks, Vol. 33 Nos. 1-6, pp. 137-57.
Classifying web metrics
239
OIR 29,3
240
Ceri, C., Dolog, P., Matera, M. and Nejdl, W. (2004), “Model-driven design of web applications with client-side adaptation”, Proceedings of the 4th International Conference on Web Engineering, Springer-Verlag, Heidelberg, pp. 201-14. Ciancarini, P. and Moretti, R. (2003), “Towards a framework for web site quality evaluation”, 15th International Conference on Software Engineering and Knowledge Engineering, San Francisco, CA, July 1-3, pp. 721-725. Costagliola, G., Ferrucci, F., Gravino, C., Tortora, G. and Vitiello, G. (2004), “A COSMIC-FFP based method to estimate web application development effort”, in Koch, N., Fraternali, P. and Wirsing, M. (Eds), Proceedings of the 4th International Conference on Web Engineering, Springer-Verlag, Heidelberg, pp. 161-5. Cutter Consortium (2000), “Poor project management – problem of e-projects”, available at: www. cutter.com/press/001019.html Deshpande´, Y., Murugesan, S., Ginige, A., Hansen, S., Schwabe, D., Gaedke, M. and White, B. (2002), “Web engineering”, Journal of Web Engineering, Vol. 1 No. 1, pp. 61-73. Dhyani, D., Ng, W.K. and Bhowmick, S.S. (2002), “A survey of web metrics”, ACM Computing Surveys, Vol. 34 No. 4, pp. 469-503. Di Lucca, G.A., Fasolino, A.R., Tramontata, P. and Visaggio, C.A. (2004), “Towards the definition of a maintainability model for web applications”, 8th European Conference on Software Maintenance and Re-Engineering, Tampere, March 24-26, pp. 279-87. Donaldson, A.J.M. and Cowderoy, A.J.C. (1997), “Towards multimedia systems quality”, paper presented at the ESSI-SCOPE Conference, Dublin, 15-16 September. Fink, D. (2001), “Web site effectiveness: a measure of information and service quality”, Information Resource Management Association International Conference, Toronto, May, pp. 144-7. Fraternali, P. (1999), “Tools and approaches for developing data-intensive web applications: a survey”, ACM Computing Surveys, Vol. 31 No. 3, pp. 227-63. Go´mez, J., Cachero, C. and Pastor, O. (2001), “Conceptual modeling of device-independent web applications”, IEEE Multimedia, April-June, pp. 26-39. Hennicker, R. and Koch, N. (2000), “A UML-based methodology for hypermedia design”, in Evans, A., Stuart, S. and Selic, B. (Eds), UML’2000 – The Unified Modeling Language – Advancing the Standard, Lecture Notes in Computer Science, Vol. 1939, Springer-Verlag, Heidelberg. Henzinger, M. (2001), “Hyperlink analysis for the web”, IEEE Internet Computing, Vol. 5 No. 1, pp. 45-50. Herder, E. (2002), “Metrics for the adaptation of site structure”, Proceedings of the German Workshop on Adaptivity and User Modeling in Interactive Systems, ABIS02, Hanover, pp. 22-6. Heuser, L. (2004), “The real world or Web engineering?”, in Koch, N., Fraternalli, P. and Wirsing, M. (Eds), Proceedings of the 4th International Conference on Web Engineering, LNCS 3140, Springer-Verlag, Heidelberg, pp. 1-5. ISO (2002), International Standard. Information Technology – Software Life-Cycle Processes, Amendment 1, ISO/IEC 12207, International Organization for Standardization, Geneva. ISO/IEC (1995), Information Technology: Software Life Cycle Processes, ISO/IEC 12207, International Organization for Standardization, Geneva. ISO/IEC (2001), Software Product Evaluation – Quality Characteristics and Guidelines for their Use, ISO/IEC 9126, Vol. 9126, International Organization for Standardization, Geneva.
Ivory, M.Y. (2001), “An empirical foundation for automated web interface evaluation”, PhD thesis, Computer Science Division, University of California, Berkeley, CA. Ivory, M.Y. (2003), Automated Web Site Evaluation, Kluwer, Dordrecht.
Classifying web metrics
Ivory, M.Y. and Hearst, M. (2001), “The state-of-the-art in automating usability evaluation of user interfaces”, ACM Computing Surveys, Vol. 33 No. 4, pp. 470-516. Ivory, M.Y., Sinha, R.R. and Hearst, M.A. (2001), “Empirically validated web page design metrics”, SIGCHI Conference on Human Factors in Computing Systems, Seattle, WA, pp. 53-60. Kappel, G., Michlmayr, E. and Pro¨ll, B. (2004), “Web engineering – old wine in new bottles?”, in Koch, N., Fraternalli, P. and Wirsing, M. (Eds), Proceedings of the 4th International Conference on Web Engineering, LNCS 3140, Springer-Verlag, Heidelberg, pp. 6-12. Katterattanakul, P. and Siau, K. (2001), “Information quality in internet commerce design”, in Piattini, M., Calero, C. and Genero, G. (Eds), Information and Database Quality, Kluwer, Norwell, MA, pp. 45-56. Krug, S. (2000), Don’t Make Me Think: A Common Sense Approach to Web Usability, New Riders, Indianapolis, IN. Lafuente, G., Gonza´lez, J. and Olsina, L. (2001), “Automatizando me´tricas Web”, 48 Encontro para a Qualidade nas Tecnologias de Informac¸a˜o e Comunicac¸o˜es (QUATIC), Lisbon, pp. 17-24. Mendes, E. and Counsell, S. (2000), “Web development effort estimation using analogy”, Proceedings of the 2000 Australian Software Engineering Conference – ASWEC 2000, Canberra, April 28-30, pp. 203-12. Mendes, E., Mosley, N. and Counsell, S. (2001), “Estimating design and authoring effort”, IEEE MultiMedia, Special Issue, January-March, pp. 50-7. Mendes, E., Mosley, N. and Counsell, S. (2002a), “Comparison of web size measures for predicting web design and authoring effort”, IEEE Proceedings – Software, Vol. 149 No. 3, pp. 86-92. Mendes, E., Mosley, N. and Counsell, S. (2003), “Early web size measures and effort prediction for web costimation”, Proceedings of the 9th IEEE International Software Metrics Symposium (METRICS’2003), Sydney, IEEE CS Press, Los Alamitos, CA, pp. 18-29. Mendes, E., Watson, I., Triggs, C., Mosley, N. and Counsell, S. (2002b), “A comparison of development effort estimation techniques for web hypermedia applications”, Proceedings of the 8th IEEE International Software Metrics Symposium (Metrics 2002), Ottawa, June, pp. 131-40. Mich, L., Franch, M. and Gaio, L. (2003), “Evaluating and designing web site quality”, IEEE Multimedia, January-March, pp. 34-43. Morisio, M., Stamelos, I., Spahos, V. and Romano, D. (1999), “Measuring functionality and productivity in web-based applications: a case study”, Proceedings of the 6th International Software Metrics Symposium, Boca Raton, FL, November, pp. 111–18. Nielsen, J. (2000), Designing Web Usability, New Riders, Indianapolis, IN. Niessink, F. (2002), “Software requirements: functional and non-functional software requirements”, available at: www.cs.uu.nl/docs/vakken/swa/Slides/SA-2-Requirements.pdf Offutt, J. (2002), “Quality attributes of web software applications”, IEEE Software, March-April, pp. 25-32. Oinas-Kukkonnen, H., Alatalo, T., Kaasila, J., Kivela¨, H. and Sivunen, S. (2001), “Requirements for web engineering methodologies”, in Rossi, M. and Siau, K. (Eds), Information Modelling in the New Millennium, Idea Group Publishing, Hershey, PA, pp. 360-82.
241
OIR 29,3
242
Olsina, L. (2000), “Quantitative methodology for evaluation and comparison of web site quality”, PhD thesis, Ciencias Exactas School, UNLP, La Plata. Olsina, L. and Rossi, G. (2002), “Measuring web application quality with WebQEM”, IEEE Multimedia, October-December, pp. 20-9. Olsina, L., Lafuente, G. and Rossi, G. (2001), “Specifying quality characteristics and attributes for web sites”, in Murugesan, S. and Deshpande´, Y. (Eds), Web Engineering: Managing Diversity and Complexity of Web Application Development, Springer-Verlag, Heidelberg, pp. 266-77. Olsina, L., Martı´n, M., Fons, J., Abraha˜o, S. and Pastor, O. (2003), “Towards the design of a metrics cataloging system by exploiting conceptual and semantic web approaches”, Proceedings of the International Conference on Web Engineering (ICWE 2003), LNCS 2722, pp. 324-33. Palmer, J. (2002), “Web site usability, design and performance metrics”, Information Systems Research, Vol. 13 No. 2, pp. 151-67. Ramler, R., Weippl, E., Winterer, M., Schwinger, W. and Altmann, J. (2002), “A quality-driven approach to web testing”, Ibero-american Conference on Web Engineering, ICWE 2002, Santa Fe, Vol. 1, pp. 81-95. Reifer, D. (2000), “Web development: estimating quick-to-market software”, IEEE Software, November/December, pp. 57-64. Reifer, D. (2002a), “Ten deadly risks in internet and intranet software development”, IEEE Software, March/April, pp. 12-14. Reifer, D. (2002b), “Estimating web development costs: there are differences”, Crosstalk, June, pp. 13-17. Rivlin, E., Botafago, R. and Schneiderman, B. (1994), “Navigating in hyperspace: designing a structure-based toolbox”, Communications of the ACM, Vol. 37 No. 2, pp. 87-96. Rollo, T. (2000), “Sizing e-commerce”, Proceedings of the Australian Conference on Software Metrics (ACOSM 2000), Sydney. Ruhe, M., Jeffery, R. and Wieczorek, I. (2003a), “Using web objects for estimating software development effort for web applications”, Proceedings of the 9th International Metrics Symposium (METRICS 2003), Sydney, IEEE CS Press, Los Alamitos, CA, pp. 30-9. Ruhe, M., Jeffery, R. and Wieczorek, I. (2003b), “Cost estimation for web applications”, Proceedings of the 25th International Conference on Software Engineering, ACM Press, New York, NY, pp. 285-94. Ruiz, J., Calero, C. and Piattini, M. (2003), “A three-dimensional web quality model”, Proceedings of the International Conference on Web Engineering (ICWE 2003), LNCS 2722, pp. 384-5. Schubert, P. (2003), “Extended web assessment method (EWAM) – evaluation of electronic commerce applications from the customer’s viewpoint”, International Journal of Electronic Commerce, Vol. 7 No. 2, pp. 51-80, available at: www.e-business.fhbb.ch/eb/publications. nsf/id/118 Umbers, P. and Miles, G. (2004), “Resource estimation for Web applications”, Proceedings of the 10th International Symposium on Software Metrics (METRICS 2004), Chicago, IL, IEEE CS Press, Los Alamitos, CA, pp. 370-81. W3C WWW Consortium (1999), “Web content accessibility guidelines 1.0”, W3C Working Draft, available at: www.w3.org/TR/WCAG10/ Warren, P., Gaskell, C. and Boldyreff, C. (2001), “Preparing the ground for web site metrics research”, Proceedings of the 3rd International Workshop on Web Site Evolution (WSE 2001), IEEE CS Press, Los Alamitos, CA, pp. 78-85.
Appendix
Classifying web metrics
243
Table AI. Metrics classification
OIR 29,3
244
Table AI.
Classifying web metrics
245
Table AI.
OIR 29,3
246
Table AI.
Classifying web metrics
247
Table AI.
OIR 29,3
248
Table AI.