Climate Change and Sustainable Heritage
Climate Change and Sustainable Heritage Edited by
Christian Kersten Hofbauer, Elham Madadi Kandjani and Jean Marie Corneille Meuwissen
Climate Change and Sustainable Heritage Edited by Christian Kersten Hofbauer, Elham Madadi Kandjani andJean Marie Corneille Meuwissen This book first published 2018 Cambridge Scholars Publishing Lady Stephenson Library, Newcastle upon Tyne, NE6 2PA, UK British Library Cataloguing in Publication Data A catalogue record for this book is available from the British Library Copyright © 2018 by Christian Kersten Hofbauer, Elham Madadi Kandjani, Jean Marie Corneille Meuwissen and contributors All rights for this book reserved. No part of this book may be reproduced, stored in a retrieval system, or transmitted, in any form or by any means, electronic, mechanical, photocopying, recording or otherwise, without the prior permission of the copyright owner. ISBN (10): 1-5275-0595-2 ISBN (13): 978-1-5275-0595-7
TABLE OF CONTENTS
Foreword ................................................................................................... vii Dr. Rudolf Ingo Sonnek Foreword .................................................................................................... ix Joost Meuwissen Preface ........................................................................................................ xi Christian Kersten Hofbauer and Elham Madadi Kandjani Approaches to the Evaluation and Mitigation of the Urban Microclimate ............................................................................................... 1 Ardeshir Mahdavi Urban Bioclimate and Micro Climate: How to Construct Cities in the Era of Climate Change .................................................................... 38 Andreas Matzarakis, Dominik Fröhlich, Christine Ketterer and Letizia Martinelli The Sea Level Rise and Ancient Settlements Under Threat: The Case of Anatolia ................................................................................. 62 E. Duygu Kahraman, M. Burcu Sılaydın Aydın and Ayşegül Altınörs Çırak Coastal Management: Resolving Climate Change Issues through a Statutory Framework .............................................................................. 80 Kalpana S Murari The Heritage Challenge ........................................................................... 113 Claudia Volberg Impact of Sociocultural Values on Housing Design in Palestine ............ 130 Mohammed Itma Integrated Bikeway Design in Green Cities ............................................ 143 Dalia Abdel Moneim Osman
vi
Table of Contents
Impact of Salt and Moisture on Stone Decay of Cultural Heritage ......... 162 Isabel Egartner and Oliver Sass Multi-Sectorial and Multi-Stress: Resident Perspectives on Protecting the Great Barrier Reef.............................................................................. 181 Susanne Becken, Brent Moyle and Char-Lee McLennan The Impact of Climate Change in Hong Kong on the Strategic Planning for Built Heritage: A Case Review of Lui Seng Chun............................. 194 HO Wai-man
FOREWORD
The oil shock, as the first oil crisis in the early 70s, was later called, caught all of us completely off-guard due to this challenging and sudden limitation of a resource whose supply had been considered reliable caused a twofold reaction over the following years. Firstly, the usage of conventional energy won from oil and gas decreased while the efficiency of the energy that was used increased – not only due to the apparent scarcity but also because of cost increases. Secondly, attempts were made at developing new, heretofore unknown energy sources, some of which were considered impossible at the time. What we today call renewable energy stems from the success of these attempts. Solar, water, wind and geothermal power already cover a considerable portion of our energy needs. The process of switching from conventional to renewable energy continues unabated. Fluctuations in the price of oil and gas may affect the speed of this change, but it can no longer be stopped. Looking back at the last several decades, it becomes clear that a paradigm shift has occurred, not only in the legislation of many countries but also in the heads of the people. Another change is also worth noting. In the beginning, the main idea behind the efforts to increase energy efficiency was to reduce the dependence on oil-producing countries. However, an additional aspect soon began to gain importance. The first effects of the ostensibly neverending oil boom and the corresponding air-polluting emissions had become apparent in the damage caused to forests in many parts of the world. Sulphur dioxide, a component of industrial, traffic and heating emissions, was soon identified as the main culprit responsible for the acid rain that was destroying forests. Once the cause was ascertained, the affected countries responded rapidly with legislative changes. Step by step, the sulphur content of oil-based fuels was reduced. The forests recovered, and the forest dieback that had been feared failed to materialise. As a result, people started taking a closer look at other exhaust gases that were being released into the atmosphere and analysing their effects on the environment. Today it is assumed that we are in the midst of a man-made climate change, with rising temperatures that are primarily being caused by the ever-increasing concentration of carbon dioxide in our atmosphere.
viii
Table of Contents
Climate change poses the next great challenge we must face. Until recently, the focus has been on stopping or at least reducing the speed of this change, mainly by further reducing greenhouse gas emissions. However, an equally important but hitherto much-neglected issue lies in researching the effects of climate change on our natural and cultural heritage. We need sustainable solutions to the many problems that are presenting themselves; some are clear and urgent, others vague and seemingly far off. There is a reason to fear that we are not yet equipped to solve many of the problems we face today or those that await us in the future; in fact, we are not even aware of many of them. The organisers of the CCSH15 have taken it upon themselves to be the first to tackle this challenge head-on and in a comprehensive way. The conference lectures and discussions are truly eye-opening and reveal two common threads that run through all the various topics: 1) the majority of the problems can only be solved through inter- and multidisciplinary approaches, and 2) most of the solutions can only be realised at the global level. The conference also set an important impulse toward ensuring that future challenges can never again catch us off-guard. We can only hope that this message is taken to heart. Dr. Rudolf Ingo Sonnek
FOREWORD
The world-wide change of climate is a proven fact and not a guess anymore. It is measurable. For that, ever more sophisticated measuring methods are developed in meteorology. What brings the climate to change is a subject for scientific discussion, and so are its effects upon each part of the world. On the basis of various meteorological models, a range of possible futures is prognosticated, varying from doom-scenarios of catastrophes of all kinds to step by step adaptive ones. While a fear of disaster at many places may give cause to a planning of security and protection, it also prompts the political rhetoric that puts climate change high on the international agenda. This, in turn, enables researchers from quite different fields of expertise to invent the more adaptive tools. They focus on zero-emission, which need not necessarily come down to energy-reduction. It might even mean more energy but in smarter cycles. In that respect, environment protection and economic growth do not contradict each other. The new economy is not about restrictions. It is about inventions that come forward from ideas that emerge when highly specialised professions meet. This has become possible only after the rise of digital data-processing, which enters into these specialised fields equally, making them transparent, and at the same time allows each of them to keep employing their own organisational depth as a kind of heritage. In that respect, there is no urge for a neutralising interdisciplinary approach. What formerly were called sectoral planning approaches, now call them heritages. This, then, would not only apply to buildings, urban ensembles, and coastal landscapes but also to the sciences being apt to handle them through object-orientated, flexible, and more or less short-term organisations that must be set up time and again. National or local heritage is not only an official denomination. Its implementation also requires funds, investments, scientific research, possibilities of re-use, and the people, to meet. As a guideline for those processes, which may be as volatile as the scale or a preferable degree of institutionalisation in a certain given situation allows, we coined the term sustainable heritage.
x
Foreword
Such thoughts formed the rationale at preparing the 1st International Academic Conference on Climate Change and Sustainable Heritage 2015, which was organised by the Institute of Urbanism at Graz University of Technology, Austria, in collaboration with the Cultema Laboratory Network, and which took place on February 18 and 19, 2015. In all its diversity, and through its horizontal platforms, the conference was hailed as a relief. This book offers a representative selection of the lectures at that delightful conference. Enjoy it. Joost Meuwissen
PREFACE
Greenhouse gas emissions have harmful effects on the quality of life, the economy, the environment and, consequently on the Heritage. One of the most important and urgent problems the human species faces today is Climate Change. It concerns our cultural and natural Heritage. It is crucial to address this issue in all its social, physical and cultural consequences. This can be stressed by the quest for management approaches on international, national and local levels. Far-reaching actions are needed to adapt the natural and historic environment to make it more resilient and to limit further damage. This has significant implications for the management of Sustainable Heritage. The publication deals with scenarios and impacts of climate change and has been focused on urban regions and on heritage-related scenarios dealing with the effects of climate change on our cultural and natural heritage, disaster management, adaptation to climate change and with the sustainability in building and urban planning. The publication is dedicated to the effects of the combustion of fossil fuels and the destruction of tropical forests, resulting in the warming of the global climate since the mid-20th century growing emissions of carbon that escapes into the atmosphere. This climate warming of the average temperature leads to an overall change in intensity, a shift of the seasons, extreme weather events such as heat or cold waves changing ocean currents, sudden storms and flash floods, the increase of rainfall and sea levels, and the increasing frequency and intensity of rainfall, storms, droughts, heat waves and other extreme weather events. These adverse developments will affect the demand for energy, the reduction of drainage capacity of wastewater treatment plants and the long-term increase in the coastal cultural and natural heritage sites. Historic buildings are also concerned which face higher visitor-frequency, thus demanding higher cooling capacity and higher energy consumption in summer. The book aims at a transdisciplinary dialogue for resilient and sustainable planning. The goal is to develop strategies and principles, which are related to the impact of climate change on disaster management, adaptation and mitigation. The research is based on the knowledge of
xii
Preface
several academic disciplines, applied sciences and expertise, such as social sciences, natural sciences and humanities. Finally, as editors, we would like to express our sincere thanks and appreciation to all the contributing authors and to the team from CSP who helped us in preparing this volume. Christian Kersten Hofbauer Elham Madadi Kandjani (Editors)
APPROACHES TO THE EVALUATION AND MITIGATION OF THE URBAN MICROCLIMATE ARDESHIR MAHDAVI Department of Building Physics and Building Ecology TU Wien, Austria
[email protected]
Abstract Cities are highly complex entities: A multitude of environmental, economic, and social disciplines, approaches, and studies must be employed to understand better the intricate life and evolution of structures we call cities. In this context, the present paper focuses on the challenging and consequential topic of the urban microclimate. In recent history, cities have grown in number and size, emerging thus as massive anthropogenic interventions in the planetary environment. The urban microclimate with its temporal and spatial variance can significantly influence the performance of buildings and the well-being of the city dwellers. In light of this, there is a critical need for a deeper understanding of the tightly intertwined feedback loops between the local, regional, and global climate and their consequences for urbanism. Keywords: Urban microclimate, Urban heat islands, Microclimatic variance
Introduction An increasing number of research efforts around the world address the nature and challenges of the urban microclimate (Alexandri 2007, Arnfield 2003, Blazejczyk et al. 2006, Gaffin et al. 2008, Grimmond 2007, Kleerekoper et al. 2012, Mahdavi et al. 2013, Mahdavi et al. 2014a, Kiesel et al. 2013a, Oke 1981, Shishegar 2013, Unger 2004, Voogt 2002). Thereby, the climate change and its consequences for cities represent a critical factor. Another important factor is the steady increase in the
2
Approaches to the Evaluation and Mitigation of the Urban Microclimate
concentration of the world population in cities. The urban microclimate affects people's health and their experience of outdoor thermal conditions in the cities (Harlan and Ruddell 2011). Moreover, the temporal and spatial variance of urban microclimate is also causally related to buildings' thermal performance (Akbari 2005). The adverse traits of the evolution of the urban microclimate in cities across all continents provide the motivational background to broach a number of salient questions: How do cities differ climatically from their surrounding non-urban areas? What is the extent of microclimatic variance within cities? Can physical features of the urban environment explain the variance of urban microclimate? What measures are likely to mitigate negative urban microclimatic circumstances? How can we predict and evaluate the effectiveness of such measures? Far from offering definitive and exhaustive answers to these questions, the present contribution aims to further the urban climate discussion in the community of architects, urban planners, and other professionals and decision makers whose interests and activities relate to urban development issues and concerns. Toward this end, the present paper offers some research results (based on original data), methodological contributions, and general reflections.
A comparison of urban and rural temperatures A simple way to zoom in on the climatic genius loci of the urban realm is to compare the urban microclimate with that of the surrounding rural areas. This difference between urban and rural climates has been extensively studied (Voogt 2002, Arnfield 2003, Blazejczyk et al. 2006, Gaffin et al. 2008). Specifically, the concept of Urban Heat Island (UHI) was proposed to express the difference between urban and rural air temperature (Oke 1972). While UHI may be a problematic and potentially misleading concept, it is quite pervasive in the literature and – if treated carefully – can provide a rough first impression of urban-level microclimatic processes and phenomena. The magnitude of the UHI effect can be expressed in terms of Urban Heat Island intensity. This term denotes the temperature difference between simultaneously measured urban and rural temperatures. UHI intensities are generally observed to be in the range of 1 to 3 K but can be as high as 12 K (Voogt 2002). A number of factors have been suggested to influence ambient temperatures in the urban realm. These include the urban morphology, physical properties of urban surfaces, the extent of vegetated areas and water bodies, as well as anthropogenic heat emissions (Grimmond et al.
Ardeshir Mahdavi
3
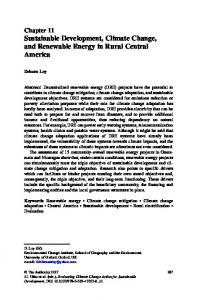
1991, Akbari et al. 2001, Taha 1997). A similar set of factors is also believed to partially explain the spatial and temporal variance of microclimatic conditions in different locations in a city (Mahdavi et al. 2013). The frequency, magnitude, and time-dependency (diurnal and nocturnal) of UHI intensity as well as the long-term development of urban and rural temperatures in eight Central-European cities (Budapest, Ljubljana, Modena, Padua, Prague, Stuttgart, Vienna, and Warsaw) was one of the subjects of a recent research effort supported by the European Union (UHI 2014, Mahdavi et al. 2013, 2014a, 2014b). The collected information for each city included hourly data on air temperature, wind speed, and precipitation from two weather stations (one urban and one rural). For these cities, UHI intensity was derived for a reference summer week (with high air temperature and relatively low wind velocity). Figure 1 shows the results in terms of cumulative distribution functions for UHI intensity. To visualise the diurnal pattern of the UHI intensity, Figure 2 includes the respective values for a reference summer day. These results obviously substantiate the existence of a significant difference between the urban and rural temperatures of the Central-European cities studied, especially during the night hours (Figure 2). But they also point to the considerable differences amongst the cities with regard to the time-dependent UHI patterns.
Approaches to the Evaluation and Mitigation of the Urban Microclimate
4 100 90
Cumulative frequency [%]
80 VIENNA
70
STUTTGART
60
PADUA
50
BUDAPEST
40
PRAGUE
30
MODENA
20
WARSAW
10
LJUBLJANA
10
8
6
4
2
0
-2
-4
-6
0 UHI intensity [K]
Figure 1: Cumulative distribution function for UHI intensity in eight European cities (based on data pertaining to a one-week summer period) 7 6 VIENNA
UHI intensity [K]
5
STUTTGART
4
PADUA
3
BUDAPEST
2
PRAGUE
1
MODENA WARSAW
0
LJUBLJANA
-1 23:00
21:00
19:00
17:00
15:00
13:00
11:00
09:00
07:00
05:00
03:00
01:00
-2
Time
Figure 2: Hourly UHI intensity distribution for a reference summer day in eight European cities
Ardeshir Mahdavi
5
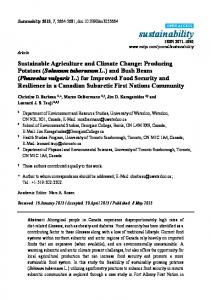
The above project also included the investigation of the long-term development of the urban and rural temperatures. Figures 3 and 4 show the mean annual urban and rural temperatures respectively over a period of 30 years. Figure 5 shows the UHI intensity trend over the same period. The historical temperature records suggest an upward trend concerning both urban and rural temperatures. Consistent with regional and global temperature trends, a steady increase in rural temperatures of up to about 2.5 K can be observed in most cases. In the same 30-years period, the mean annual urban temperature rose somewhere between 1 and 3 K. Note that, while collected data suggested that both rural and urban temperatures have been increasing, UHI intensity values have been rather steady (Figure 5). 16 15 14 VIENNA STUTTGART
12
PADUA
11
BUDAPEST
10
PRAGUE
9
MODENA WARSAW
8
LJUBLJANA
7 2010
2008
2006
2004
2002
2000
1998
1996
1994
1992
1990
1988
1986
1984
1982
6 1980
θ [0C]
13
Year
Figure 3: Long-term development of (mean annual) urban temperatures in eight European cities over a period of 30 years
Approaches to the Evaluation and Mitigation of the Urban Microclimate
6 16 15 14
VIENNA STUTTGART
12
PADUA
11
BUDAPEST
10
PRAGUE
9
MODENA WARSAW
8
LJUBLJANA
7
2010
2008
2006
2004
2002
2000
1998
1996
1994
1992
1990
1988
1986
1984
1982
6
1980
θ [0C]
13
Year
Figure 4: Development of (mean annual) rural temperatures in eight European cities
Figure 5: Long-term development of the mean annual UHI intensity in eight European cities
Ardeshir Mahdavi
7
The variance in urban climate One of the weaknesses of the aforementioned concept of the UHI intensity is related to the fact that cities cannot be said to have "a" climate. Rather, microclimatic conditions can and do vary considerably across a city. The following case studies provide an impression of the nature and extent of the diversity of microclimatic conditions within the urban domain. Such observations provide an objective basis for the formulation of hypotheses regarding the significance of various geometric and physical urban characteristics and how they may be causally related to emergent microclimatic conditions in different locations in a city.
Comparison of data from multiple weather stations One way to explore the intramural urban microclimatic variance is to compare weather data reported simultaneously from multiple locations in the city. We conducted such a comparison for the city of Vienna (Kiesel et al. 2012). Thereby, weather data was collected at several weather stations positioned in different locations throughout the city (see Table 1). Figures 6 and 7 show the mean hourly UHI intensity for central (A) and peripheral urban locations (B, C, D) for reference days representing the summer and winter periods in the year 2011. These results show the considerable extent of the urban ambient temperature differences across time (day, season) and space (location). The central urban location displays the highest UHI intensity level, particularly during the night hours. This may be explained with reference to factors such as thermal inertia of building masses, an abundance of impervious surfaces, and reduced night-time skyward radiation. Table 1: Overview of deployed Vienna weather stations
A B C D R
Weather station
Location
Innere Stadt Hohe Warte Donaufeld Groß Enzersdorf Seibersdorf
Urban (central) Urban (peripheral) Urban (peripheral) Urban (peripheral) Rural
Elevation (meters above sea level) 177 198 161 154 185
8
Approaches to the Evaluation and Mitigation of the Urban Microclimate
2.8 2.4 2.0
UHI intensity [K]
1.6 1.2 A
0.8
B
0.4
C
0.0
D
-0.4 -0.8
23:00
21:00
19:00
17:00
15:00
13:00
11:00
09:00
07:00
05:00
03:00
01:00
-1.2
TIME
Figure 6: Mean hourly UHI-intensity for central (A) and peripheral urban locations (B, C, D) in Vienna, Austria (summer period, 2011) 2.8 2.4 2.0
1.2 A
0.8
B
0.4
C
0.0
D
-0.4 -0.8 23:00
21:00
19:00
17:00
15:00
13:00
11:00
09:00
07:00
05:00
03:00
-1.2 01:00
UHI intensity [K]
1.6
TIME
Figure 7: Mean hourly UHI-intensity for central (A) and peripheral urban locations (B, C, D) in Vienna, Austria (winter period, 2011)
Ardeshir Mahdavi
9
Microclimatic diversity within a small spatial domain To further exemplify microclimatic variance on a relatively small-scale urban level, consider a case study conducted in a part of one of Vienna's central districts (Maleki et al. 2012, Maleki 2014, Kiesel et al. 2013b). Mobile weather stations were deployed to acquire weather information pertaining to air temperature, humidity, global solar radiation, and wind velocity. Moreover, for each measurement location, sky images were generated using a fish-eye camera. Data were collected at 13 morphologically differentiated locations (see Table 2). These locations varied in terms of typological category (street, plaza, park, courtyards) as well as a sky view factor, the presence of vegetation, albedo and thermal properties of surrounding surfaces, and presence or absence of water bodies. Data was collected from June to September in 2010 and 2011 on hot and sunny days from 11:00 to 18:00. The collected data were compared with the simultaneously monitored weather conditions via a proximate stationary weather station. Figure 8 shows the results of these measurements (for a representative summer day) in terms of the difference between temperatures measured at diverse locations and those measured simultaneously at the stationary weather station. The results demonstrate that even within a relatively small area of the city a considerable variance in thermal conditions exists. Again, the variations appear to be related to certain characteristic features of the locations (e.g., sky view factor, vegetation, etc.). Highest temperatures were monitored at large open plazas with impervious surfaces and little shading. Shaded courtyards and streets displayed the lowest daytime temperatures. Table 2: Location characteristics for short-term microclimatic measurements in central area in the city of Vienna (Maleki 2014) Location code
Location type
S1 S2 S3 S4 S5 S6 P1
street street street street street street plaza
Sky view factor [%] 30 29 59 16 67 47 16
Street height to width ratio 1.3 1.3 0.5 0.5 0.4 0.8 n/a
Vegetation no no heavy heavy no no heavy
10
P2 P3 C1 C2 G1 G2
Approaches to the Evaluation and Mitigation of the Urban Microclimate
plaza plaza courtyard courtyard park park
88 82 20 18 90 68
n/a n/a n/a n/a n/a n/a
no no no medium medium heavy
Figure 8: Deviation of measured air temperatures at 13 locations in a central district of Vienna over the course of a typical summer day from simultaneously reported data of a nearby reference weather station
Variance despite proximity A further case study conducted in the city of Vienna highlights significant microclimatic differences between weather data monitored via close-by weather stations (Lim et al. 2014). We wanted to know if data obtained from standard weather stations, which are typically mounted on the rooftop of buildings, truly represent close-by locations within the urban canyon. To answer this question, we compared temperature data from mobile monitoring stations located in urban canyons with simultaneously monitored data from nearby standard (stationary) weather stations across
Ardeshir Mahdavi
11
Vienna. Differences, when existing, would suggest that care should be taken when using standard weather station data as a boundary condition for thermal performance modelling of building designs, even if the intended location of the building is close to the location of the standard weather station. To provide an impression of the results of this study, Figure 9 compares the mobile weather station temperature data (θM) with the simultaneously monitored data from nearby stationary weather stations (θS) for two urban and two suburban locations. The results suggest that temperatures monitored via mobile monitoring stations located in the urban canyon were generally higher than the simultaneously reported data from the standard weather station. Specifically, the mean deviation of the mobile monitoring results from the standard weather station data (Figure 9) was 5.9 ± 7.5%. This difference is arguably due to the specific urban conditions such as morphology, the property of the surfaces in the surroundings, and sky view factor. When microclimatic data from standard weather stations are used for decision-making processes (e.g., building design and retrofit modelling applications), potential differences between such data and actual conditions within the urban fabric (e.g., at the specific location of planned interventions) must be taken into consideration. 32 30 28 26 24
θM (°C)
22 20 18 16 14 12 10 8 8
10
12
14
16
18
20
22
24
26
28
30
32
θS [°C]
Figure 9: Mobile (θM) versus stationary (θS) temperature measurements in four different locations in Vienna, Austria (white dots and solid regression line: morning measurements, dark dots and dashed regression line: afternoon measurements)
12
Approaches to the Evaluation and Mitigation of the Urban Microclimate
Impact of trees Another noteworthy instance of the microclimatic variance in Vienna was documented by Dimitrova et al. 2014. Thereby, the diversity of microclimatic conditions in two parallel streets was explored that are no more than 140 m apart. The only significant difference between these two streets is that one has trees, whereas the other one does not. These streets are otherwise very similar in view of other parameters (e.g., orientation, width, and surrounding building properties). Simultaneously monitored data from two mobile weather stations was obtained for the selected study areas during hot and sunny days in August 2012. The monitored difference between non-vegetated and vegetated street canyons is shown in the figures 10 to 13 with regard to temperature, global solar radiation, absolute humidity, and wind speed. The results clearly demonstrate the significant difference between the streets with and without trees. The measured temperature difference varies from 0.1 to 0.7 K, depending on the time of the day. In the afternoon, the air temperature was consistently higher in the non-vegetated urban canyon. The data further suggest that as the amount of incoming solar radiation increased substantially in the afternoon, the vegetated canyon stayed cooler. This observation highlights the important role of tree shading and evapotranspiration, especially during summer months.
Figure 10: Mean air temperature differences between non-vegetated and vegetated canyon for 20-minute time intervals in the morning (left) and in the late afternoon (right)
Ardeshir Mahdavi M
13
Figure 11: Mean global solar rad diation differrences betweeen nonvegetated aand vegetated d canyon forr 20-minute time interva als in the morning (leeft) and in thee late afterno oon (right)
Figure 12: M Mean absolute humidity differences d beetween non-v vegetated and vegetaated canyon for 20-minutte time interrvals in the morning (left) and in n the late afteernoon (right))
14
Approaches to the Evaluation and Mitigation of the Urban Microclimate
Figure 13: Mean wind speed differences between non-vegetated and vegetated canyon for 20-minute time intervals in the morning (left) and in the late afternoon (right)
Factors and models The study of the defining factors of the urban climate is not only exciting from the purely scientific point of view but also has major practical relevance. As stated at the outset, developments in the urban climate have repercussions for energy use and environmental emissions (e.g., due to increased installation of cooling systems in buildings) as well as for health and well-being of the city dwellers. A better understanding of the potential influencing variables with regard to urban microclimate aids the development of explanatory theories and predictive models that can be deployed toward objective consideration, assessment, and realisation of effective mitigation measures. Multiple paths may be followed to arrive at description and prediction of microclimatic processes in the cities and associated causal factors. Certain influencing factors, such as the aforementioned presence of vegetation, may be identified intuitively and appraised qualitatively. But to reliably identify and capture candidate independent variables in the urban climate research (toward the formulation of a black box, grey box, or white box causal models), further systematic efforts are needed. What follows is an outline of two potentially complementary approaches.
Ardeshir Mahdavi
15
Identification of independent variables A recurrent challenge with regard to the UHI phenomenon concerns the identification and evaluation of potential mitigation measures. As discussed before, certain interventions in the urban context (increase in vegetation, modification of urban surface properties, and reduction of emissions due to buildings, transportation, and industry) are believed to influence the urban microclimate and ameliorate the UHI ramifications. As these kinds of mitigation measures require substantial resources and major investments, they must be carefully assessed and evaluated before they are implemented. Toward this end, effective procedures, methods, and tools are needed. In the course of the previously mentioned project (UHI 2014), we developed a systematic framework (Mahdavi et al. 2013) to assess – for a specific urban location – the urban heat island phenomenon, to specify potential mitigation and adaptation measures, and to evaluate such measures via adequate modelling approaches. The main steps implied in this framework are as follows: i. ii. iii. iv.
Definition of "Urban Units of Observation" (U2O): These are suitably bounded areas within an urban setting selected as the target and beneficiary of candidate UHI mitigation measures. Description of the status quo of U2O in terms of a structured set of geometric and physical variables. Specification of the candidate mitigation measures in terms of projected changes in the geometric and/or physical properties defined in step ii above. Prediction of the effect of mitigation measures using empirically based (black box or grey box type) models.
The realisation of this framework hinges thus upon two requirements, namely the definition of a proper set of U2O variables and the establishment of empirically grounded relationships between U2O variable values and corresponding microclimatic patterns. As the urban microclimate is believed to be influenced by different urban morphologies, physical surface properties, vegetation, water, and emissions, we identified a set of related variables for the inclusion in the framework. The idea is to express potential UHI mitigation measures in terms of changes to the values of the U2O variables. Toward this end, we used both existing schemes and our own reasoning (Mahdavi et al. 2013, Kiesel et al. 2013b) to define such a set of variables (see Tables 3 and 4). Once U2Os and their respective variables are defined, potential mitigation measures may be expressed in terms of respective changes to the variable attributes. For
16
Approaches to the Evaluation and Mitigation of the Urban Microclimate
example, the introduction of green roofs or green facades in a U2O would modify the variables pertaining to surface albedo, emissivity, thermal conductivity, specific heat capacity, and density. Table 5 provides a concise summary (and a brief description of the expected benefits) of a number of common mitigation measures. These measures can be divided into three main realms of interventions: buildings, pavements, and vegetation. Table 3: Variables to capture the geometric properties of an urban unit of observation Geometric properties Sky View Factor Aspect ratio Built area fraction Unbuilt area fraction Impervious surface fraction Pervious surface fraction Equivalent building height Built surface fraction Wall surface fraction Roof surface fraction Effective mean compactness Mean sea level
Abbr.
Definition
SVF
Fraction of sky hemisphere visible from ground level Mean height-to-width ratio of street canyons Ratio of building plan area to total ground area Ratio of unbuilt plan area to total ground area Ratio of unbuilt impervious surface area to total ground area Ratio of unbuilt pervious surface area to total ground area Ratio of built volume (above terrain) to total ground area Ratio of total built surface area to total built area Ratio of the total area of vertical (wall) surfaces to total built area Ratio of the total area of horizontal (roof) surfaces to total built area Ratio of built volume (above terrain) to total surface area (built and unbuilt) Average height above sea level
H/W BAF UAF ISF PSF he BSF le hsl
Ardeshir Mahdavi
17
Table 4: Variables to capture the surface and material properties of an urban unit of observation Physical properties Reflectance/albedo
Abbr. αsw
Emissivity
εlw λ
Thermal conductivity Specific heat capacity
c ρ
Density Anthropogenic heat output
Qf
Definition Fraction of reflected shortwave radiation Surface property regarding (long wave) radiation A material's heat conduction property A material’s capacity to store heat Material mass contained per unit volume Heat flux due to human activity (traffic, industry, buildings, etc.)
Table 5: Examples of mitigation measures Category
Measure
Buildings
Cool roofs Green roofs Green facades
Pavements Green areas
Façade construction and retrofit Geometry of urban canyon (new projects) Cool pavements Pervious pavements Trees within the urban canyon, parks, green areas
Expected benefit High solar reflectance and thermal emissivity Shading (intensive green roofs) and evapotranspiration Reducing ambient air temperature, shading properties, natural cooling, airborne control pollutants, energy efficiency Reducing cooling/heating load, reducing ambient air temperature, improving building envelope quality Fresh air advection, cool air transport into the city Decreasing ambient air temperature Storm water management Shading and evapotranspiration, lower peak summer air temperatures, air pollution reduction
18
Approaches to the Evaluation and Mitigation of the Urban Microclimate
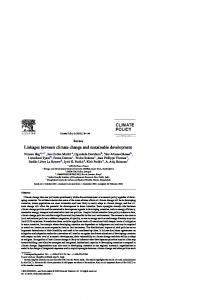
Finally, the impact of mitigation measures can be estimated with the aid of appropriate calculation tools and modelling methods. Correlations between measured UHI intensity in different locations within an urban environment and the physical features of these locations can be exploited to derive empirically based estimation methods. To test the explanatory power of the candidate variables with regard to location-dependent manifestations of microclimatic tendencies in a city, we can contrast measurements at multiple locations with respective geometry, surface, and material properties. A simple instance of such an inquiry may be provided using the case of the aforementioned study of microclimatic variance within a rather small urban domain in the city of Vienna (see Table 2 and Figure 8). The spread of the measured global solar irradiance and ambient air temperature values (expressed in terms of differences to a reference weather station) at these locations was examined in the context of the aforementioned U2O variables (see Tables 3 and 4). Thereby, as Figures 14 and 15 suggest, location variable "sky view factors" (SVF) displayed a noteworthy correlation with both day-time temperature and irradiance differences (Maleki et al. 2012, Maleki 2014).
Figure 14: Relationship between SVF and the relative deviation (in percentage) of global solar irradiance measured at various locations in central Vienna (see Table 2) and those measured simultaneously at a close by reference weather station