Sheng-Wei Jin,1, 2 Li Zhang,3 Qin-Quan Lian,2 Shang-Long Yao,1 Ping Wu,3. Xiao-Yan Zhou,3 ... In RBL-1 cells, Ca2+ entry through CRAC channels stim- ... LPS increases intracellular calcium ..... nels from recombinant transient receptor potentials (TRP's). [17]. ... fore, reduction-oxidation reactions involving ROS have.
Hindawi Publishing Corporation Mediators of Inflammation Volume 2006, Article ID 36192, Pages 1–8 DOI 10.1155/MI/2006/36192
Research Article Close Functional Coupling Between Ca2+ Release-Activated Ca2+ Channels and Reactive Oxygen Species Production in Murine Macrophages Sheng-Wei Jin,1, 2 Li Zhang,3 Qin-Quan Lian,2 Shang-Long Yao,1 Ping Wu,3 Xiao-Yan Zhou,3 Wei Xiong,3 and Du-Yun Ye3 1 Department
of Anesthesiology, Union Hospital, Tongji Medical College, Huazhong University of Science and Technology, Wuhan 430022, China 2 Department of Anesthesiology, Second Affiliated Hospital, Wenzhou Medical College, Wenzhou 325027, China 3 Department of Pathophysiology, Tongji Medical College, Huazhong University of Science and Technology, Wuhan 430030, China Received 14 June 2006; Revised 9 September 2006; Accepted 10 September 2006 Aim. To investigate the role of Ca2+ release-activated Ca2+ (CRAC) channels in the ROS production in macrophages. Methods. The intracellular [Ca2+ ]i was analyzed by confocal laser microscopy. The production of ROS was assayed by flow cytometry. Results. Both LPS and thapsigargin induced an increase in intracellular [Ca2+ ]i , either in the presence or absence of extracellular Ca2+ in murine macrophages. The Ca2+ signal was sustained in the presence of external Ca2+ and only initiated a mild and transient rise in the absence of external Ca2+ . CRAC channel inhibitor 2-APB completely suppressed the Ca2+ entry signal evoked by thapsigargin, and suppressed approximately 93% of the Ca2+ entry signal evoked by LPS. The increase in intracellular [Ca2+ ]i was associated with increased ROS production, which was completely abolished in the absence of extracellular Ca2+ or in the presence of CRAC channel inhibitors 2-APB and Gd3+ . The mitochondrial uncoupler carbonyl cyanide p-trifluoromethoxy-phenylhydrazone and the inhibitor of the electron transport chain, antimycin, evoked a marked increase in ROS production and completely inhibited thapsigargin and LPS-evoked responses. Conclusions. These findings indicate that the LPS-induced intracellular [Ca2+ ]i increase depends on the Ca2+ entry through CRAC channels, and close functional coupling between CRAC and ROS production in murine macrophages. Copyright © 2006 Sheng-Wei Jin et al. This is an open access article distributed under the Creative Commons Attribution License, which permits unrestricted use, distribution, and reproduction in any medium, provided the original work is properly cited.
INTRODUCTION In nonexcitable cells, one major route for Ca2+ influx is through store-operated Ca2+ channels (SOC) in the plasma membrane [1]. In some cell types including macrophages, store-operated Ca2+ influx channels are also called Ca2+ release-activated Ca2+ (CRAC) channels [1, 2]. However, the downstream consequences of CRAC channels activation are not clearly established. In Jurkat T cells, Ca2+ entry through CRAC channels is required for T-cell receptor-mediated activation of nuclear transcription factors that regulate the expression of cytokine genes central to the immune response [3]. In RBL-1 cells, Ca2+ entry through CRAC channels stimulates arachidonic acid production and leukotriene secretion [4]. Dysfunction of CRAC has been linked to severe combined immunodeficiency [5], acute pancreatitis [6], and Alzheimer’s disease [7]. CRAC inhibition attenuates neutrophil function and postshock acute lung injury in rats [8].
Professional phagocytes generate high levels of reactive oxygen species (ROS) using a superoxide-generating NADPH oxidase as part of their armory of microbicidal mechanisms, and ROS production is largely dependent on [Ca2+ ]i mobilization [9]. LPS increases intracellular calcium concentration and ROS production in macrophages [10]. There are a number of different Ca2+ channel types found in nonexcitable cells, such as macrophages [11]. In Kupffer cells (liver macrophages), LPS causes the irrepressible influx of calcium via L-type voltage-dependent calcium channels [12]. Macrophage activation by a vanadyl-aspirin complex is dependent on L-type calcium channel [13]. Yet, it is not clear whether LPS-induced intracellular Ca2+ increase depends on CRAC channels and the relationship between CRAC calcium entry and ROS production in macrophages. The aim of this study was to use Fluo-3/AM and DCFHDA as a probe to examine intracellular calcium concentration ([Ca2+ ]i ) changes and ROS generation in RAW264.7
2 macrophages challenged with LPS or thapsigargin. Our hypothesis was that LPS-induced intracellular [Ca2+ ]i increase depends upon CRAC channels, and CRAC channels are essential for ROS production in murine macrophages. MATERIALS AND METHODS Experimental protocol RAW264.7 cells were treated with LPS (2, 10 μg/mL) (Escherichia coli O111: B4, Sigma, USA) or thapsigargin (1, 2 μM) (ALEXIS, USA) in both the presence and absence of external Ca2+ . Intracellular calcium was monitored using laser confocal microscopy. ROS were measured by flow cytometry. Cell culture RAW264.7 cells (obtained from the China Center for Type Culture Collection, CCTCC, Shanghai, China) were cultured (37Æ C, 5% CO2 ) in RPMI 1640 medium (Gibco, BRL) with 10% fetal bovine serum and penicillin-streptomycin. For Ca2+ imaging experiments, cells were passaged onto 35 mm culture dishes containing glass coverslips (Nanjing Jiancheng Bioengineering Institute, Nanjing, China) and used 24 to 48 hours after plating. Intracellular Ca2+ measurements Fluo-3/AM (5 μM) (Biotium, Calif, USA) was added into the incubation medium and incubated for 30 minutes at 37Æ C. Cells were washed free of extracellular Fluo-3/AM dye in standard external solution containing (in mM) NaCl 145, KCl 2.8, CaCl2 2, MgCl2 2, D-glucose 10, and HEPES 10, pH 7.4, with NaOH. Ca2+ -free solution was a standard external solution without Ca2+ ; the Ca2+ was substituted with 1 mM EGTA. Fluorescence measurements of [Ca2+ ]i were performed using confocal laser scanning microscopy (Olympus FV500, Japan) with Olympus IX71 camera in the presence and absence of Ca2+ in the bath. Fluo-3 was excited at 488 nm and emission measured between 500 and 550 nm. Images of 512 � 512 pixels were acquired with a 20 � objective. Laser scanning was started to obtain a time series of images. Acquisition rate was 1 frame (512 � 512) per 15 seconds. The obtained images were quantitatively analyzed for changes in fluorescence intensities within regions of interest (ROIs) using the Olympus FV500 Vision software. In each cell well, at least 15 equivalent-sized ROIs were identified, monitored, and analyzed during the experimental period. Fluorescence intensity and the curve of the time course were analyzed by the computer automatically. Increase in [Ca2+ ]i is expressed as a ratio: fluorescence intensity of Fluo-3 over baseline (fluorescence/baseline). This ratio method is used because it is independent of factors such as dye concentration, excitation intensity, and detector efficiency. The flow cytometric assay of ROS The dye, DCFH-DA, has been used to measure intracellular generation of ROS. The method is based on the fact
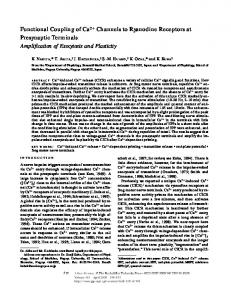
Mediators of Inflammation that DCFH-DA diffuses through the cell membrane and it is hydrolyzed by intracellular esterases to DCFH, which remains trapped within the cells. DCFH, a nonfluorescent compound, is able to react with ROS, and to generate the fluorescent 2� , 7� -dichlorofluorescein (DCF). Thus fluorescence intensity is proportional to the amount of ROS produced by the cells. Briefly, cells were harvested and suspended at a concentration of 1 � 106 cells/mL in PBS. Cells were washed with PBS and incubated with DCFH-DA (2� , 7� dichlorofluorescein diacetate, Molecular Probes, Ore, USA) (10 μM) for 20 minutes at 37Æ C in the dark. After washing twice with cold PBS, cells were analyzed by flow cytometry (Becton-Dickinson, NJ, USA). FL1 amplifier mode, DCFH, was excited at 488 nm and emitted at 525 nm. Phorbol 12myristate 13-acetate (PMA) 10 μM was used as a positive control. We determined M1 and M2 by mean fluorescence intensity as the gate, data were expressed as % gated, M1 stands for the percentage of negative cells, M2 stands for the percentage of positive cells. Approximately 10 000 cells were analyzed per group. Statistical analysis Data are expressed as mean � SD. The statistical analysis was carried out using SPSS 11.0 programs (SPSS, Chicago, Ill). All data were analyzed by one-way analysis of variance followed by Student-Newman-Kuels post hoc test for multiple comparisons. P < .05 was considered the threshold for statistical significance between the control group and the experimental groups. RESULTS Thapsigargin-evoked Ca2+ influx but not Ca2+ release stimulates ROS production In RAW264.7 cells, the SERCA inhibitor thapsigargin depletes internal Ca2+ stores and subsequently activates CRAC channels. The intracellular [Ca2+ ]i in RAW264.7 cells was determined fluorometrically with the calcium indicator Fluo3/AM as described previously. The upper panel in Figure 1(a) depicts RAW264.7 cells preloaded with Fluo-3/AM, and the lower panel shows typical Ca2+ responses obtained after stimulation with thapsigargin (2 μM). In the absence of external Ca2+ , thapsigargin triggered Ca2+ release from the internal stores, and the Ca2+ signal decayed back to prestimulation levels over several minutes. In the presence of external Ca2+ , however, the Ca2+ signal was sustained. Dimethyl sulphoxide (DMSO) used as the thapsigargin vehicle did not produce any significant [Ca2+ ]i change (Figure 1(b)). To test the relationship between Ca2+ influx through CRAC channels and ROS production, we measured ROS formation at different times after stimulation with thapsigargin in the presence and absence of external Ca2+ . The results are shown in Figures 2(a), 2(b). The addition of thapsigargin into the culture medium induced an elevation in ROS at 1 minute, which reached maximal levels within 10 minutes and returned to basal levels in 20 minutes. Thapsigargin stimulated
Sheng-Wei Jin et al
3
Fluorescence/baseline
2.5 2 1.5 1 0.5 0 0
50
100
150 200 Time (s)
250
TG + Ca2+ TG + Ca2+ free Vehicle + Ca2+ (b)
(a)
Figure 1: Thapsigargin induced an elevation of [Ca2+ ]i in RAW264.7 cells. (a) The upper panel is an image of resting RAW264.7 cells loaded with Fluo-3/AM, and the lower panel shows typical Ca2+ responses obtained after stimulation with thapsigargin (2 μM) in the presence of external Ca2+ . (b) Intracellular Ca2+ signals to thapsigargin in the absence and presence of external Ca2+ . Figure 1(b) is representative of four experiments performed on different experimental days. TG: thapsigargin.
ROS production in a dose-dependent manner (Figures 2(c), 2(d)), direct voltage-gated Ca2+ channel blockade nifedipine did not suppress the ROS production (Figure 2(d)). No increase in ROS formation could be detected in the 10 minutes following stimulation with thapsigargin in a Ca2+ -free solution (Figure 2(a)). The CRAC channels inhibitors 2-Aminoethoxydiphenylborate (2-APB) and Gd3+ block thapsigargin-dependent stimulation of ROS production 20 μM 2-APB completely suppressed the Ca2+ entry signal evoked by 2 μM thapsigargin (Figure 3(a)). 2-APB also prevented the ability of thapsigargin to release ROS (Figure 3(b)). Similar findings were obtained with 10 μM Gd3+ (Figure 3(b)). LPS stimulates Ca2+ entry and [Ca2+ ]i increase through CRAC channels The addition of LPS (2 μg/mL) into the culture medium induced an elevation in [Ca2+ ]i which reached maximal levels within 90 seconds and slowly returned to basal levels. However, the Ca2+ signal was sustained with 10 μg/mL LPS (Figure 4(a)). Thapsigargin (1 μM) produced a slow [Ca2+ ]i increase, followed by a return to basal levels. After thapsigargin treatment, the effect of LPS (10 μg/mL) on [Ca2+ ]i increase was completely abolished (Figure 4(b)). The rate of Ca2+ entry (measured following readmission of external Ca2+ ) was significantly slower when CRAC channel blocker 2-APB (20 μM) was applied (Figures 4(c), 4(d)). LPS-evoked Ca2+ influx stimulates ROS production The addition of LPS (10 μg/mL) into the culture medium increased ROS production which reached maximal levels
within 20 minutes and slowly returned to basal levels in 16 hours (Figures 5(a), 5(b)). At 20 minutes, the stimulation of ROS production with LPS (10 μg/mL) was suppressed in the absence of external Ca2+ , or when pretreated with 20 μM 2APB (Figures 5(a), 5(b)). Effect of FCCP and antimycin on thapsigargin and LPS-evoked generation of ROS To test whether ROS source was located in the mitochondria, we carried out a set of experiments in which macrophages were incubated in the presence of the mitochondrial uncoupler carbonyl cyanide p-trifluoromethoxy-phenylhydrazone (FCCP) and/or the inhibitor antymicin. When the FCCP (1 mM) was added to the cells, a significant increase in ROS production was observed. In the presence of FCCP, stimulation of cells with 2 μM TG or 10 μg/mL LPS failed to induce further increases in ROS level (Figure 6(a)). We further characterized the origin of ROS within the mitochondria, and performed a series of experiments by incubation of macrophages in the presence of the electron transport chain inhibitor antimycin. Treatment of cells with 5 mM antimycin led to a significant increase in ROS generation. In the presence of the mitochondrial inhibitor, stimulation of cells with 10 μg/mL LPS failed to evoke further increases in ROS production. A similar result was obtained when the cells were challenged with TG (2 μM) in the presence of the inhibitor (Figure 6(b)). DISCUSSION The measurement of [Ca2+ ]i in RAW264.7 cells has provided evidence that LPS stimulates the entry of extracellular Ca2+ . Support for an increased entry of extracellular Ca2+ via CRAC channels was obtained from three sources. Firstly,
Mediators of Inflammation
Counts
4 100
100
100
100
100
100
80
80
80
80
80
80
60
60
60
60
60
60
40
40
40
40
40
13.03% M2
20 0
M1
100
23.06% M2
20
M1
0
101 102
103
104 100
101
0 min
102
103
37%
20 0
104 100
M2 M1 102
103
104 100
10 min
102 103
104
100
6.82% M2
20
M1
0
101
40
9.11% M2
20
M1
0
101
1 min
12.38% M2
20
M1
0
101
20 min
102
103
104 100
101 Ca2+
30 min
102
103
104
free (10 min)
��
50 45 40 35 30 25 20 15 10 5 0
Counts
0 min
Percentage of positive cells (%)
Percentage of positive cells (%)
(a)
10 min 20 min 30 min Ca2+ free (b)
��
80 70 60 50 40 30 20 10 0
��
�
0 μM
1 μM
2 μM
3 μM
4 μM
(c)
200
200
200
200
200
200
160
160
160
160
160
160
120
120
120
120
120
120
80
80
80
80
80
40
M1
7.92% M2
15.88% M2
40
M1
0
101
102
103
104 100
101
0 μM
28.59% M2
M1
40
M1
0
0
100
40
102
0
103 104 100 101
1 μM
34.16% M2
102 103
40
M1
64.18% M2
0
104 100
101
2 μM
102
103
104 100
101
3 μM
102 4 μM
103
80
M1 40
28.87% M2
0
104 100
101
102
103
104
nifedipine (2 μM)
(d)
Percentage of positive cells (%)
Fluorescence/baseline
Figure 2: Thapsigargin stimulated ROS production. (a), (b) Flow cytometry profiles showing the time course of ROS production following stimulation with thapsigargin. RAW246.7 cells were subjected to thapsigargin (2 μM). ROS were measured by a flow cytometry. ROS production was suppressed in the absence of external Ca2+ over 10 minutes. (c), (d) Thapsigargin increased the production of ROS in a dose-dependent manner in the presence of external Ca2+ (at 10 minutes). Three independent experiments have been performed. � P < .05 versus control group; �� P < .01 versus control group.
Calcium
2 1.8 1.6 1.4 1.2 1 0.8 0.6 0.4 0.2 0 0
50
100
150 200 Time (s)
250
��
50 45 40 35 30 25 20 15 10 5 0 Basal
TG
TG + 2-APB TG + Gd3+
TG TG + 2-APB (a)
(b)
Figure 3: CRAC channel blockers prevented thapsigargin-evoked ROS production. (a) 2-APB suppressed the Ca2+ signal induced upon readmission of external Ca2+ . The cells were pretreated for 8 minutes with thapsigargin (2 μM) in Ca2+ -free solution, 20 μM 2-APB was added just 2 minutes before the readmission of the Ca2+ as indicated. Figure 3(a) is representative of three experiments performed on different experimental days. (b) 2-APB and Gd3+ inhibited the ability of thapsigargin (2 μM) to stimulate ROS production in the presence of external Ca2+ . Three independent experiments have been performed. TG: thapsigargin. �� P < .01 versus control group.
Sheng-Wei Jin et al
5
2.5 Fluorescence/baseline
Fluorescence/baseline
3
2 1.5 1 0.5 0 0
50
100
150 200 Time (s)
2 1.8 1.6 1.4 1.2 1 0.8 0.6 0.4 0.2 0
250
TG
0
LPS
50
100
150 200 Time (s)
250
LPS10 μg/mL LPS2 μg/mL (b)
(a)
Fluorescence/baseline
Normalized rate of calcium entry (%)
Calcium
3 2.5 2 1.5 1 0.5 0 0
50
100
150 200 Time (s)
250
120 100 80 60 40
��
20 0
Control
2-APB
LPS 2-APB + LPS (c)
(d)
Figure 4: LPS stimulated Ca2+ entry and [Ca2+ ]i increase through CRAC channels. (a) LPS induced an elevation in calcium in RAW264.7 cells in the presence of external calcium. (b) After 3 minutes of 1 μM thapsigargin treatment, the effect of LPS (10 μg/mL) on [Ca2+ ]i increase was completely abolished. (c) 20 μM 2-APB suppressed the Ca2+ signal induced upon readmission of external Ca2+ to cells pretreated for 8 minutes with LPS (2 μg/mL) in Ca2+ -free solution. 2-APB was added just 2 minutes before the readmission of the Ca2+ . (d) The summarized aggregate data compares the effects of the control and 2-APB on the initial rate of Ca2+ entry following readmission of the Ca2+ to cells with stores depleted by LPS. The rate of Ca2+ influx was obtained by measuring the initial slope of the Ca2+ rise following readmission of Ca2+ to cells with depleted stores. 2-APB was added just 2 minutes before the readmission of the Ca2+ . Three independent experiments have been performed. Figures 4(a), 4(b), 4(c) are representative of at least three experiments performed on different experimental days. �� P < .01 versus control group.
under the conditions imposed by the experiment, both LPS and thapsigargin induced an increase in intracellular [Ca2+ ]i , either in the presence or absence of Ca2+ in the extracellular medium. However, in the presence of external Ca2+ , the Ca2+ signal was sustained, and in the absence of external Ca2+ , thapsigargin only initiate a mild and less sustained rise in [Ca2+ ]i . Similar results were found in the LPS group. Our results indicated that the main source of increased intracellular Ca2+ was indeed extracellular. Secondly, the effect of LPS on [Ca2+ ]i increase was completely abolished by pretreatment with thapsigargin indicating that LPS triggered the entry of extracellular Ca2+ via depleting sarco/endoplasmic reticulum Ca2+ stores. This subsequently activated CRAC channels just as did thapsigargin. Thirdly, the CRAC channel inhibitor, 2APB, completely suppressed the Ca2+ entry signal evoked by thapsigargin, and suppressed approximately 93% of the Ca2+
entry signal evoked by LPS. This shows that other Ca2+ channels also open when induced by LPS, but contribute little to the overall Ca2+ signal. 2-APB inhibited ICRAC and storeoperated entry in the mutant DT40 cell line in which InsP3 receptors are not expressed [14]. Hence, InsP3 receptors are not required for 2-APB block of store-operated entry. 2-APB is becoming a popular tool to probe functional consequences of inhibiting store-operated entry, because it seems to block CRAC channels directly and rapidly, most likely on an external site [14, 15]. The trivalent cation, Gd3+ , which fully blocks the channels in the low micromolar concentration range [16], is often used to separate endogenous CRAC channels from recombinant transient receptor potentials (TRP’s) [17]. ROS are a molecular group that can be produced in the course of different physiological processes and react with a
6
Mediators of Inflammation 100
100
100
100
100
80
80
80
80
80
60
60
60
60
60
40
40
40
5.71% M2
M1 20 0 100
28.87% M2
M1 20
M1 20
0
101
102
103
104 100
0 min
16.78% M2
40
0
101
102
103
104 100
101
20 min
102
103
4.99% M2
M1 20 0
40
10.52% M2
M1
11.16% M2
M1 20 0
104 100
101
6h
102
103 104 100
16 h
101 102 103 LPS + 2-APB (20 min)
104 100
101 102 103 LPS + Ca2+ free (20 min)
104
��
35 30 25 20 15 10 5 0
16 h LP S (2 + 2 0 m -A LP in PB S ) (2 + C 0 m a 2+ in fre ) e
in m 20
0m
6h
��
in
Percentage of positive cells (%)
(a)
(b)
��
20 10 0 LP
S
TG im yc in
+
+ An t
(a)
An t
FCCP + TG FCCP + LPS
��
30
ro l
FCCP
��
40
Co nt
Control
��
50
im yc in
��
im yc in
��
An t
50 45 40 35 30 25 20 15 10 5 0
Percentage of positive cells (%)
Percentage of positive cells (%)
Figure 5: LPS-evoked Ca2+ influx stimulated ROS production. (a) Flow cytometry profiles showing the time course of ROS production following stimulation with LPS (10 μg/mL) in the presence of external Ca2+ . Stimulation of ROS production with LPS (10 μg/mL) at 20 minutes was suppressed in the absence of external Ca2+ or when pretreated with 2-APB (20 μM) in the absence of external Ca2+ . Figure 5(a) is representative of three experiments performed on different experimental days. (b) Aggregate data are summarized. TG: thapsigargin. �� P < .01 versus control group.
(b)
Figure 6: (a) Effect of mitochondrial uncoupler carbonyl cyanide p-trifluoromethoxy-phenylhydrazone (FCCP) on thapsigargin and LPSevoked generation of ROS. When the FCCP (1 mM) was added to the cells, a significant increase in ROS production was observed at 10 minutes. In the presence of FCCP, stimulation of cells with 2 μM TG or 10 μg/mL LPS failed to induce further increases in ROS level. (b) Effect of antimycin on thapsigargin and LPS-evoked generation of ROS. Treatment of cells with 5 mM antimycin led to a significant increase in ROS generation at 10 minutes. In the presence of the antimycin, stimulation of cells with 10 μg/mL LPS failed to evoke further increases in ROS production. A similar result was obtained when the cells were challenged with TG (2 μM) in the presence of the antimycin. Three independent experiments have been performed. TG: thapsigargin. �� P < .01 versus control group.
large variety of oxidizable cellular components [18]. Therefore, reduction-oxidation reactions involving ROS have gained attention as important chemical processes with implications in cellular signal transduction, especially those involving macrophages. Under our experimental conditions,
in the presence of extracellular Ca2+ , both thapsigargin and LPS induced an increase in ROS generation in a dosedependent manner. However, the effects were completely abolished in the absence of extracellular Ca2+ , demonstrating that ROS production is activated by Ca2+ influx, but
Sheng-Wei Jin et al not by Ca2+ release from the stores, despite reasonable overall increases in cytosolic Ca2+ concentration. The results of many investigations have shown that calcium is essential for production of ROS. Elevation of intracellular calcium level is responsible for activation of ROS-generating enzymes and formation of free radicals by the mitochondria respiratory chain. Cytosolic Ca2+ is also an important regulator of NADPH oxidase activation leading to the generation of ROS, and ROS production is largely dependent on [Ca2+ ]i mobilization. The mechanism of cytosolic Ca2+ activation NADPH oxidase involves PKC, phospholipase A2 , and Rac pathways [19]. Next, we designed experiments to identify the nature of the Ca2+ entry pathway that drives ROS production. If Ca2+ entry through CRAC channels stimulates ROS release, then one would expect inhibitors of CRAC channels to suppress this release. We tested this by using the CRAC channel blockers 2-APB and Gd3+ . Our results showed that CRAC channel blockers completely suppressed the Ca2+ entry signal and also prevented the ability of ROS production evoked both by thapsigargin and LPS, demonstrating that Ca2+ entry through CRAC channels stimulates ROS release. Furthermore, the ROS release in macrophages did not require voltage-gated Ca2+ influx, as direct voltage-gated Ca2+ channel blockade with nifedipine, did not suppress the ROS production in our experiments. All these findings indicate that ROS production is the downstream consequence of CRAC channel activation and close functional coupling between CRAC and ROS production in murine macrophages. In our experiments, both thapsigargin and LPS induced an elevation in ROS at 1 minute. However, thapsigargin induced an elevation in ROS which reached maximal levels within 10 minutes and returned to basal levels in 20 minutes, while it reached maximal levels within 20 minutes and was still higher in 6 hours in the LPS group. The experiment shows that thapsigargin, a CRAC agonist, evoked a transient rise in ROS, indicating that Ca2+ entry through CRAC is a trigger for ROS production. Sustained production of ROS needs activation of signaling cascades following stimulation of LPS. In concordance with these results, thapsigargin triggered Ca2+ release from the internal stores, and the Ca2+ signal decayed back to prestimulation levels over several minutes (Figure 1(b)), however, the Ca2+ signal was sustained with 10 μg/mL LPS (Figure 4(a)), these data clearly showed that the different time scale in ROS formation depends on different Ca2+ signal induced by thapsigargin and LPS. Ca2+ -dependent release of ROS suggests a dominant role for the ROS generation enzyme that depended on Ca2+ in our experiments, so it was of interest to analyze the intracellular source of ROS. Mitochondria are probably the most important source of increased free radical production. These organelles accumulate large amounts of Ca2+ that can lead to the generation of ROS, being the basis of excitotoxicity injury mechanisms [20]. In the present study, we showed that the mitochondrial uncoupler, carbonyl cyanide p-trifluoromethoxy-phenylhydrazone, and the inhibitor of the electron transport chain, antimycin, evoked a marked increase in ROS and completely inhibited thapsigargin and
7 LPS-evoked responses. These results are consistent with previous reports in mouse pancreatic acinar cells [21]. Taken together, these data suggest that ROS evoked by thapsigargin and LPS are generated mainly in the mitochondria. ACKNOWLEDGMENTS The authors thank Zhihui Liang for the operation of flow cytometry, and Jiahua Zhang for the operation of confocal laser scanning microscopy. The authors gratefully acknowledge Dr F. Gao Smith, Dr Shihai Zhang, and Cunningham Collin for critical comments. This project is supported by the National Natural Science Foundation of China (no 30200704, no 30570726). REFERENCES [1] Parekh AB, Putney JW Jr. Store-operated calcium channels. Physiological Reviews. 2005;85(2):757–810. [2] Semenova SB, Kiselev KI, Mozhaeva GN. Low-conductivity calcium channels in the macrophage plasma membrane: activation by inositol-1,4,5-triphosphate. Neuroscience and Behavioral Physiology. 1999;29(3):339–345. [3] Hoth M, Button DC, Lewis RS. Mitochondrial control of calcium-channel gating: a mechanism for sustained signaling and transcriptional activation in T lymphocytes. Proceedings of the National Academy of Sciences of the United States of America. 2000;97(19):10607–10612. [4] Chang W-C, Parekh AB. Close functional coupling between Ca2+ release-activated Ca2+ channels, arachidonic acid release, and leukotriene C4 secretion. Journal of Biological Chemistry. 2004;279(29):29994–29999. [5] Feske S, Giltnane J, Dolmetsch R, Staudt LM, Rao A. Gene regulation mediated by calcium signals in T lymphocytes. Nature Immunology. 2001;2(4):316–324. [6] Parekh AB. Calcium signaling and acute pancreatitis: specific response to a promiscuous messenger. Proceedings of the National Academy of Sciences of the United States of America. 2000;97(24):12933–12934. [7] Putney JW Jr. Presenilins, Alzheimer’s disease, and capacitative calcium entry. Neuron. 2000;27(3):411–412. [8] Lee C, Xu D-Z, Feketeova E, et al. Store-operated calcium channel inhibition attenuates neutrophil function and postshock acute lung injury. Journal of Trauma: Injury, Infection and Critical Care. 2005;59(1):56–63. [9] Lambeth JD. NOX enzymes and the biology of reactive oxygen. Nature Reviews Immunology. 2004;4(3):181–189. [10] Myers JT, Swanson JA. Calcium spikes in activated macrophages during Fcγ receptor-mediated phagocytosis. Journal of Leukocyte Biology. 2002;72(4):677–684. [11] Hsuan SL, Kannan MS, Jeyaseelan S, Prakash YS, Sieck GC, Maheswaran SK. Pasteurella haemolytica A1-derived leukotoxin and endotoxin induce intracellular calcium elevation in bovine alveolar macrophages by different signaling pathways. Infection and Immunity. 1998;66(6):2836–2844. [12] Mustafa SB, Olson MS. Effects of calcium channel antagonists on LPS-induced hepatic iNOS expression. American Journal of Physiology: Gastrointestinal and Liver Physiology. 1999;277(2):G351–G360. [13] Molinuevo MS, Etcheverry SB, Cortizo AM. Macrophage activation by a vanadyl-aspirin complex is dependent on L-type calcium channel and the generation of nitric oxide. Toxicology. 2005;210(2-3):205–212.
8 [14] Prakriya M, Lewis RS. Potentiation and inhibition of Ca2+ release-activated Ca2+ channels by 2-aminoethyldiphenyl borate (2-APB) occurs independently of IP3 receptors. Journal of Physiology. 2001;536(1):3–19. [15] Broad LM, Braun F-J, Lievremont J-P, Bird GSJ, Kurosaki T, Putney JW Jr. Role of the phospholipase C-inositol 1,4,5trisphosphate pathway in calcium release-activated calcium current and capacitative calcium entry. Journal of Biological Chemistry. 2001;276(19):15945–15952. [16] Hoth M, Penner R. Calcium release-activated calcium current in rat mast cells. Journal of Physiology. 1993;465(1):359–386. [17] Trebak M, Bird GSJ, McKay RR, Putney JW Jr. Comparison of human TRPC3 channels in receptor-activated and storeoperated modes. Differential sensitivity to channel blockers suggests fundamental differences in channel composition. Journal of Biological Chemistry. 2002;277(24):21617–21623. [18] Hensley K, Robinson KA, Gabbita SP, Salsman S, Floyd RA. Reactive oxygen species, cell signaling, and cell injury. Free Radical Biology and Medicine. 2000;28(10):1456–1462. [19] Lambeth JD. NOX enzymes and the biology of reactive oxygen. Nature Reviews Immunology. 2004;4(3):181–189. [20] Jacobson J, Duchen MR. Mitochondrial oxidative stress and cell death in astrocytes—requirement for stored Ca2+ and sustained opening of the permeability transition pore. Journal of Cell Science. 2002;115(6):1175–1188. [21] Granados MP, Salido GM, Pariente JA, Gonz´alez A. Generation of ROS in response to CCK-8 stimulation in mouse pancreatic acinar cells. Mitochondrion. 2004;3(5):285–296.
Mediators of Inflammation