Available online at www.sciencedirect.com
ScienceDirect Procedia Technology 12 (2014) 246 – 254
The 7th International Conference Interdisciplinarity in Engineering (INTER-ENG 2013)
Clustering software components for program restructuring and component reuse using hybrid XNOR similarity function Chintakindi Srinivasa,Vangipuram Radhakrishnab,*, C.V. Guru Raoc a Associate Professor of CSE, Kakatiya Institute of Technology and Science, Warangal, INDIA Department of Information Technology, VNR Vignana Jyothi Institute of Engineering and Technology, Hyderabad, INDIA c Professor of Computer Science and Engineering, SR Engineering College,Warangal, INDIA
b
Abstract Component based software development has gained a lot of practical importance in the field of software engineering from academic researchers and also from industry perspective. Finding components for efficient software reuse is one of the important problems aimed by researchers. Clustering reduces the search space of components by grouping similar entities together thus ensuring reduced time complexity as it reduces the search time for component retrieval. In this research, we instigate a generalized approach for clustering a given set of documents or software components by defining a similarity function called hybrid XNOR function to find degree of similarity between two document sets or software components. A similarity matrix is obtained for a given set of documents or components by applying hybrid XNOR function. We define and design the algorithm for component or document clustering which has the input as similarity matrix and output being set of clusters. The output is a set of highly cohesive pattern groups or components. © 2013 The Authors. Published by Elsevier B.V. © 2013 The Authors. Published by Elsevier Ltd. Selection and peer-review under responsibility of Department of Electrical and Computer Engineering, Faculty of Selection and peer-review under responsibility of the Petru Maior University of Tirgu Mures.
Engineering, “Petru Maior” University of Tîrgu Mureș
Keywords : clustering; similarity; frequent item; mining; classification; component.
1. Introduction The Universality and Ubiquitous nature of the internet made the possibility to access a huge amount of virtual unlimited information in the digital text format by the humans. This gave a new definition for data mining creating new possibilities for mining text information.
* Corresponding author. Tel.: +9700684242. E-mail address:
[email protected]
2212-0173 © 2013 The Authors. Published by Elsevier Ltd. Selection and peer-review under responsibility of the Petru Maior University of Tirgu Mures. doi:10.1016/j.protcy.2013.12.482
247
Chintakindi Srinivas et al. / Procedia Technology 12 (2014) 246 – 254
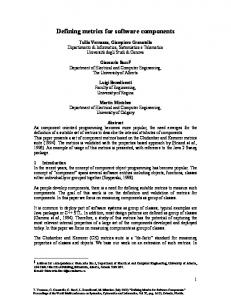
Collections of patterns such as software components or text files or images
Clustering Algorithm
Partitions or Clusters
Fig. 1. abstract view of clustering process
Consequently the text oriented derivation of data mining called as text mining has been gaining a lot of practical significance as the available data grows at higher rate than can be perceived or handled by the humans. In this context the problem of clustering is one topic that gained more practical importance from the researchers and more specifically from the perspective of the software industry. The abstract view of clustering process is shown in Fig. 1. The requirement for clustering comes from the need for decision making such as software component classification and component clustering, user behavior prediction, performing software component search and in component retrieval from software library. Clustering is also widely used in many practical domains such as text classification, bioinformatics, medicine, image processing to name a few. Clustering may be defined as the process of grouping similar set of patterns together [1]. The input to clustering algorithm usually may be any set of entities or patterns or text files or images or software components. The output of clustering algorithm will be a partition of cohesive groups. The descriptions or representations of clusters may be used for decision making in selecting a software component or pattern of interest. One interesting property of clustering is all the patterns within a cluster share common properties in some sense and patterns in different clusters are dissimilar. From perspective of software engineering, all the components within same cluster have high cohesion and low coupling. Software component clusters can be treated as highly cohesive groups with low coupling which is the desired feature. One disadvantage of existing data clustering methods is that they do not adequately address the problem of processing large datasets with a limited amount of resources. Using these limitations as our motivation, so if we can try to reduce the dataset for training process it can help in reducing the cost of training which in turn improves efficiency of clustering. If done so, clustering takes less amount of space and hence forms a compact storage of patterns. Clustering is not any one specific algorithm that we can stick firm to, but it must be viewed as the general task to be solved. Clustering algorithms may unsupervised or supervised [1]. In unsupervised clustering the partitions are viewed as the unlabelled patterns or components. Supervised clustering algorithms label the patterns which can be used to classify the components for decision making. Hence the partitions obtained by clustering process may be labeled or unlabeled. A new method called Maximum Capturing is proposed for document clustering [4].Maximum Capturing includes two procedures:1.Constructing document clusters and 2. Assigning cluster topics. The search complexity can be reduced by using the algorithm [11] where ever necessary as part of component retrieval.
2. Taxonomy The problem of finding frequent itemsets is first initiated from [9] which uses frequent items to find association rules in large transactional databases. In [2] clustering a given set of text documents from neighbour set is proposed. In [3] the authors propose a method for discovering maximum length frequent item sets. In [7], the classification of text files or documents is done by considering Gaussian membership function and making use of it to obtain clusters by finding word patterns. Each cluster is identified by its word pattern calculated using fuzzy based Gaussian membership function once clusters are formed. In this paper the idea is to first obtain frequent item sets for each document using existing association rule mining algorithms either by horizontal or vertical approach. Once we find frequent itemsets in each document then we form a Boolean matrix with rows indicating documents and columns indicating unique frequent items from each document. This is followed by the computation of a ternary feature vector for each document pair, represented as a 2D array or 2D matrix by redefining the XNOR function as hybrid XNOR logic with slight modification in the
248
Chintakindi Srinivas et al. / Procedia Technology 12 (2014) 246 – 254
function introducing high impedance variable as Z. The idea of maximum capturing is taken as the base framework for clustering [4]. The authors perform clustering using XOR similarity function [15].
3. Proposed Work To design a clustering algorithm we must first design the similarity function which is the heart of any clustering algorithm. We define a generalized similarity function called Hybrid XNOR function which may be used to compute similarity feature between any pair of entities which may be software components or software patterns or documents. The documents may be text files to be classified or software product documents or code fragments. We define the similarity function S as a function of any two entities A and B which is a tri state function as shown below in the truth Table 1. Table 1. Truth Table of hybrid XNOR Similarity Function A
B
S(A,B)
0 0
0 1
Z 0
1
0
0
1
1
1
The algorithm for document clustering has its input as documents with frequent item sets and output as set of clusters formed dynamically. The approach followed is a tabular approach. Similarly the algorithm for component clustering has its input as software components with properties predefined and the output is a set of highly cohesive components with low coupling feature. 3.1 Algorithm for Clustering It may be used for software component clustering, document clustering or pattern clustering in general Algorithm. Algorithm for Clustering. Input: Document set, frequent items. Output: set of clusters. Begin of Algorithm Step1: For each document D do Begin Step1.1 Remove stop words and stemming words from each document. Step1.2
Find unique words in each document and count of the same.
Step1.3
Find frequent itemsets of each document
End for Step 2: Form a word set W consisting of each word in frequent item sets of each document. Step 3: Form Dependency Boolean Matrix with each row and column corresponding to each Document and each word respectively For each document in document set do Begin
Chintakindi Srinivas et al. / Procedia Technology 12 (2014) 246 – 254
249
For each word in word set do Begin If (word wk in Word set W is in document Di) Begin Set D[Di, wk] = 1 Else Set D[Di, wk] = 0 End if End for End for Step 4: Find the Feature vector similarity matrix by evaluating similarity value for each document pair applying Hybrid XNOR Function defined in table 1 to obtain the matrix with feature vectors for each document pair. Step 5: Replace the corresponding cells of matrix by count of number of zeroes in tri state feature vector. Step 6: At each step, find the cell with maximum value and document pairs containing this value in the matrix. Group such document pairs to form clusters. Also if document pair (X,Y) is in one cluster and document pair (Y, Z) is in another cluster, form a new cluster containing (X, Y, Z) as its elements. Step 7: Repeat Step6 until no documents exist or we reach the stage of first minimum value leaving zero entry. Step 8: Output the set of clusters obtained. Step 9: Label the clusters by considering candidate entries. End of algorithm
3.2 Case Study Consider the document sets with the frequent item sets obtained after mining using any of the existing association rule mining algorithms as shown below. Here we use can also use association rule mining algorithm with multiple support and confidence thresholds. We consider a set of random set of 9 documents as the training set for the below example. Table 2. Documents and Corresponding Frequent item sets DOCUMENTS
FREQUENT ITEMSETS
DOCUMENT 1
{ TESTING, TRAINING, CLUSTER}
DOCUMENT 2 DOCUMENT 3 DOCUMENT 4 DOCUMENT 5 DOCUMENT 6 DOCUMENT 7 DOCUMENT 8 DOCUMENT 9
{SVM , MINING, CLUSTER} { SVM, TRAINING, MINING,
CLUSTER}
{TESTING, TRAINING, MINING,
CLUSTER}
{SVM , CLUSTER} {TESTING,
TRAINING, MINING}
{TESTING, SVM, TRAINING} {SVM, TRAINING} {TRAINING, MINING,
CLUSTER}
We now construct a Boolean matrix with rows indicating each document and column corresponding to each unique frequent item from set of frequent item sets of all documents sets respectively.
250
Chintakindi Srinivas et al. / Procedia Technology 12 (2014) 246 – 254 Table 3. Boolean matrix Representation of Table.2
D1 D2 D3 D4 D5 D6 D7 D8 D9
TESTING
TRAINING
CLUSTER
SVM
MINING
1 0 0 1 0 1 1 0 0
1 0 1 1 0 1 1 1 1
1 1 1 1 1 0 0 0 1
0 1 1 0 1 0 1 1 0
0 1 1 1 0 1 0 0 1
We form a matrix D [n-1, n] for n documents and consider only the upper triangular region. The cells of the matrix are filled by applying the similarity function S for which each document pair forms the input as shown below Table 4. Feature Vector Representation of document set D1
D2
D3
D4
D5
D6
D7
D8
D9
D1
x
{0,0,1,0,0} = 1
{0,1,1,0,0}=2
{1,1,1,Z,0}=3
{0,0,1,0,Z}=1
{1,1,0,Z,0}=2
{1,1,0,0,Z}=2
{0,1,0,0,Z}=1
{0,1,1,Z,0}=2
D2
x
x
{Z,0,1,1,1}=3
{0,0,1,0,1 }=2
{Z,Z,1,1,0}=2
{0,0,0,0,1}=1
{0,0,0,1,0}=1
{Z,0,0,1,0}=1
{Z,0,1,0,1}=2
D3
x
x
x
{0,1,1,0,1}=3
{Z,0,1,1,0}=2
{0,1,0,0,1}=2
{0,1,0,1,0}=2
{Z,1,0,1,0}=2
{Z,1,1,0,1}=3
D4
x
x
x
x
{0,0,1,0,0}=1
{1,1,0,1,1,}=4
{1,1,0,0,0 }=2
{ 0,1,0,0,0}=1
{ 0,1,1,Z,1}=3
D5
x
x
x
x
x
{0,0,0,0,0}=0
{0,0,0,1,Z}=1
{Z,0,0,1,Z}=1
{Z,0,1,0,0}=1
D6
x
x
x
x
x
x
{1,1,Z,0,0}=2
{0,1,Z,0,0}=1
{0,1,0,Z,1}=2
D7
x
x
x
x
x
x
x
{0,1,Z,1,Z}=2
{0,1,0,0,0}=1
D8
x
x
x
x
x
x
x
x
{Z,1,0,0,0}=1
Once we obtain the above table with feature vectors for each document pair then we replace the corresponding cells of matrix by count of number of zeroes in tri state feature vector. We call it tri-state because it can have 0 or 1 or z as the value. This is shown in the table below. Table 5. Similarity Matrix with Feature Vector Replaced by Count of 0s. D1 x x x x x x x x
D1 D2 D3 D4 D5 D6 D7 D8
D2 1 x x x x x x x
D3 2 3 x x x x x x
D4 3 2 3 x x x x x
D5 1 2 2 1 x x x x
D6 2 1 2 4 0 x x x
D7 2 1 2 2 1 2 x x
D8 1 1 2 1 1 1 2 x
D9 2 2 3 3 1 2 1 1
Now consider only the element of the matrix with the highest value as shown in the table below. The step by step procedure is shown below in the form of tables which is self explanatory. Step1: find the first maximum value from the matrix and target only those cells having this value to form initial cluster. Table 6. Content of Similarity Matrix showing step1 D1 D2 D3 D4 D5 D6 D7 D8
D1 x x x x x x x x
D2 1 x x x x x x x
D3 2 3 x x x x x x
D4 3 2 3 x x x x x
D5 1 2 2 1 x x x x
D6 2 1 2 4 0 x x x
D7 2 1 2 2 1 2 x x
D8 1 1 2 1 1 1 2 x
D9 2 2 3 3 1 2 1 1
Find max value from the above table which is 4 here and target those cells as they form the best candidate solutions and replace those cell by x Stage1: (4, 6) have val as 4. So form cluster as (4, 6).
Chintakindi Srinivas et al. / Procedia Technology 12 (2014) 246 – 254
Step 2: Find the next max value from the above table which is 3 here and target those cells as they form the best candidate solutions. Now cluster {4, 6} is dynamically changed to {1, 2, 3, 4, 6, 9} and is no more a separate cluster as shown in table.2. Table 7. Content of Similarity Matrix showing step2 D1 x x x x x x x x
D1 D2 D3 D4 D5 D6 D7 D8
D2 1 x x x x x x x
D3 2 3 x x x x x x
D4 3 2 3 x x x x x
D5 1 2 2 1 x x x x
D6 2 1 2 X 0 x x x
D7 2 1 2 2 1 2 x x
D8 1 1 2 1 1 1 2 x
D9 2 2 3 3 1 2 1 1
Find the next max value from the above table which is 3 here and target those cells as they form the best candidate solutions. Stage2: consider only un-clustered document set {1, 2, 3, 5, 7, 8, 9} ad search for value 3 in corresponding columns. (1,4)-(2,3)-(3,4)-(3,9) : So form cluster {1,2,3,4,9} as new Cluster. Set the values as zero or x. Cluster 1: {1, 2, 3, 4, 6, 9} After Merging
Step 3: Find the next max value from the above table which is 2 here and target those cells as they form the best candidate solutions. Table 8. Content of Similarity Matrix showing step3 D1 D2 D3 D4 D5 D6 D7 D8
D1 x x x x x x x x
D2 1 x x x x x x x
D3 2 X x x x x x x
D4 X 2 X x x x x x
D5 1 2 2 1 x x x x
D6 2 1 2 X 0 x x x
D7 2 1 2 2 1 2 x x
D8 1 1 2 1 1 1 X x
D9 2 2 X X 1 2 1 1
Find the next max value from the above table which is 2 here and target those cells as they form the best candidate solutions. Stage3: consider only un-clustered document set {5, 7, 8} ad search for value 2 in corresponding columns. Here (7, 8) has 2. So form cluster {7, 8} as new Cluster. Set the values as zero or x. Cluster 2: {7, 8}
Step 4: Find the next max value from the above table which is 1 here and target those cells as they form the best candidate solutions. Table 9. Content of Similarity Matrix showing step4 D1 D2 D3 D4 D5 D6 D7 D8
D1 x x x x x x x x
D2 1 x x x x x x x
D3 2 X x x x x x x
D4 X 2 X x x x x x
D5 1 2 2 1 x x x x
D6 2 1 2 X 0 x x x
D7 2 1 2 2 1 2 x x
D8 1 1 2 1 1 1 X x
D9 2 2 X X 1 2 1 1
Stage4: consider only un-clustered document set {5} and search for value 1 in corresponding columns. Here (5, 7), (5, 8), (5, 9) are all 1s. But this is next minimum value after zero if we consider initial table values before clustering. Hence 5 can’t be similar to any of those documents and we must place it as a separate cluster {5}.
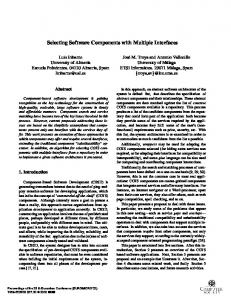
The Set of clusters finally formed are as shown in Fig. 2. Cluster-1: {1, 2, 3, 4, 6, 9} Cluster-2 :{ 7, 8} Cluster-3 :{ 5}
Cluster-1
Cluster-2
251
252
Chintakindi Srinivas et al. / Procedia Technology 12 (2014) 246 – 254
Cluster-3 Component-7
Component-3
Component-5
Component-4
Component-8
Component-9 Component-2
Component-6
Component-1
Fig. 2. Set of Clusters formed after applying the algorithm
4. Case Study for Software Component Clustering or Program Partitioning Consider the following program fragment: Procedure Sum_and_Prod (n: integer; arr: int_array; var sum, prod: integer; var avg: float) var i : integer; begin 1. sum = 0; 2. prod = 1; 3. for i = 1 to n do begin 4. sum = sum + arr[i]; 5. prod = prod * arr[i]; 6. end; 7. avg = sum / n; end; The Table 10 below shows the matrix with rows denoting line numbers or statements, columns denoting variable names.Si indicates ith line. Table 10. Boolean Matrix for program module
Line Numbers S1 S2 S4 S5 S7
Sum 1 0 1 0 1
Prod 0 1 0 1 0
N 0 0 0 0 1
Arr 0 0 1 1 0
Avg 0 0 0 0 1
The table below shows the similarity matrix formed using algorithm. The below list of tables show the step by step process of forming clusters and final output of clusters and are self descriptive. Table 11. Trace of algorithm for stage 1
S1 S2 S4 S5 S7
S1 X
S2 0 X
S4 1 0 X
S5 0 1 1 X
S7 1 0 1 0 X
Group S1 and S4 as (S1, S4) =1 and Mark as X. Mark Row elements of S4 by X. This is done to reduce overlapping of variables. So (S1, S4) forms one cluster.
Chintakindi Srinivas et al. / Procedia Technology 12 (2014) 246 – 254
253
Table 12. Trace of algorithm for stage 2
S1 S2 S4 S5 S7
S1 X
S2 0 X
S4 X 0 X
S5 0 1 X X
S7 1 0 X 0 X
Again we have (S1, S7) =1. So group S1 and S7 into one cluster and mark the cell as X. As already S7 row is marked no need to do so. Since (S1, S4) are similar and (S1, S7) are similar hence (S1, S4, S7) are all similar and placed into one cluster. i.e Cluster1 = {S1,S4,S7}
Table 13. Trace of algorithm for stage 3
S1 S2 S4 S5 S7
S1 X
S2 0 X
S4 X 0 X
S5 0 1 X X
S7 X 0 X 0 X
Finally we have (S2, S5) =1. So group S2 and S5 into one cluster and mark the corresponding cell as X. As already S5 row is marked no need to do so. i.e Cluster2 = {S2,S5}
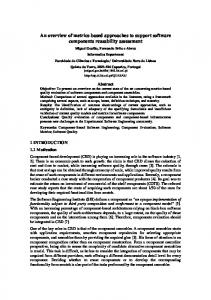
The program module may finally be separated into two individual cluster modules which may run independently or in parallel. Cluster1 1. sum = 0; 4. sum = sum + arr[i]; 7. avg = sum / n;
Cluster2 2. prod = 1; 5. prod= prod*arr[i];
Fig. 3. Program partitioning to run two modules in parallel
5. Conclusion In this paper we define a new similarity function to compute similarity between any two software components or text files. An algorithm to cluster a set of given documents or text files or software components is designed which uses the proposed similarity function called hybrid XNOR to find the degree of similarity among any two entities. The input to algorithm is a similarity matrix and the output is the set of clusters. In future, the approach can be extended to classify the components using classifiers by applying fuzzy logic. The concept of Support vector machines may be used for classification once clusters are formed. The search complexity can be reduced by using the algorithm [11] where ever necessary as part of component retrieval. Acknowledgements We are very much thankful to all the anonymous reviewers and mainly thankful to Sri Dr. C.V.GuruRao for his valuable suggestions and support throughout the work. References [1] Devi SV, Murthy NM. Text Book on Pattern Recognition. An Introduction. University Press. [2] Luo C, Li Y, Chung SM. Text document clustering based on neighbors , Data & Knowledge Engineering, 2009; 68: 1271–1288. [3] Tianming Hu,Sam Yuan Sung, Hui Xiong, Qian Fu. Discovery of maximum length frequent itemsets, Information Sciences, 2008; 178: 69– 87.
254
Chintakindi Srinivas et al. / Procedia Technology 12 (2014) 246 – 254
[4] Wen Zhanga,, Taketoshi Yoshida, Xijin Tang, Qing Wang. Text clustering using frequent itemsets, Knowledge-Based Systems, 2010; 23: 379–388 [5] Wen Zhanga,Taketoshi Yoshida, Xijin Tang. A comparative study of TF*IDF, LSI and multi-words for text classification. Expert Systems with Applications, 2011; 38: 2758–2765. [6] Labatut V, Cherifi H. Accuracy Measures for the Comparison of Classifiers, ICIT 2011 The 5th International Conference on Information Technology. [7] Jung-Yi Jiang et.al A Fuzzy Self-Constructing Feature Clustering Algorithm for Text Classification. IEEE Transactions on Knowledge and Data Engineering, 2011; 23(3). [8] Hajdinjak M, Bauer A. Similarity Measures for Relational Databases, Informatica, 2009; 33: 143–149. [9] Agrawal R, Imielinski T, Swami A. Mining association rules between sets of items in very large databases, Proceedings of the ACM SIGMOD Conference on Management of data,1993: 207–216. [10] Beil F, Ester M, Xu XW. Frequent term-based text clustering, in: Proceedings of the 8th ACM SIGKDD International Conference on Knowledge Discovery and Data Mining, 2002: 436–442. [11] Radhakrishna V, Srinivas C, Guru Rao CV. High Performance Pattern Search algorithm using three sliding windows , International Journal of Computer Engineering and Technology, 2012; 3: 543-552. [12] Susheela Devi V, Narasimha Murthy M. Text Book on Pattern Recognition. An Introduction. University Press. [13] Kebir S, Seriai AD, Chardigny S. Comparing and Combining Genetic and Cluster Algorithms for Software Component Identification, in the Proceedings of the ACM Fifth International Conference on Computer Science and Software Engineering, 2012: 1-8. [14] Veras RC, Meira SRL, Oliveira ALI, Melo BJM. Comparitive study of clustering techniques for the organisation of software repositories, in the proceedings of 19th IEEE International Conference on Tools with Artificial Intelligence. [15] Radhakrishna V, Srinivas C, Guru Rao CV. Document Clustering Using Hybrid XOR Similarity Function for Efficient Software Component Reuse. Procedia Computer Science, 2013; (17): 121-128.