ARTICLE IN PRESS
Energy Policy 32 (2004) 1981–1990
Co-provision in sustainable energy systems: the case of micro-generation$ Jim Watson* SPRU—Science and Technology Policy Research and Tyndall Centre for Climate Change Research, University of Sussex, Falmer, East Sussex BN1 9RF, UK
Abstract Electricity generation by individual households (known as micro-generation) is attracting an increasing amount of interest within government, industry and the research community. This paper focuses on the potential for micro-generation to contribute to a more active role for household energy consumers in the development and operation of the energy system. The paper applies the concept of energy service co-provision to aid an understanding of this more active role. It considers a number of alternative models for microgeneration investment that imply different kinds of co-provision by consumers and energy companies. The analysis focuses in particular on the economics of these models in the UK, the associated barriers to micro-generation investment, and the scope for overcoming these barriers through changes in fiscal rules. Having conducted this economic analysis, the paper concludes with a brief discussion of the wider implications of these models for consumer behaviour. In particular, it considers the impact of IT and control systems that might be employed to facilitate energy service co-provision that includes micro-generation. r 2004 Elsevier Ltd. All rights reserved. Keywords: Micro-generation; Co-provision; Electricity
1. Introduction Many of the world’s energy systems have been reshaped during the past decade. This reshaping process has included industrial restructuring, the development of competitive markets, an increasing emphasis on environmental impacts and rapid technical change. As a result of these trends, there has been an increasing emphasis on the development and deployment of distributed generation. One of the most radical implications of the expected growth in distributed generation during the next few years is the possibility of ‘micro-generation’ in individual homes (Watson, 2002a, 2003). If it catches on, micro-generation could fundamentally change the relationship between energy companies and consumers. By blurring the traditional boundary between energy supply and demand, micro-generation technologies $ This paper draws extensively on two conference papers (Watson, 2002a, 2003). The research presented in the paper was funded by the Tyndall Centre for Climate Change Research. *Corresponding author. Tel.: +44 1273 873539; fax: +44 1273 685865. E-mail address:
[email protected] (J. Watson).
0301-4215/$ - see front matter r 2004 Elsevier Ltd. All rights reserved. doi:10.1016/j.enpol.2004.03.010
present utilities, regulators, consumers and equipment suppliers with a new set of challenges (Magnussen et al., 2003). As a result, they could be highly disruptive for current energy systems (Adner, 2002; Fleetwood, 2001; Patterson, 1999). Due to its far-reaching implications, micro-generation and other aspects of energy system decentralisation has attracted an increasing amount of attention from governments and energy companies in recent years. The International Energy Agency’s recent review of this issue shows that policies are being developed in many countries to encourage renewable energy technologies and combined heat and power systems (IEA, 2002). To support these policies, work is also underway to rethink and reshape the way in which energy networks are structured and regulated. Alongside these government initiatives, some of the world’s largest energy companies have moved into distributed and micro-generation technologies. The most notable example is the decision by ABB, the Swiss–Swedish engineering giant, to abandon its roots in large–scale power generation to concentrate on decentralised sources such as wind power and micro turbines (Magnussen et al., 2003). Similarly, the world’s biggest
ARTICLE IN PRESS 1982
J. Watson / Energy Policy 32 (2004) 1981–1990
corporate takeover attempt—of Honeywell by General Electric in October 2000—resulted in the acquisition of Honeywell micro-turbine and fuel cell technologies by GE. In addition, two of the world’s largest oil companies—BP and Shell—are now amongst the world’s top five developers of solar photovoltaic technologies (Maycock, 2002). This paper focuses on one of the most important implications of micro-generation: the possibility that it will help to enable a more active role for household energy consumers in the development and operation of the energy system. To explore the nature and extent of this active role, the paper uses the concept of energy service co-provision (Chappells et al., 2000). It establishes a number of alternative models for microgeneration investment that imply different degrees of co-provision by consumers and energy companies. Having elaborated these models, the paper uses them to explore the economics of micro-generation investments in the UK, based on solar photovoltaic (PV) and domestic combined heat and power (micro-CHP) technologies. In its recent energy White Paper (DTI, 2003), the UK government confirmed that it expects these two technologies to make significant contributions to the energy system by 2020. The paper tests this expectation by assessing what incentives there are for householders and energy companies to invest in these technologies, and what barriers might prevent such investments. Having conducted this economic analysis, the paper concludes with a brief discussion of the wider implications of these models for consumer behaviour. In particular, the concluding section considers whether changes in fiscal rules, coupled with advances in IT and control systems, will be a sufficient condition for a shift to genuine co-provision by consumers.
2. Co-provision: a more active role for energy consumers To better understand possible changes in the relationship between energy companies and consumers, it is useful to examine some relevant concepts from the literature. It is clear from these that there are many ways to characterise an active consumer involvement in the design, development and delivery of a product or service. Udwadia and Kumar (1991) have identified the need for co-construction of new products to better take account of consumer requirements. This process is facilitated by advances in information technology, and includes rapid prototyping of new products, customer experimentation which leads to design modifications, and the use of flexible manufacturing to respond quickly to these modifications. It leads to a close collaborative
relationship between consumers and producers including a shared ownership of the final product. Whilst co-construction focuses on the development of new consumer products, it mirrors a common approach to the delivery of services. The customer is often seen as central to the development and delivery of services. However, the involvement of the consumer in service processes can vary considerably. According to Sabine Fliess and Michael Kleinaltenkamp this involvement ranges from the active co-production of a service to passive consumption: ‘As a co-producer or partial employee the customer may take an active part in the service operation, such as in self-service restaurants. Participation can also be limited to a more passive form of involvement, a requirement of physical presence such as in surgery, a need for the customer to be merely mentally present such as in education or the need to start and stop a process such as in car repairs’ (Fliess and Kleinaltenkamp, 2002, p. 1). Consumer participation in the development products and services is not confined to the business literature. In development studies too, some analysis has been carried out that focuses on the co-production of goods and services. This analysis may be of more relevance to the micro-generation case since it focuses on the development of entire systems such as irrigation, urban infrastructures and primary education. For Elinor Ostrom, co-production is a broad concept which ‘implies that citizens can play an active role in producing public goods and services of consequence to them’ (Ostrom, 1996, p. 1073). In his study of irrigation systems in Taiwan, Wai Fung Lam (1996) observes that co-production means an interdependent relationship between regular producers (irrigation officials) and what he calls ‘consumer producers’ (farmers). The knowledge and skills of both sides is essential to the development of these systems. These perspectives on consumer participation in the development of products, services and systems aid an understanding of the potential impact of micro-generation on the role of the consumer. Whilst ideas of coconstruction have been elaborated for new product development, they could be applied more widely to energy system development with consumers as an active participant. Similarly, co-production could imply that energy and/or energy services are produced by a combination of energy companies and consumers. Micro-generation is just one element of this possible shift to co-construction and co-production. To try to capture this shift more comprehensively, it is useful to apply a further related concept from the literature. Co-provision (e.g. Chappells et al., 2000) is perhaps a broader term than co-production or coconstruction. It implies an active consumer role in the development of energy systems, the delivery of energy
ARTICLE IN PRESS J. Watson / Energy Policy 32 (2004) 1981–1990
services and the ownership and operation of these systems and services. For Bas van Vliet and Heather Chappells (1999), co-provision means ‘the provision (including generation, treatment, distribution and consumption) of utility services by a range of new intermediaries (e.g. consumers themselves, other organisations or sub-networks), alongside or intermingled with centrally provided services (e.g. public networks or grid-provision)’. Within this definition, they include the ownership and operation of micro-generation technologies such as solar PV systems by consumers. They also include more conventional forms of co-provision such as demand side management, for example through the use of energy efficient lightbulbs.
3. Co-provision and micro-generation This brief survey of the literature suggests that coprovision best describes the potential for a more active role for consumers who invest in micro-generation within their homes. At this stage in the development of micro-generation market, the precise nature of this new role is not yet clear. The uptake of micro-generation will depend on a number of factors apart from any consumer desire to co-provide the energy services they require. These include the availability of technologies, the costs and benefits of installation and the prevailing regulatory environment. Economic incentives of various kinds will have a particularly important influence on decisions to invest in micro-generation by consumers. These incentives will also govern the extent to which micro-generation will also be owned and installed by traditional energy companies or emerging energy service companies. There are many possible models for micro-generation investment, each of which has different implications for ownership, operation, control and information flows. These possibilities imply a spectrum of consumer co-
1983
provision. At one end of this spectrum, consumers could be prepared to use the installation of micro-generation to develop a very active approach to energy service coprovision within their homes. For example, they could buy their own micro-generation unit, operate it independently of their energy suppliers, and change their energy use patterns to maximise the economic and wider benefits of ownership. Other consumers at the opposite end of the co-provision spectrum might prefer to leave the responsibility for ownership and operation to an energy company, and only consider minimal adjustments to their behaviour. To help explore the co-provision spectrum, Table 1 summarises the key features of three models for microgeneration investment. Whilst the table does not cover all potential models, it includes different options for micro-generation ownership and operation. It also indicates the financial costs and benefits of these options for consumers and energy companies. For simplicity, the energy company is assumed to be responsible for both retail supply and the operation of the local electricity distribution network. In practice, these functions might be carried out by two separate companies (this is often the case in the UK). The first ‘plug and play’ model is the simplest. It is probably the most common method for financing microgeneration installations at present. The household consumer pays for a micro-generation system (e.g. a micro-CHP or solar PV installation), and operates it to maximise their private economic benefits. Depending on the country in which these systems are installed, the upfront capital costs may be partly reduced through grants, tax breaks or loan schemes. The second model is more complex, particularly because it includes remote control of the microgeneration unit by an energy company. This is already being considered by some energy companies. For example, the local electricity company in Hamburg, Germany intends to install 50 micro-generation fuel cell
Table 1 Three models for the ownership and operation of micro-generation Plug and play
Company ownership
Leasing
Ownership
Consumer
Energy company
Operation
Consumer: Operation according to consumer needs for power and heat
Costs and benefits
Consumer saves money on energy bills, but has to pay capital cost. Energy company loses kWh sales, and might provide clear terms of grid access and buyback rates.
Energy company: operation to help energy company balance supply and demand (could take into account consumer preferences) Consumer gets cheaper energy in return for hosting micro-generation. Energy company avoids buying wholesale electricity, and can balance their system more cheaply.
Energy company: But possible transfer to consumer at end of leasing period. Shared: Operation to help energy company balance supply and demand, taking into account consumer preferences Consumer saves money on energy bills, and spreads capital costs. Energy company retains some operational control and recoups capital investment through lease payments.
Source: Author.
ARTICLE IN PRESS 1984
J. Watson / Energy Policy 32 (2004) 1981–1990
units that it will control remotely in this way (Weinmann, 2002). Under this model, it is likely that there will be some kind of benefit sharing with the consumer (e.g. in the form of lower energy bills). The third model is an intermediate one. The microgeneration unit is leased to the consumer over a number of years by an energy company. Costs and benefits are shared, as is the day-to-day control of the unit. One possibility is for the consumer to set their priorities for heat and electricity in advance. These priorities would then be taken into account by the energy company when it operates the facility (IEE, 2002). In common with the second model, communication and control signals could be passed between the consumer and the energy company. In summary, each of the three investment models has a number of features that will affect the extent of energy service co-provision by consumers and energy companies. They indicate that the economic incentives on coproviders to apply these models vary considerably. They also have some wider implications for possible changes in consumer behaviour. The new IT and control systems implied by some investment models lead to a greater scope for consumer participation in the operation of micro-generation units and perhaps, in the way they use energy more widely within the home.
4. The economics of micro-generation in the UK It is clear that economic considerations will be central to any decision by consumers and energy companies to invest in micro-generation. It is therefore interesting to test the models using those micro-generation technologies that are likely to be available commercially in the next few years. This will help to identify what part
economics will play in facilitating or inhibiting a move towards co-provision using micro-generation. To start this testing process, this section of the paper analyses the economics of micro-CHP and solar PV in the UK using the Plug and Play and Leasing models. These two technologies have been chosen since they are currently being promoted by a number of government and commercial initiatives in the UK. Government initiatives include a plan to install 6000 micro combined heat and power units in poorer households (DEFRA, 2001; DTI, 2003), a grant scheme for domestic solar photovoltaic installations (DTI, 2003) and a programme of work to address barriers to micro-generation by the Distributed Generation Co-ordinating Group (DGCG, 2003). Alongside these, at least two companies are planning to launch new micro-CHP products in the UK in the next year or so. One of these companies— PowerGen—expects that 30% of UK households will have a micro-CHP unit by 2020 (Brown, 2003). 4.1. The economics of plug and play Table 2 compares the economics of two microgeneration systems in the UK using data from a commercial solar PV product that is being sold by Solar Century and a Stirling engine micro-CHP product that is under development by BG Group. In each case, a plug and play business model is used—i.e. the consumer pays the investment costs and has control over the operation of the unit. The figures in the table give a rough idea of the economics of two micro-generation technologies, and some approximate investment payback times for householders. It is clear that, even with the current 50% capital grant scheme, solar PV still has a payback of several decades. The situation for Stirling engine microCHP technology is more attractive, though the payback
Table 2 The economics of solar PV and micro-CHP investments by UK consumers Solar PV Solar Century Sunstation 12
Micro CHP BG Stirling Engine
Size Installed cost to consumer
1.5 kWp d4300+5% VATa
1.1 kWe/5 kWth d2500+17.5% VAT
Annual electricity generation Electricity price (buy & sell) Annual gas consumption Gas price
1100 kWh 7.5p/kWh -
2700 kWh (500 kWh exported) 7.5p/kWh 19,050 kWh 1.5p/kWh
Annual ROC revenueb
d45
-
Payback period
35 years
14 years
Calculations assume an average medium-sized energy consumer, consuming 3300 kWh of electricity and 19050 kWh of gas, with net electricity metering. a Assumes a 50% capital grant paid under the Department of Trade and Industry’s current subsidy scheme. b ROC revenue from the sale of Renewable Obligation Certificates at an average price of 4.0 p/kWh.
ARTICLE IN PRESS J. Watson / Energy Policy 32 (2004) 1981–1990
period for this technology is still much too high to attract widespread interest. These results are somewhat more pessimistic than those from some other assessments, particularly of micro-CHP investments. In a report to the Energy Savings Trust, EA Technology gave a much shorter payback period for these investments of 3–4 years (Harrison and Redford, 2001). The difference may be explained by the fact that the EA Technology calculations are based on the marginal capital cost of microCHP (i.e. the difference between the cost of a CHP unit and the established alternative—a replacement central heating boiler). This type of comparison shows the premium that consumers would have to pay to upgrade to a micro-CHP unit instead of a condensing boiler. It is applicable only in circumstances when the consumer is forced to change their boiler due to a breakdown of their existing system. It might be argued that this marginal cost method is more appropriate than the ‘full cost’ method employed in Table 2. This is because manufacturers expect that investment in micro-CHP will be primarily by consumers who are forced to replace old central heating boilers. There are 800,000 such replacements in the UK each year (Harrison and Redford, 2001). However, it can also be argued that a full cost calculation allows micro-CHP investments to be compared with other micro-generation options such as solar PV under different business models. For this reason, this full cost basis has been used throughout this paper. Apart from the cost basis of the calculations, there are a number of other economic factors that will affect the diffusion of ‘plug and play’ micro-generation in the UK. First, it is particularly important to note that the calculations in Table 2 do not include maintenance costs. These are likely to be significant, and at least as high as those for current central heating systems. Commercial maintenance packages for these systems currently cost consumers between d100–d150 per year.1 If maintenance costs of d100 per year are included, the payback period for a micro-CHP investment increases to 25 years. However, it is likely that most purchasers of micro-CHP units will be replacing an existing central heating boiler. Therefore, they will not incur significant additional costs for annual maintenance and servicing. For the second case—solar PV—manufacturers claim that maintenance costs will be close to zero since installations are designed to be maintenance free during their lifetime. It remains to be seen whether this will be the case in practice. Second, the data in Table 2 for the solar PV case assumes that such installations will be eligible for 1
The UK’s biggest domestic gas supplier, British Gas, currently charges around d150 per year for boiler and central heating servicing and maintenance. See http://www.house.co.uk/.
1985
Renewables Obligation Certificates (ROCs) that are issued in the UK’s green certificate market. Since April 2002, ROCs have been issued to electricity suppliers for each unit of renewable electricity they produce. Registered suppliers have to use these ROCs to prove that they have generated or purchased a proportion of their electricity from renewable sources. Initially, this proportion has been set at 3%, though the figure will rise each year to reach just over 10% in 2010. If a supplier is unable to meet this target in a given year, they can pay a fine of 3 p/kWh for any shortfall. In principle, consumers should be able to accumulate ROCs for PV and other renewable electricity they generate, and sell these to suppliers with a shortfall. In practice, the transaction costs of doing this are expected to be high. At present, it is not clear whether consumers will be able to aggregate their PV output to overcome these transaction costs. In Table 2, an average ROC price of 4.0 p/kWh has been assumed, a figure that has been derived by the author from scenarios developed within the Tyndall Centre (Watson, 2002b). If ROC revenue is not available, the payback period for solar PV micro-generation in Table 2 would increase to 54 years. A third significant economic qualification to the data in Table 2 concerns net metering. It is assumed in each case that net metering agreements with the local electricity supplier are possible. These mean that the consumer exports and imports electricity at the same price (around 7.5 p/kWh). In many cases, electricity suppliers are unwilling to offer net metering, and will instead buy electricity exports at much lower prices. For the micro-CHP case, a lower tariff of 3 p/kWh for electricity exports would slightly increase the payback period to 15 years. Whatever buy-back tariffs are ultimately available to consumers, new two-way electricity meters will be required to allow the accurate calculation of their electricity bill. Some types of meter could also bring additional benefits to consumers since they would enable a greater degree of energy service co-provision. For example, these meters could allow consumers to access variations in energy prices at different times of the day. Exporting at a time of high electricity demand could bring greater financial rewards to consumers, thereby changing behaviour in a way that benefits the whole energy system. Another related possibility is that a consumer could benefit from locational charges for the use of the electricity distribution system. The UK is currently in the process of implementing a radical new charging structure for the use of distribution networks (Ofgem, 2002). This offers the possibility of consumers receiving a payment for installing generation that would strengthen a weak part of the network. In addition to these potential economic barriers to ‘plug and play’ micro-generation in the UK, there are
ARTICLE IN PRESS 1986
J. Watson / Energy Policy 32 (2004) 1981–1990
also technical and regulatory issues that could deter consumers from making such investments. Many of these are now being addressed within the Distributed Generation Co-ordinating Group’s work on microgeneration solutions (DGCG, 2003). One of the most important concerns technical connection standards. These require equipment to protect the electricity network and micro-generation equipment in the event of system instability or faults. A new standard—known as G83—has now been developed to specify what is required with the aim of ensuring that electricity distribution companies do not have to inspect the installation of each micro-generation unit on a case by case basis. 4.2. The economics of leasing For the Company Ownership and Leasing investment models (see Table 1), energy companies in particular will have weigh up a different set of costs and benefits to those that apply to the Plug and Play model (e.g. ESD, 2002). On the positive side, it is probable that an energy company would be able to ‘bulk buy’ micro-generation equipment and achieve substantial discounts on the usual retail price. The extent of the bulk buy discount is difficult to predict, though it may reduce the microgeneration installed cost by around a third. In the UK, they would also be able to use standard capital allowances to offset part of their investment costs against their tax bill. These allow 25% of the investment costs to be offset each year on a reducing balance basis (HM Treasury, 2003). Table 3 illustrates how both of these factors might affect the economics of micro-CHP investment by a UK energy supplier. Table 3 shows that each household installation would require a UK energy supplier to invest around d1500 up front—an investment that it would have to recoup through consumer leasing payments, capital allowances and other savings. As Table 3 illustrates, one possibility would be that the energy company would agree to discount the consumer’s total annual electricity and gas bills by a small percentage (say 10%) for a number of years. The installation of a micro-CHP unit would allow the company to offset some of its own electricity purchases (from the wholesale market) and to ‘bundle’ a number of services together—electricity, gas and micro-CHP maintenance—for a single annual fee. As the deregulated energy retail market in the UK has shown, many energy companies are already bundling a number of products in this way to cut costs and make a profit.2 2 For example, this is illustrated by the popularity of ‘dual fuel’ offers where electricity and gas are sold to a consumer by the same energy supplier. The supplier’s incentive to do this stems from the poor profit margins of ‘single fuel deals’, particularly for electricity.
Table 3 Possible features of energy service company micro-CHP investment Micro CHP BG Stirling Engine Size Installed cost Capital allowance discount Discount rate Annual electricity generation Annual electricity consumption Electricity price to ESCo Annual gas consumption Gas price to ESCo
1.1 kWe/5 kWth d1650+5% VAT (33% discount by bulk purchasing) d130 in year 1, d97 in year 2, d73 in year 3 etc. 12% 2700 kWh (500 kWh exported) 3300 kWh (average medium consumer) 5.0p/kWh 19,050 kWh (average medium consumer) 1.0 p/kWh
Annual income from consumer
d432 (10% discount on previous energy bills)
Payback period
12 years
Calculations assume an average medium-sized energy consumer— 3300 kWh of electricity per year and 19,050 kWh of gas, with net electricity metering. They also assume that energy service companies will be able to buy gas and electricity a third cheaper than individual consumers.
As Table 3 illustrates, the economics of energy supplier investment in micro-generation using a leasing model are poor under present UK conditions. Assuming that the electricity and gas required for the household could be purchased at a 33% discount by the energy company, the payback period for this investment would be around 12 years. This is a substantial period of time, and is much too long for most companies to consider. The payback period is extended because companies would be expected to use commercial discount rates for the appraisal of such leasing schemes (a 12% rate has been used in Table 3). It is possible, however, that it could be cut further if an energy company could find ways of reducing electricity, gas or micro-CHP equipment purchase costs still further. Alternatively, the company could offer customers a smaller discount on their bill. It is clear that corporate investment in microgeneration, whether through outright ownership or some form of leasing agreement with consumers, would be financially complex. Further research is required to determine the extent to which energy suppliers or energy service companies could achieve further cost savings to reduce payback times. Lease financing is governed by a particularly complex set of rules and regulations, a detailed examination of which is beyond the scope of this paper. It is, however, important to note that leasing micro-generation equipment to consumers is difficult under current rules for a number of reasons. According
ARTICLE IN PRESS J. Watson / Energy Policy 32 (2004) 1981–1990
1987
Table 4 The taxation of energy investments in different UK sectors
Profit-based sectors e.g. power generation on supply side; chemicals on demand side
Non-profit sectors e.g. households, schools, state hospitals etc.
Supply side
Demand side
VAT: Passed through to customers
VAT: Passed through to customers
Tax & depreciation: Standard allowances
Tax & depreciation: Enhanced capital allowances under Climate Change Levy for qualifying equipment.
VAT: Paid at 17.5%.
VAT: Paid at 17.5% for many ‘purchased measures; reduced 5% VAT for most ‘installed’ measures on public schemes
Tax & depreciation: No tax or depreciation allowance e.g. microCHP generation at point of use.
Tax & depreciation: No tax or depreciation allowance
Source: Chesshire (2003).
to BG Group, one of the main barriers to leasing this equipment is a 5 year limit for domestic appliances (BG Group, 2001). As this paper has shown, this may not be long enough to make leasing financially attractive for an energy company or a consumer. Even if they were able to achieve further savings in costs, leasing investments by an energy company would still be difficult in the current UK market. One critical issue that is often cited in discussions of energy service approaches to investment is known as the 28 day rule (Chesshire, 2000). This allows consumers to switch electricity or gas suppliers by giving 28 days’ notice to their current supplier. This rule is a cornerstone of the UK approach to energy deregulation, and is designed to protect consumers from ‘lock-in’ to high tariffs by suppliers. The problem is that the rule also makes it difficult for suppliers to offer energy service packages that depend on a relationship that is more than 28 days long. Unless it is modified in some way, it may effectively rule out the type of investment shown in Table 3. Another issue that might impact on the attractiveness of micro-generation leasing or ownership by energy companies is information technology. New information technology (IT) investments might be desirable under these models to allow data and control signals to be passed between houses and energy companies. This would enable a much greater degree of service coprovision by energy companies and consumers. For example, energy supply companies in the UK could use a portfolio of ‘networked’ micro-generation to help balance supply and demand, and avoid the purchase of high-cost peak electricity. Similarly, electricity distribution companies could make contracts with these units to enhance network security. The aggregate effect of such benefits may be to justify the up-front costs of control and communication infrastructure.
5. Taxation as a barrier to co-provision When applied in the UK, the Plug and Play and Leasing models for investment in micro-generation do not lead to a favourable economic outcome. In all cases, the payback times using a full cost method are over 10 years—too long for investment to be justified purely on economic grounds. Of course, as demonstrated by the significant numbers of applications for the UK PV grant scheme, some consumers will wish to invest in microgeneration irrespective of the economics. This may also be the case for micro-CHP once units are commercially available. This could be particularly true of consumers who are forced to change their central heating boiler, and might be persuaded to pay a premium on top of the normal replacement cost. One of the most notable features of micro-generation economics in the UK is the way in which payback times are influenced by taxation rules. The Plug and Play and Leasing models for investment are subject to different rules for sales tax (Value Added Tax or VAT) and capital allowances. It is therefore interesting to investigate whether a change in these rules would improve the economics of micro-generation and hence, the incentive for consumers to co-provide energy services within their homes. As John Chesshire (2003) has observed, the financial rules that govern energy investments on the consumers’ side of the meter in the UK are significantly different to those that apply to investments by energy companies. These differences are extensive and complex, and would require considerable research to identify in detail. Table 4 identifies some of the most important features of these rules with a particular focus on rates of VAT and eligibility for capital allowances. The Table does not include one vital part of the UK energy system—the offshore oil and gas industry. In
ARTICLE IN PRESS J. Watson / Energy Policy 32 (2004) 1981–1990
general, the UK government has traditionally provided attractive tax incentives for the development of offshore resources. The tax regime for the oil and gas fields of the North Sea has been designed to attract international investment and to offset some of the considerable capital costs of new infrastructure.3 As the table shows, similar, though less generous, tax allowances have also been made available to onshore energy supply investments such as new electric power stations or industrial energy facilities. However, the rules for consumers are rather different. Tax allowances are not available for energy saving investments in households, and many equipment purchases (e.g. of efficient appliances) attract the maximum rate of VAT. As this paper has already shown, one of the key differences in the financial rules that apply to consumers and companies is the availability of capital allowances. Such allowances are not available to individuals for general investments. Instead, they only apply to costs associated with self employment (e.g. the purchase of a computer). The UK has recently introduced more generous capital allowances for businesses that invest in energy-saving equipment such as combined heat and power systems, efficient motors etc (HM Treasury, 2003). These Enhanced Capital Allowances (ECAs) allow companies to offset 100% of the costs of these investments against their taxable profits in the year of purchase. This means that a company spending d1 million on energy-saving equipment in this financial year can benefit immediately from an effective capital cost reduction of d300,000 or 30% (the standard rate of corporation tax). Whilst micro-generation technologies are not currently included in the list of approved technologies for the ECA scheme, the extension of the scheme could make such investments considerably cheaper for energy companies wishing to use the second and third models shown in Table 1. Alternatively, the economics of investment under the first model could be more attractive if individual taxpayers were eligible for capital allowances on energy-saving investments. In its response to a recent government consultation on household energy efficiency, the Energy Saving Trust recently suggested that such a change in policy should be considered (EST, 2002). Depending on their income, consumers could claim 22% or 40% of the microgeneration equipment cost in their next tax return. At present, only 4 million UK individuals fill in tax returns each year. The majority of those in employment have their taxes deducted by their employer. Therefore, a change in fiscal rules of this type would only reach a minority of households. However, such a change could
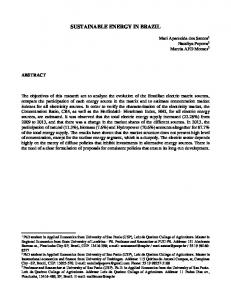
also be designed to allow landlords who rent or manage housing to offset their energy-saving investments against their personal or corporation tax liabilities. According to the Energy Saving Trust, this would target a further 3 million homes in the UK (or 12% of the housing stock). At present, landlords would have to pay the full costs of investments such as micro-generation whilst their tenants would usually get the benefits in terms of lower energy bills. The extension of tax credits to landlords might help overcome this ‘split incentive’ which has often been cited as a major barrier to energy saving investments in the rented sector. 5.1. Economic implications of capital allowances As Fig. 1 shows, the economics of our two technologies under the Plug and Play model are changed significantly if individual consumers are allowed to claim 100% first year capital allowances. A middle income consumer with a marginal income tax rate of 22% would be able to claim back this percentage of the capital costs in the year of installation. For the PV example shown, this would be equivalent to a further capital subsidy of almost d1000. For the micro-CHP example, it would be worth nearly d600 in capital savings assuming that the VAT rate is also reduced to 5% (Energy Saving Trust, 2002). Payback times for these two examples would reduce to 29 years for PV and 11 years for micro-CHP. A higher rate taxpayer, with a marginal income tax rate of 40%, would be able to save even more money. Payback times for these consumers would reduce to 22 and 8 years, respectively. In addition to making available 100% first year ECAs to individual consumers, the government might also extend the current ECA scheme for businesses to include micro-generation equipment. This would make additional capital incentives available to both energy companies and corporate landlords. It might also encourage energy service companies to extend their activities in the UK—from the business and commercial sector to the domestic energy market (Chesshire, 2000).
40
Payback Period (yrs)
1988
35
No Capital Allowances
30 25
ECAs for 22% Taxpayer
20 15
ECAs for 40% Taxpayer
10 5 0
3
Currently, 100% first year allowances are given for these investments. The North Sea royalty is due to be abolished soon (HM Treasury, 2002).
Solar PV
Micro CHP
Fig. 1. The plug and play model with enhanced capital allowances. Source: author’s calculations.
ARTICLE IN PRESS J. Watson / Energy Policy 32 (2004) 1981–1990
If 100% first year ECAs are applied to the Leasing model from Table 1, investment in micro-generation by companies becomes slightly more attractive. Using the case of micro-CHP again, the implication is that 30% of the capital cost can be written off against tax in the year of investment. In practice, this means a d500 discount on the installed cost in addition to that from bulk purchase. This, in turn, leads to a reduction in the payback period from 12 to 10 years. The extension of the Enhanced Capital Allowance scheme might be one way to help micro-generation and other demand side investments to compete with investments elsewhere in the energy system. It could be argued that such a change in the rules to level the tax playing field is a prerequisite for a fair approach to such investments, particularly if the aim is to reduce energy system carbon emissions at least cost. However, the estimated impacts show that adjustments in capital allowances are not a panacea for micro-generation. Further falls in investment costs will probably be required from current levels to bring payback times within the much shorter timeframe considered by most companies and consumers.
6. Conclusions This paper has examined the potential for energy service co-provision by energy companies and domestic consumers using micro-generation. It has set out three possible models for micro-generation investment and operation. It has also explored the economics of solar PV and micro-CHP using two of these models in the UK under current energy market conditions. The economic analysis presented in this paper shows that micro-generation investment is likely to have a payback time under current UK conditions of well over a decade. This is probably too long for most consumers or energy companies to be interested in pursuing this option. The only exception to this general result occurs when there is a forced purchase of a micro-CHP unit to replace a retired central heating boiler. In this case, the marginal payback time of the additional cost of a micro-CHP unit will be much shorter. This might provide enough of an incentive for micro-CHP to take a significant share of the boiler replacement market. This paper has demonstrated that the economics of micro-generation in the UK are not helped by significant discrepancies in the tax rules for consumers, energy companies and other parts of industry. Levelling the playing field to give consumers access to the same capital allowances as the corporate sector, and extending the types of investment eligible for such allowances, is one way of tackling these discrepancies. Such a change in the fiscal rules would bring micro-CHP technologies
1989
closer to financial viability for many consumers, and would help PV technology enter the timeframe of most mortgages. Of course, it would also make it easier for consumers to invest in many other energy-saving measures that are more cost effective in some cases. Examples include more efficient central heating boilers, loft insulation, ‘A’ rated white goods etc. Whilst the cost effectiveness of these measures in comparison with micro-generation is beyond the scope of this paper, it has been shown that many of them have much shorter payback periods (Chesshire, 2003). The analysis of micro-generation investment models has raised some broader issues about the relationship between consumers and energy companies. The different ownership structures within these models and the prospect of new communication and control infrastructures could foster a move towards genuine co-provision. For example, the availability of real-time electricity export price information within households could encourage consumers to change their behaviour to import electricity when it is cheap and export when it is expensive. Similarly, distributed control systems could allow appliances within the home to be switched on and off automatically in response to such price signals and consumer preferences. It has been suggested that these types of consumer engagement with the energy system might foster a sense of shared responsibility. This shared responsibility (Mitchell, 2003) is seen as a key element of the shift towards a more sustainable energy system. So far, the anecdotal evidence that micro-generation will lead to co-provision and a sense of shared responsibility is mixed. Some early tests of micro-CHP units have encouraged consumers to start changing their habits in order to make best use of the electricity they produce within their home.4 However, in trial of company-owned solar PV systems on homes in Holland, there was little discernible impact on consumer behaviour (Chappells et al., 2000). Over the next few years, it will become clear to what extent micro-generation will lead to a genuine move to co-provision. The removal of technical, economic and regulatory barriers to micro-generation investments is only part of the story. Whilst it may be argued that the removal of some of these barriers is a necessary condition for the commercial success of micro-generation, this may not be sufficient to encourage coprovision. As many studies have argued (e.g. Sorrell et al., 2000), consumer energy investments are the result of a complex decision-making process which includes economic considerations alongside many other factors. Even if the economics become much more attractive, micro-generation could be seen by energy companies as 4 Personal communication with BG Group following field trials of their micro-CHP unit.
ARTICLE IN PRESS 1990
J. Watson / Energy Policy 32 (2004) 1981–1990
an extension of the status quo, with remote control of large numbers of units installed in the homes of passive consumers. Alternatively, consumers might embrace the new possibilities opened up by micro-generation and information technology, and play a more active role in the delivery of the energy services they require.
Acknowledgements The author would like to thank a number of individuals who helped to develop the thinking for this paper and commented on earlier drafts—particularly John Chesshire, Nick Hartley, Catherine Mitchell and Dave Sowden.
References Adner, R., 2002. When are technologies disruptive? A demand-based view of the emergence of competition. Strategic Management Journal 23, 667–688. BG Group (2001) Submission to Cabinet Office Energy Review, BG Group, 7th September. Brown, P., 2003. Powergen Markets Boiler that Generates Electricity. The Guardian 12th June. Chappells, H., Klintman, M., Lind"en, A.L., Shove, E., Spaargaren, G., and van Vliet, B. 2000. Domestic consumption utility services and the Environment. Final Project Report, Universities of Lancaster, Wageningen and Lund. Chesshire, J., 2000. From electricity supply to energy services: prospects for active energy services in the EU. Report to Eurelectric and the European Commission, Brussels. Chesshire, J., 2003. Energy efficiency. Draft Discussion Paper for ESRC Energy Research Conference, Policy Studies Institute, 31st March. Department for the Environment, Food and Rural Affairs (DEFRA) and Department of Trade and Industry (DTI), 2001. The UK Fuel Poverty Strategy: First Annual Progress Report. The Stationery Office, London. Department of Trade and Industry (DTI), 2003. Our Energy Future: Creating a Low Carbon Economy. The Stationery Office, London. Distributed Generation Co-ordinating Group (DGCG), 2003. First Annual Report (2001/2002). DTI and Ofgem, London. Energy for Sustainable Development (ESD), 2002. The Potential Market for Micro-CHP in the UK. Report to the Energy Saving Trust, ESD, June. Energy Saving Trust (EST), 2002. EST Response to HMT Consultation on Economic Instruments to Improve Household Energy Efficiency. EST, October. Fleetwood, T., 2001. An investigation into the disruptive capacity of distributed power technologies. M.Sc. Dissertation, Manchester School of Management, Manchester.
Fliess, S., Klienaltenkamp, M., 2002. Blueprinting the service company: managing service processes efficiently. Journal of Business Research 5701, 1–13. HM Treasury, 2002. A modern and competitive tax system. Press Release, 17th April. HM Treasury, 2003. Protecting the Environment. 2003 Budget Press Notice No.4, 9th April. Harrison, J., and Redford, S., 2001. Domestic CHP: what are the Potential Benefits? Report to the Energy Saving Trust. Institution of Electrical Engineers (IEE), 2002. The Enternet—the power to transform the electricity industry. Seminar held at IEE, Savoy Place, London, 20th February. International Energy Agency (IEA), 2002. Distributed Generation in Liberalised Electricity Markets. IEA/OECD, Paris, June. Lam, W., 1996. Institutional design of public agencies and coproduction: a study of irrigation associations in Taiwan. World Development 24 (6), 1039–1054. Magnussen, T., Tell, F., Watson, J., 2003. Sticking to your knitting or changing business model? Discontinuities and capabilities in electrical power generation equipment manufacturing. Paper submitted to Industrial and Corporate Change. Maycock, P., 2002. The world PV market: production increases 36%. Renewable Energy World, July–August. Mitchell, C., 2003. Renewable energy: step change in theory and practice. Draft Discussion Paper for ESRC Energy Research Conference, Policy Studies Institute 31st March. Office of Gas and Electricity Markets (Ofgem), 2002. Structure of Electricity Distribution Charges—Update Document. Ofgem, London. Ostrom, E., 1996. Crossing the great divide: coproduction, synergy and development. World Development 24 (6), 1073–1087. Patterson, W., 1999. Transforming Electricity. Earthscan, London. Sorrell, S., Schleich, J., Scott, S., O’Malley, E., Trace, F., Boede, U., Ostertag, K., Radgen, P. 2000. Barriers to energy efficiency in public and private organisations. Final Report to the European Commission. SPRU, University of Sussex, Brighton. Udwadia, F.E., Kumar, K.R., 1991. Impact of consumer coconstruction in product/service markets. Technological Forecasting and Social Change 40 (3), 261–272. Van Vliet, B., Chappells, H., 1999. The co-provision of utility services: resources, new technologies and consumers. Paper for Consumption, Everyday Life and Sustainability Summer School, University of Lancaster. Watson, J., 2002a. Financing micro-generation: options for the future. Paper for the UK Solar Energy Society Conference on Energy Generation and Efficiency in Buildings, University of Southampton, 9th December. Watson, J., 2002b. Renewables and CHP deployment to 2020. Tyndall Centre Working Paper No.21, Tyndall Centre for Climate Change Research, January. Watson, J., 2003. Financing micro-generation: some options for the future. Paper for the 26th Annual IAEE Conference: New Challenges for Energy Decision Makers, Prague, Czech Republic, 4–7th June. Weinmann, O., 2002. Experience in operating hydrogen systems. Presentation to UK Hydrogen Energy Network Meeting, Rutherford Appleton Laboratory, 10th July.