Evaluating gas sources, demand and utilization for CO2 and H2 within the North RhineWestphalia area with respect to gas qualities supported by Climate-KIC Deutschland, Berlin
September 2015
Dietmar Schüwer (project leader) Karin Arnold Katrin Bienge Prof. Dr. Stefan Bringezu Laura Echternacht Andrea Esken Prof. Dr.-Ing. Manfred Fischedick Dr. Justus von Geibler Samuel Höller Frank Merten Karen Perrey (Covestro Deutschland AG) Andreas Pastowski Katja Pietzner Clemens Schneider Julia C. Terrapon-Pfaff Dr. Peter Viebahn With support of: Sascha Eckstein Kristof Kamps
Final Report
CO2 ReUse NRW
Wuppertal, September 2015 Contact Wuppertal Institute: Prof. Dr.-Ing. Manfred Fischedick Dipl.-Ing. Dietmar Schüwer Research Group 1 "Future Energy and Mobility Structures" (project management) Phone: (0202) 2492 - 121 (MF) - 288 (DSch) Fax: (0202) 2492 - 198 E-Mail:
[email protected] [email protected] Prof. Dr. Stefan Bringezu Research Group 3 “Material Flows and Resource Management” Phone: (0202) 2492 - 131 E-Mail:
[email protected] Dr. Justus von Geibler Research Group 4 “Sustainable Production and Consumption” Phone: (0202) 2492 - 168 E-Mail:
[email protected] Wuppertal Institute for Climate, Environment and Energy P.O. Box 10 04 80 42004 Wuppertal Germany Web: www.wupperinst.org
Contact Covestro: Dipl.-Ing. Karen Perrey Technology & Innovation (COV-IO-BC-T & I) Phone: (0214) 6009 3356 E-Mail:
[email protected] Covestro Deutschland AG E60, 323 51365 Leverkusen Germany Web: www.covestro.com
II
Wuppertal Institute for Climate, Environment and Energy 2015
CO2 ReUse NRW
Table of contents INTRODUCTION .................................................................................................................................................. 1! 1! SOURCES OF CARBON DIOXIDE (CO2) AND HYDROGEN (H2) ........................................................ 3! 1.1! INDUSTRIAL SOURCES OF CARBON DIOXIDE - QUALITIES, QUANTITIES AND REGIONAL DISTRIBUTION AT EUROPEAN LEVEL WITH A SPECIAL FOCUS ON NRW ............................................................................................ 3! 1.2! EXCURSUS: CO2 AS BYPRODUCT OF BIOMETHANE PLANTS ......................................................................... 7! 1.3! INDUSTRIAL SOURCES OF HYDROGEN - QUALITIES, QUANTITIES AND REGIONAL DISTRIBUTION AT EUROPEAN LEVEL WITH A SPECIAL FOCUS ON NRW .......................................................................................... 11 1.4! MILESTONE: OVERVIEW OF CO2 AND H2 SOURCES ................................................................................... 20!
2! UTILIZATION OPTIONS FOR CARBON DIOXIDE (CO2) AND HYDROGEN (H2) ........................ 21! 2.1! CURRENT UTILIZATION STRUCTURES OF CO2 AND H2 AS A FEEDSTOCK (GENERAL OVERVIEW) ............... 21! 2.1.1! Global industrial use of carbon dioxide ........................................................................................... 21! 2.1.2! Global industrial use of hydrogen .................................................................................................... 24! 2.2! CO2 AND H2 AS A SPECIFIC FEEDSTOCK FOR THE CHEMICAL INDUSTRY .................................................... 25! 2.2.1! Demand and utilization of CO2-needed quantities and qualities and purpose of use, today and in future times .................................................................................................................................................... 26! 2.3! CO2 AND H2 AS A SPECIFIC FEEDSTOCK FOR FUEL SYNTHESIS (POWER-TO-GAS/FUEL WITH RENEWABLES) 27! 2.3.1! Demand and utilization of CO2- and H2-needed quantities and qualities and purpose of use, today and in future times ......................................................................................................................................... 28! 2.3.2! Needed power, needed quantities of gases ....................................................................................... 30! 2.4! CURRENT PROJECTS AND ACTIVITIES (INCLUDING DEMONSTRATION PROJECTS) ...................................... 34! 2.4.1! CO2 utilization in the chemical industry ........................................................................................... 35! 2.4.2! Biological CO2 utilization ................................................................................................................. 35! 2.4.3! CO2 utilization projects on EU level ................................................................................................. 36! 2.4.4! Research networks for CO2 reuse ..................................................................................................... 36! 2.4.5! Power-to-Gas and Power-to-Fuel demonstration projects .............................................................. 36! 2.4.6! Projects with H2 transport ................................................................................................................ 37! 2.5! MILESTONE: SPECIFICATION OF PROMISING APPLICATIONS FOR CO2 AND H2 AS A FEEDSTOCK (CURRENT STATUS AND FUTURE PERSPECTIVES) .................................................................................................................. 38!
3! SINK-SOURCE-MATCHING OF CARBON DIOXIDE (CO2) AND HYDROGEN (H2) IN NRW ..... 39! 3.1! GENERAL REMARKS AND PREREQUISITES FOR UTILIZATION OF CO2 AND H2 ............................................ 39! 3.2! QUANTITATIVE ESTIMATION OF FUTURE CO2 AND H2 REUSE POTENTIAL IN NRW ................................... 40! 3.2.1! Case A: Global Assumption .............................................................................................................. 41! 3.2.2! Case B: CO2 emissions from industry, waste incineration and CHP in NRW ................................. 41! 3.2.3! Case C: Potential utilization processes for CO2 and H2 in NRW ..................................................... 41! 3.2.4 Comparison of cases......................................................................................................................... 42 3.3! EXCURSUS: PRINCIPAL MATCH OF CO2 EMISSION REDUCTION AND CO2 REUSE ....................................... 43! 3.4! QUALITATIVE DISCUSSION OF POTENTIAL LOCATIONS AND TRANSPORTATION OPTIONS .......................... 46! 3.5! MILESTONE: SPECIFICATION OF SELECTED VALUE CHAINS (FUTURE PERSPECTIVES)................................ 49!
4! METHODOLOGICAL BACKGROUND FOR A SYSTEMATIC MULTI-CRITERIA ANALYSIS (MCA) OF VALUE CHAINS FOR CO2 REUSE .............................................................................................. 51! 4.1! APPROACHES FOR INTEGRATED SUSTAINABILITY ASSESSMENT OF TECHNOLOGIES AND PROCESSES ........ 51! 4.1.1! Overview on preconditions and requirements that need to be respected in approaches to evaluate value chains ................................................................................................................................................... 51!
Wuppertal Institute for Climate, Environment and Energy 2015
III
4.1.2! Brief discourse on MCA as an overall methodology to support decisions on value chains ............. 53! 4.2! POTENTIAL CRITERIA FOR ASSESSMENT OF VALUE CHAINS FOR THE UTILIZATION OF CO2 ....................... 56! 4.3 MILESTONE: SET OF CRITERIA FOR THE ASSESSMENT OF VALUE CHAINS FOR THE UTILIZATION OF CO2 .. 63
5! CURRENT PERCEPTION OF CO2 REUSE ............................................................................................. 65! 5.1! 5.2! 5.3! 5.4! 5.5! 5.6!
STUDIES ON PUBLIC AWARENESS, PERCEPTION AND ACCEPTANCE OF CO2 REUSE .................................... 65! DECISION MAKER POLICY.......................................................................................................................... 69! SELECTED SOCIETAL STAKEHOLDER ......................................................................................................... 70! COMMUNICATION LACKS .......................................................................................................................... 71! APPROPRIATE COMMUNICATION METHODS AND TOOLS ............................................................................ 73! MILESTONE: RESULTS FROM THE SURVEY ABOUT CO2 PERCEPTION......................................................... 74!
6! RECOMMENDED ACTIONS ..................................................................................................................... 75! 6.1! RESEARCH AND DEVELOPMENT PRIORITIES .............................................................................................. 75! 6.2! DEMONSTRATION PROJECTS...................................................................................................................... 76! 6.3! POLITICAL AND ECONOMIC CONDITIONS ................................................................................................... 76! 6.4! COMPREHENSIVE ASPECTS FOR THE REUSE OF CO2 .................................................................................. 78! General aspects ............................................................................................................................................. 78! Ecological soundness .................................................................................................................................... 78! Systems analytical perspective ...................................................................................................................... 79! Perception ...................................................................................................................................................... 79!
BIBLIOGRAPHY ................................................................................................................................................ 83! ANNEX .................................................................................................................................................................. 91!
IV
Wuppertal Institute for Climate, Environment and Energy 2015
CO2 ReUse NRW
Index of tables Table 1-1: Overview of the selected branches and the key aspects considered by the analysis (State: 2012) _________________________________________________ 6!
Table 1-2: Composition of biomethane in dependency of substrate used __________________ 7! Table 1-3: Resulting amounts of CO2 separated from biomethane _______________________ 9! Table 1-4: Properties of various hydrogen production processes _______________________ 11! Table 1-5: Results of the H2NRW project _________________________________________ 15! Table 2-1: Processes of global CO2 utilization; the values indicate orders of magnitude _____ 22! Table 2-2: Processes of global H2 utilization _______________________________________ 25! Table 2-3: Production volume of hydrogen [billions of Nm /a] __________________________ 26! 3
Table 2-4: Conversion efficiencies for Power-to-Gas process chain including re-
electrification; process chain via hydrogen and methane _____________________ 28!
Table 2-5: Molecular masses of Hydrogen, Oxygen and Carbon (rounded values) _________ 29! Table 2-6: Mass and volume balance of input (CO2 and H2) and output (CH4 and H2O)
according to the Sabatier process, normed to the different elements ____________ 29!
Table 2-7: Balance of CO2-needed and methane produced via Power-to-Gas process in
NRW, based on the calculated amounts of hydrogen and electricity in scenario A _31!
Table 2-8: Balance of CO2-needed and methane produced via Power-to-Gas process in
NRW, based on the calculated amounts of hydrogen and electricity in scenario B2/C2 31!
Table 2-9: Amounts of electricity demand and H2, CH4 and water production according to the molecular formula for given amounts of CO2 from industrial and power sector ____ 33!
Table 3-1: Annually CO2 emissions by sources in the year 2050, theoretically suited for CO2
reuse in Germany (according to the UBA scenario) _________________________ 44!
Table 3-2: Demand for renewable methane as fuel and feedstock in a GHG-neutral Germany in 2050 44!
Table 3-3: Overview of potential future products made from CO2 and H2 and their potential production sites _____________________________________________________ 48!
Table 4-1: Overview on possible assessment criteria for value chains for the utilisation of CO2 56!
Table 5-1: Overview on communication lacks, regarding possible topics on CO2 reuse technologies _______________________________________________________ 71!
Table 6-1: Consolidation of recommended actions __________________________________ 80!
Wuppertal Institute for Climate, Environment and Energy 2015
V
Annex Table A 1: Analysed plants (> 0.4 Mt CO2 per year) and their flue gas emissions ___________ 91! Table A 2: List of projects of CO2 reuse in the chemical industry funded by the German BMBF 96!
Table A 3: List of Power-to-Gas demonstration projects in Germany with different technological foci ___________________________________________________ 97!
Table A 4: List of projects of CO2 reuse for chemical energy storage funded by the German BMBF 97!
Table A 5: Global Processes of CO2 utilization _____________________________________ 99! Table A 6: Global Processes of H2 utilization ______________________________________ 101!
Index of figures Figure 1-1: CO2 emission sources in megatons (Mt) per year in Europe ___________________ 3! Figure 1-2: Selected CO2 emission sources from industrial, waste-to-energy and CHP plants
> 0.4 Mt/year in NRW _________________________________________________ 5!
Figure 1-3: Process steps for the upgrading of biogas to biomethane (two different methods) __8! Figure 1-4: Yearly amounts of CO2 separated from biomethane upgrading units in NRW,
sorted by the age of plant, hatched bars: plant in planning & construction ________ 10!
Figure 1-5: Map of biomethane plants with separated (and emitted) CO2 from the upgrading process 11!
Figure 1-6: Industrial sources of hydrogen and breakdown by use category _______________ 14! Figure 1-7: Potentially available industrial hydrogen in NRW as of 2008 (1000 Nm per day), _16! 3
Figure 1-8: Total production and potentially available hydrogen in North Rhine-Westphalia by
industry as of 2008 __________________________________________________ 17!
Figure 1-9: Questionnaire on total production and breakdown of hydrogen by use category __18! Figure 2-1: Common reactions of CO2 ____________________________________________ 22! Figure 2-2: Polymers from CO2 _________________________________________________ 23! Figure 2-3: Methanol-based chemistry: from raw materials to synthesis gases, methanol,
chemicals and fuels _________________________________________________ 24!
Figure 2-4: Scheme of process chains for Power-to-Gas (PtG) and Power-to-Fuels (PtF)
(BMVI 2014) _______________________________________________________ 27!
Figure 2-5: Electricity demand for H2 production by 2050 according to BAU and different
climate protection scenarios ___________________________________________ 32!
Figure 2-6: Fuel demand and theoretical amount of methane from Power-to-Gas as resulting
from the scenario B2/C2 in the long-term until 2050 _________________________ 34!
Figure 2-7: Different sources of CO2 and diverse utilization options for products ___________ 35! VI
Wuppertal Institute for Climate, Environment and Energy 2015
CO2 ReUse NRW
Figure 2-8: Hydrogen pipeline network in the Rhine-Ruhr area _________________________ 37! Figure 3-1: Future theoretical potential of CO2 utilization in NRW based on different cases ___ 43! Figure 3-2: Minimal energy demand for CO2 capture in dependence on the CO2
concentration ______________________________________________________ 45!
Figure 4-1: Structure of sustainability principles, criteria and indicators __________________ 53! Figure 4-2: Structure of the MCA process _________________________________________ 54! Figure 4-3: Decision matrix ____________________________________________________ 55! Figure 4-4: Contribution of individual life cycle phases to the global-warming potential for
pulverised coal power plants (PC) with and without CCS in China in 2030 _______ 58!
Figure 4-5: Results of selected non-GHG impact categories for PC (pulverised coal) and
IGCC (integrated gasification combined cycle) power plants with and without CCS
in China in 2030 ____________________________________________________ 58!
Figure 4-6: Resource categories and indicators of MIPS ______________________________ 59! Figure 4-7: Development of future levelised electricity generating cost (new plants) for
renewable energies and fossil fuel-fired power plants (with/without CCS) for price
trajectories A/C and C/A (CCS from 2020, including transport and storage) ______ 62!
Annex Figure A 1: Refineries in NRW (> 0.4 Mt CO2 per year) _______________________________ 92! Figure A 2: Coking plants in NRW (> 0.4 Mt CO2 per year) ____________________________92
Figure A 3: Cement and lime industry plants in NRW (> 0.4 Mt CO2 per year) _____________ 93!
Figure A 4: Iron and steel industry plants in NRW (> 0.4 Mt CO2 per year) ________________93
Figure A 5: Chemical industry plants in NRW (> 0.4 Mt CO2 per year) ___________________ 94!
Figure A 6: Waste-to-energy plants in NRW (> 0.4 Mt CO2 per year) ____________________94
Figure A 7: Natural gas power plants with CHP in NRW (> 0.4 Mt CO2 per year) ___________ 95! Figure A 8: Hard coal power plants with CHP in NRW (> 0.4 Mt CO2 per year) ____________95
Figure A 9: Power-to-Gas and hydrogen projects in Germany _________________________ 98!
Wuppertal Institute for Climate, Environment and Energy 2015
VII
Introduction
Introduction To achieve the national and global climate protection objectives, a full decarbonisation of all sectors in the energy system will be necessary in the long term until the turn of the century. While the transformation towards renewable energy sources is already well advanced in the electricity sector, approaches of extensive decarbonisation exist only isolated. This is despite the fact that the energy efficiency potential of the energy intensive industry has already been largely exhausted for economic considerations and compared to other sectors disproportionate savings have been achieved. Today the CO2 utilisation is discussed as one of the future low-carbon technologies. CO2 is separated from the flue gas stream of power plants and is prepared for further processing as raw material. Fossil resources will not only be used as fuel in the industrial sector but also as feedstock for production of different products (e.g. urea, fertilizer, polymer materials). CO2 containing gas streams from industrial processes exhibit a higher concentration of CO2 than, for instance, flue gases from power plants which contain for example a high percentage of nitrogen. On the one hand it is therefore obvious to use industrial CO2 sources as raw material for the chemical industry and for the synthesis of fuel on the output side. On the other hand, fossil resources can be replaced by substitutes of reused CO2 on the input side. If set up in the right way, this step into a CO2-based circular flow economy could make a contribution to the decarbonisation of the industrial sector and according to the adjusted potential, even rudimentarily to the energy sector. In this study the potential CO2 sources, the potential demand and the range of applications of CO2 are analysed by the case study of North Rhine-Westphalia (NRW). Since activation energy is needed for the reuse of CO2 and the utilisation usually depends on the use of hydrogen as a source of energy, it is necessary to view also regional sources and usage possibilities of hydrogen. NRW with its high density of (energy-intensive) industry is well suited for this analysis. At first, chapter one analyses the CO2 sources which are expected to be available in the middle-term (time frame until 2030) under the conditions of a stringent climate protection policy. Therefore, industrial point sources of the chemical industry, the iron and steel industry, the cement and lime industry, coking plants and refineries are considered as well as CO2 sources of large combined heat and power plants (hard coal and natural gas), waste incineration plants and biomethane plants. The potential CO2 streams are scrutinised quantitative (CO2 amount), qualitative (CO2 concentration) and on their regional distribution. Analogue industrial hydrogen sources are regarded concerning their available amount and their regional distribution. Chapter two considers current and potential utilisation options of CO2 and H2. Thereby, the utilisation as a chemical raw material is discussed as well as the synthesis to gaseous (Power-to-Gas) and liquid fuels (Power-to-Fuels). Furthermore, an overview about current projects and research activities is shown. In Chapter three the identified potentials of CO2 and H2 sources of chapter one are linked to the potential utilisation options (sinks) of chapter two. The concrete spectrum of theoretical potentials of reusing CO2 in NRW is estimated regarding a discussion about the preconditions and limits of appropriate paths of exploitation of CO2. Therefore, location issues are of Wuppertal Institute for Climate, Environment and Energy 2015
1
CO2 ReUse NRW
crucial importance as they influence the decision of the media (flue gas, separated CO2, H2, electricity, methane, raw materials, !) which has to be carried. To contribute to a sustainable development, CO2 value chains have to be not only technically stable, but also ecologically, economically and socially. Chapter four develops the methodological background for a systematic multi-criteria-analysis (MCA) of potential value chains of CO2 reusing1. Therefore, a general overview of different approaches for an integrated sustainability assessment of technologies and processes is given. Potential criteria which can be suitable for the evaluation of CO2 value chains are identified and exemplarily explained. Experiences of new technologies show that their successful implementation also depends on the acceptance of involved actors and the general public. Chapter five presents the results of an own qualitative survey based on freely available German and English documents, studies and publications with the subjects of awareness and acceptance of CO2 usage. Moreover specific articles, statements, party programs as well as strategy and conference papers are analysed in order to examine attitudes of political decision makers and chosen social actors (e.g. journalists). Based on this analysis, communication lacks are identified and appropriate methods and tools for a successful communication about CO2 utilisation are proposed. The final chapter six derives recommendations for a appropriate future designing of CO2 utilisation options out of the results of the previous chapters. The requirements of projects about research and development as well as demonstration are specified. Necessary political and economical aspects about the development of technologies as well as important holistic issues about the ecological tolerance and system integration are identified.
1
2
The concrete performance of the MCA is not object of this study. Wuppertal Institute for Climate, Environment and Energy 2015
Chapter 1
Sources of carbon dioxide (CO2) and hydrogen (H2)
1 Sources of carbon dioxide (CO2) and hydrogen (H2) 1.1 Industrial sources of carbon dioxide - qualities, quantities and regional distribution at European level with a special focus on NRW The power and industrial sectors currently account for almost half of the total GHG emissions in the EU. Many industrial processes like cement production, steelmaking, oil refining or chemical distillation processes, require vast inputs of fuel and energy rich feedstock and cause plenty of CO2-emissions. The following figure shows the biggest CO2-sources in Europe, including the emissions for the production of electrical energy. The size of the points represents the amounts of CO2-emissions. As you can see England, France, Germany and Poland are the countries with the largest and most aggregated CO2-sources of Europe.
Figure 1-1: CO2 emission sources in megatons (Mt) per year in Europe Source: (Geological Survey of Denmark and Greenland (GEUS) 2009)
In 2012 CO2 emissions from energy use in the EU27 added up to 3.439 gigatons (Gt). The states with the highest level of CO2 emissions in absolute terms in 2012 were Germany with 728 megatons (Mt), followed by the United Kingdom with 472 Mt, Italy with 366 Mt, France with 332 Mt, Poland with 297 Mt and Spain with 258 Mt. These six States accounted for more than 70 % of total EU27 CO2 emissions in 2012 (Eurostat 2013).
Wuppertal Institute for Climate, Environment and Energy 2015
3
CO2 ReUse NRW
The following analysis is based on the quantities and qualities of selected industrial and power plants and their flue gas emissions in North-Rhine-Westphalia (NRW). The analysis focuses on those CO2 sources that will prospectively still exist under a strict future climate protection regime (with a time horizon of about 2030). That implies that we primarily consider industrial sources because their plants and processes cannot easily be substituted by alternative technologies from the vantage point of the present2. In the power sector we only look at power plants with low specific CO2 emissions like waste-to-energy power plants3 and natural gas and hard coal power plants with combined heat and power (CHP4). The emission sources are characterised by the following criteria: 1. the annual amount of CO2 emissions, 2. the branch of the industrial emission sources and 3. the purity of CO2. Due to economies of scale and to keep the clearness in the figures we set a minimum threshold of 0.4 Mt of CO2 in the 2012 data of the PRTR register (PRTR 2012)5. Nevertheless may smaller plants probably also be suitable for CO2 utilisation projects, especially in early (pilot) states. Favourable conditions for even smaller CO2 reuse projects are a high purity of CO2 in the flue gas, a connection to an existing gas infrastructure or a CO2 needing process nearby. The total energy related emissions of CO2 in NRW are aggregated to 286.8 Mt in 2012, the industrial share accounts for 51.5 Mt or 18 % (LANUV NRW 2014). Figure 1-2 shows all industrial CO2 emission sources with a yearly output of more than 0.4 megatons (Mt) by branch. In total they amount for 42.4 Mt in 2012 equivalent to 82 % of the total industrial emissions in NRW. The selected industrial plants include the chemical branch, coke ovens, the iron and steel industry, the cement and lime industry and refinieries. The figure also shows waste-to-energy power plants as well as hard coal and natural gas fired power plants with combined heat and power (CHP), which emitted 46.0 Mt CO2. Most plants are located along the Rhine-area and in the Ruhr-area with the exception of one hard coal CHP plant in Ibbenbüren and the cement and lime facilities in the district of Soest in the eastern part of NRW.
2
3 4
5
4
This assumption applies especially for process-related CO2 emissions. But also the potential to reduce energy-related emissions (burning of fuels) are limited as the energy efficiency potentials in the energy intensive industry are already tapped for the most part. In Germany the renewable energy share of waste-to-energy plants is set on 50 % by convention. It can be assumed that the CHP plants will still exist in the coming decades because they are crucial for the (district) heat supply of many big cities. Nevertheless, the mix of their fuels and technologies will change towards lower specific CO2 emissions e.g. by the introduction of geothermal or solar energy or by Power-toHeat from renewable electricity. We assume that to meet CO2 reduction targets “dirty” plants will go out of the market at first when CCS is not allowed. PRTR: The Pollutant Release and Transport Register is an Open Data platform on the Internet which features a compilation of information about pollutants’ releases, the disposal of waste and emissions from diffuse sources. It allows users to search for facilities to see data on emissions released into the air and/or water by pollutants and sectors and waste generated through industrial activities. Wuppertal Institute for Climate, Environment and Energy 2015
Chapter 1
Sources of carbon dioxide (CO2) and hydrogen (H2)
Figure 1-2: Selected CO2 emission sources from industrial, waste-to-energy and CHP plants > 0.4 Mt/year in NRW Source: Own figure
The following table compiles the total CO2 emissions (in Mt/a), the coverage of CO2 emissions (in %), the numbers of plants, the medial CO2 concentration in the flue gas and the spatial focus of each branch. By selecting an emission threshold of at least 0.4 Mt CO2 per year, a high percentage of the total CO2 emissions in the respective branches in NRW is covererd6.
6
For biomethane upgrading plants (see excursus in chapter 1.2) no such threshold was set, because with an average CO2 release of 0.0036 Mt/a they are much smaller compared to industrial or power plants.
Wuppertal Institute for Climate, Environment and Energy 2015
5
CO2 ReUse NRW
Table 1-1: Overview of the selected branches and the key aspects considered by the analysis (State: 2012) Branch
Total CO2 emissions in Mt/a
Coverage of CO2 emissions in %
Numbers of plants
Medial CO2 concentration in the flue gas
Spatial focus
Iron and steel industry
14.8
91 %
6
3 - 27 %
Duisburg and surrounding cities
Refineries
8.1
100 %
4
3 - 13 %
Cologne area and Gelsenkirchen
Chemical industry
9.3
75 %
6
up to 100 %*
Alongside the River Rhine, cities of Gelsenkirchen and Marl
Cement and lime industry
7.9
86 %
10
25 %
District of Soest
Coking plants
2.3
100 %
2
1 - 5.4 % for coke oven gas
Duisburg and Bottrop
3 - 4 % for natural gas underfiring Industrial Plants
42.4
-
31
1 - 100 %
-
CHP power plant (hard coal)
35.3
78 %
11
14 %
Between the rivers Lippe and Ruhr
CHP power plant (natural gas)
8.0
94 %
6
3-4 %
Alongside the River Rhine
Waste-to-energy power plant
2.7
50 %
5
14 %
None
CHP & Waste-toenergy power plants
46.0
-
22
3 - 14 %
-
Biomethane upgrade plants
0.0417
100 %
12
40-44 %
Western part of NRW
(in the raw biogas)
* e.g. ethylene oxide- and NH3 production Source: (PRTR 2012), (Öko-Institut e.V 2012 p. 26), (Dechema 2008 p. 7), (UBA 2012 p. 30), (Dena 2013) and own estimates
In the chemical branch the purity of the CO2 emissions can reach 100 % (e.g. for ammoniaor ethylene oxide-production). In coke ovens the share of CO2 in the coke oven gas is between 1 to 5.4 %. But the relevant emissions balanced here originate from the underfiring process where natural gas is burned with typical CO2 concentrations in the flue gas of 3 - 4%. In spite of these low CO2 concentrations those emission sources are basically interesting because of their high shares of H2 and CH4 and the smaller share of CO. In the iron and steel industry the share of CO2 depends on the process and the energy source – blast furnace gas has up to 27 % CO2, if natural gas will be used the CO2 emissions in the flue gas 6
Wuppertal Institute for Climate, Environment and Energy 2015
Chapter 1
Sources of carbon dioxide (CO2) and hydrogen (H2)
is only about 3-4 %. In the cement and lime industry the share of CO2 in the flue gas is about 25 %. The concentration of CO2 in the flue gas of waste-to-energy plants and hard coal CHPplants is about 14 %, in the flue gas of CHP natural gas plants the concentration of CO2 is between 3 to 4 % (UBA 2012). To conclude in NRW there is a theoretically potential of yearly CO2 volume flows in the order of 42.4 Mt in the industrial sector (plant sizes > 0.4 Mt) and further 46 Mt from CHP and waste-to-energy power plants (> 0.4 Mt). Additionally biomethane upgrade plants could in total deliver ca. 41,700 t/a. However, although at first sight this seems to be a negligible order, those plants may be principally of interest, because they • • •
have a high CO2 concentration in the gas flow, are based on renewable energies and have the process of CO2 capture already integrated.
Due to those advantages the biomethane upgrade plants are dealt with in the following excursus (chapter 1.2). Nevertheless due to economy of scale those small plants may rather be suitable for pilot applications of CO2 utilisation.
1.2
Excursus: CO2 as byproduct of biomethane plants
Biogas is produced in Germany via fermentation of energy crops or agricultural, domestic or industrial residues. The raw gas contains of about 40 % to 45 % of CO2 (see Table 1-2) and is normally used onsite for the production of electricity and heat in CHP plants. Table 1-2: Composition of biomethane in dependency of substrate used
Vol.-% Energy Crops CH4 53 CO2 43.7 H2O 2.31 N2, H2, O2, H2S 0.99
Liquid manure 57 39.7 2.31 0.99
Source: (Urban et al. 2008)
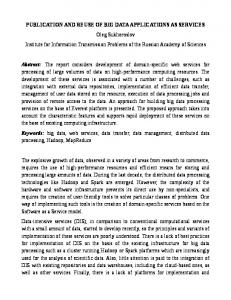
Biogas – and biomethane – additionally contain a long list of minor components. It has to be checked, whether there remain minor components as well in the CO2 stream after separation and in how far they are relevant to what kind of on-going process of CO2 usage. If the product gas shall be used not only on-site for the local production of power and heat, biogas can be upgraded to biomethane: if the gas gains the same composition as natural gas (see Figure 1-3), it can be fed into the natural gas grid and thus transported, stored and used at different locations further away.
Wuppertal Institute for Climate, Environment and Energy 2015
7
CO2 ReUse NRW
5(6+7"#4(.+82#$+%)%249+:2#-.+#2+2%.";1%.+
!"#$
5#14'+;%.13-'12".(/#)+
,#$-2%.."#)+
?")%+;%.13-'12".(/#)+
@(.+:##3")4+
,#$-2%.."#)+
,%-(2(/#)+
@(.+:##3")4+
1237.% %%!$?"4% 6(2(079:2%
)% &'(
!"#$"%
!:2@-9:2-23%
(2
"4
%
%$;)(*/0:)1.-.%
"4%
)2$#0-%") 4()IJK+'1 EF>
!"#$%$&'()'-0)'*)0A")$0+'/#A"%")8?