nutrients Article
Cocoa Diet Prevents Antibody Synthesis and Modifies Lymph Node Composition and Functionality in a Rat Oral Sensitization Model Mariona Camps-Bossacoma 1,2 , Mar Abril-Gil 1,2 , Sandra Saldaña-Ruiz 1,2 , Àngels Franch 1,2 , Francisco J. Pérez-Cano 1,2 and Margarida Castell 1,2, * 1
2
*
Department of Physiology, Faculty of Pharmacy, University of Barcelona, 08028 Barcelona, Spain;
[email protected] (M.C.-B.);
[email protected] (M.A.-G.);
[email protected] (S.S.-R.);
[email protected] (À.F.);
[email protected] (F.J.P.-C.) Nutrition and Food Safety Research Institute (INSA-UB), 08921 Santa Coloma de Gramenet, Spain Correspondence:
[email protected]; Tel.: +34-93-402-45-05; Fax: +34-93-403-59-01
Received: 12 February 2016; Accepted: 13 April 2016; Published: 23 April 2016
Abstract: Cocoa powder, a rich source of polyphenols, has shown immunomodulatory properties in both the intestinal and systemic immune compartments of rats. The aim of the current study was to establish the effect of a cocoa diet in a rat oral sensitization model and also to gain insight into the mesenteric lymph nodes (MLN) activities induced by this diet. To achieve this, three-week-old Lewis rats were fed either a standard diet or a diet with 10% cocoa and were orally sensitized with ovalbumin (OVA) and with cholera toxin as a mucosal adjuvant. Specific antibodies were quantified, and lymphocyte composition, gene expression, and cytokine release were established in MLN. The development of anti-OVA antibodies was almost totally prevented in cocoa-fed rats. In addition, this diet increased the proportion of TCRγδ+ and CD103+CD8+ cells and decreased the proportion of CD62L+CD4+ and CD62L+CD8+ cells in MLN, whereas it upregulated the gene expression of OX40L, CD11c, and IL-1β and downregulated the gene expression of IL-17α. In conclusion, the cocoa diet induced tolerance in an oral sensitization model accompanied by changes in MLN that could contribute to this effect, suggesting its potential implication in the prevention of food allergies. Keywords: cholera toxin; flavonoids; intestinal sensitization; nutraceutic; oral tolerance; ovalbumin; specific antibodies; Tγδ+ cells
1. Introduction Cocoa powder, derived from Theobroma cacao tree seeds, has a mixed composition of over 500 different compounds [1]. It contains macronutrients (carbohydrates, proteins, and lipids, both monounsaturated and saturated fatty acids), fiber (soluble and insoluble), minerals (calcium, cooper, magnesium, potassium), polyphenols (in particular it is rich in flavonoids such as epicatechin, catechin, and procyanidins), and methylxanthines (caffeine and theobromine) [2]. Today, cocoa powder and cocoa products are consumed worldwide [3] and different health benefits have been associated with their consumption [3–5]. Cocoa is a rich source of polyphenols, greater than that of tea and wine [3,6], with a potent antioxidant capacity [2,7] due to its phenolic hydroxyl groups [8]. Most of cocoa’s health properties have been attributed to its polyphenol content [3,7] and, in this context, modulation of allergic reactions by several flavonoids has been described [8,9]. Focusing on cocoa and the immune system, previous studies have demonstrated that a 10% cocoa diet has an immunomodulatory effect in the intestinal and systemic immune compartments in rats. Changes in the percentage of B lymphocytes and T cells, including T cell receptor (TCR)
Nutrients 2016, 8, 242; doi:10.3390/nu8040242
www.mdpi.com/journal/nutrients
Nutrients 2016, 8, 242
2 of 17
αβ+ cells, TCRγδ+ cells, T helper (Th), and T cytotoxic (Tc) cells in mesenteric lymph nodes (MLN), have been described [10,11]. In addition, cocoa diet influences immune functions by modulating cytokine synthesis in MLN cells [12] and attenuating the development of specific IgE, IgG1, IgG2a, IgG2c, and IgM antibodies after intraperitoneal immunization with ovalbumin [12,13]. Food allergies are abnormal immunological reactions to food proteins that generate a wide variety of immune changes and consequently different clinical symptoms and signs [14,15]. The main site of sensitization to food proteins is the gut-associated lymphoid tissue (GALT) [16], which can be classified into inductive sites (Peyer’s patches, isolated lymph nodes, and MLN) and effector sites (lymphocytes in the lamina propria and intestinal epithelium). With regard to unresponsiveness to food antigens, MLN are the primary site for the induction of oral tolerance [17]. Currently, food allergy is becoming a worldwide problem [18]. In particular, its prevalence is increasing in Westernized countries [19]. In this context, oral-sensitized animal models are of interest in order to assess its mechanisms and to evaluate therapeutic and nutritional interventions. Previously, we set up a model of oral sensitization consisting of the oral co-administration of the food allergen (ovalbumin; OVA) plus cholera toxin (CT) [20]. CT is an effective mucosal adjuvant that breaks down oral tolerance to co-administered protein antigens [21], altering some regulatory mechanisms of the intestinal mucosa [22,23], although the exact pathways involved are still unclear. Different approaches are used to treat or prevent oral sensitizations [24,25] and, in this sense, nutraceutics could have a potential role. Based on this background, the purpose of the present study was to establish the effect of cocoa consumption, with its recognized immunomodulatory activities, in a rat oral sensitization model. Likewise, in an attempt to gain insight into the mechanisms induced by a cocoa diet, the composition and functionality of cells in MLN were assessed. For these purposes, rats were fed with a 10% cocoa diet for four weeks and for the first three weeks were orally sensitized with OVA and CT. Immune responses were established by specific antibody response during the study as well as by MLN characterization at the end of the study. 2. Materials and Methods 2.1. Reagents Albumin from bovine serum (BSA), albumin from chicken egg white (OVA; grade V), CT, gelatine, peroxidase-conjugated extravidin, o-phenylenediamine (OPD), 30% hydrogen peroxide (H2 O2 ), fetal bovine serum (FBS), penicillin-streptomycin, glutamine, Folin-Ciocalteu phenol reagent, gallic acid monohydrate, L-asparagine monohydrate, L-arginine, folic acid, HEPES, and nystatin were purchased from Sigma-Aldrich (Madrid, Spain). Biotin-conjugated anti-rat IgG1, IgG2a, IgG2b, IgG2c, IgM, and IgA monoclonal antibodies were obtained from BD Biosciences (Madrid, Spain). Goat anti-rat IgA, its peroxidase-conjugated antibody, and rat IgA standard were provided by Bethyl Laboratories (Montgomery, TX, USA). Peroxidase-conjugated anti-rat Ig was from Dako Cytomation (Glostrup, Denmark). 2-β-mercaptoethanol, Na3 N, and paraformaldehyde were purchased from Merck (Darmstadt, Germany). Anti-rat monoclonal antibodies conjugated to a fluorochrome were provided from BD Biosciences (San Diego, CA, USA). Ketamine was obtained from Merial Laboratories S.A. (Barcelona, Spain) and xylazine from Bayer A.G. (Leverkusen, Germany). Dulbecco’s Modified Eagle Medium (DMEM)-GlutaMAX media and gentamicin were obtained from Gibco™ and RNAlater® from Ambion (Thermo Fisher Scientific, Barcelona, Spain). Natural Forastero cocoa was provided by Idilia Foods S.L. (formerly Nutrexpa S.L., Barcelona, Spain) and AIN-93M diet and basal mix by Harlan Teklad (Madison, WI, USA). 2.2. Animals and Diets Thirty-six female Lewis rats were purchased from Janvier Labs (Saint Berthevin, France) and maintained in polycarbonate pathogen-free cages (three rats per cage) with controlled conditions of temperature and humidity and in a 12:12 h light:dark cycle in the Faculty of Pharmacy’s animal facility.
Nutrients 2016, 8, 242
3 of 17
All experimental procedures were approved by the Ethical Committee for Animal Experimentation of the University of Barcelona (CEEA/UB ref.5988). After one week of acclimatization, three-week-old rats were randomly assigned into the following four groups: reference group (RF/R), reference cocoa group (RF/C), sensitized group (OVA/R), and sensitized cocoa group (OVA/C), as detailed in Table 1. Table 1. Experimental design. Group
Oral Administration Days 0, 2, 4, 7, 9, 11, 14, 16, 18, and 21
Diet
RF/R (n = 9) RF/C (n = 9) OVA/R (n = 9) OVA/C (n = 9)
Vehicle (1 mL/rat) Vehicle (1 mL/rat) 50 mg OVA + 30 µg CT/rat 50 mg OVA + 30 µg CT/rat
AIN-93M 10% cocoa AIN-93M 10% cocoa
The oral sensitization was performed as previously described [20]. Briefly, rats received orally 50 mg of OVA with 30 µg of CT as adjuvant in 1 mL of distilled water, three times per week (Monday, Wednesday, and Friday) for three weeks. RF/R and RF/C groups received 1 mL of vehicle on the same days. During the 28 days of the study, animals were given free access to water and food. AIN-93M formula was used as the standard diet and a cocoa-enriched diet was produced with the addition of 100 g of defatted cocoa powder to 900 g of a basal mix, the resulting composition finally providing an isoenergetic chow. The two experimental diets provided similar amounts of proteins, lipids, and carbohydrates (Table 2). Table 2. Composition of the diets. Components Carbohydrates Proteins Lipids Fiber Micronutrients Flavonoids 1 Theobromine Total
Reference Diet
10% Cocoa Diet
AIN-93M (g/kg Diet)
Basal Mix (g/kg Diet)
Cocoa Powder (g/kg Diet)
721.9 140.8 38.7 50 48.6 0 0 1000
692.5 118.2 27 24.5 37.8 0 0
16.8 23.1 11.5 35.6 6.3 4.02 2.5 1000
1
total polyphenol content was determined according to the Folin–Ciocalteu method. The cocoa used in this study contained 40.18 mg/g of total polyphenols (expressed as catechin). Reversed-phase high performance liquid chromatography coupled to a diode array detector revealed that cocoa contained 2.34 mg/g epicatechin and 0.4 mg/g catechin.
2.3. Sample Collection and Processing Blood samples were collected weekly from the beginning of the study. After centrifugation, serum was obtained and frozen at ´20 ˝ C until antibody quantification. One week after the last oral administration, rats were anaesthetized with ketamine/xylazine (90 mg/kg/10 mg/kg) and exsanguinated. Urine was collected directly from the urinary bladder with the help of a syringe, and the small intestine and MLN were carefully dissected. In sterile conditions, MLN were passed through a sterile mesh cell strainer (40 µm, Thermo Fisher Scientific) and the resulting cell suspension was centrifuged (538 g, 5 min, 4 ˝ C) and resuspended with RPMI 1640 medium supplemented with 10% heat-inactivated FBS, 100 IU/mL streptomycin-penicillin, 2 mM L-glutamine, and 0.05 mM 2-β-mercaptoethanol. Cell counting and viability were assessed by Countess™ Automated Cell Counter (Invitrogen™, Thermo Fisher Scientific). Some isolated lymphocytes from MLN were stained to be analyzed by flow cytometry (explained
Nutrients 2016, 8, 242
4 of 17
below). Other MLN cells were stimulated in vitro to promote cytokine release and the remaining cells were kept in RNAlater® until gene expression analysis. MLN cells were stimulated in vitro by culturing 3 ˆ 106 cells/mL in DMEM supplemented with 10% heat-inactivated FBS, 36 mg/L L-asparagine monohydrate, 116 mg/L L-arginine, 10 mg/L folic acid, 500 mg/L HEPES, 10 mg/mL gentamicin, 10,000 U/mL nystatin, 100 U/mL streptomycin-penicillin, and 0.05 mM 2-β-mercaptoethanol. At the same time, a specific stimulus was added (OVA, 10 µg/mL) and, after 72 h, supernatants were collected to assess cytokine production. The proximal part of the small intestine was opened lengthwise, cut into small pieces, weighed, and incubated in a shaker at 37 ˝ C. After centrifugation, supernatants were collected, aliquoted, and stored at ´80 ˝ C until cytokine and IgA quantification. 2.4. Determination of Total Polyphenol Content Total phenolic content was determined according to Folin–Ciocalteu’s method. Briefly, 250 µL of Folin–Ciocalteau’s reagent and 1.25 mL of 20% Na2 CO3 solution were added to 500 µL of diluted urine. After 2 h at room temperature, the absorbance was measured at 765 nm. A standard curve prepared with gallic acid was used. 2.5. IgA and Specific Anti-OVA Antibodies Total serum and intestinal IgA from intestinal lavage were quantified by a sandwich enzyme-linked immunosorbent assay (ELISA), as previously described [26]. Specific anti-OVA antibody (total anti-OVA antibodies and anti-OVA IgG1, IgG2a, IgG2b, IgG2c, IgM, and IgA isotypes) levels were measured by an indirect ELISA. In brief, 96-well polystyrene plates (Nunc Maxisorp® , Wiesbaden, Germany) were coated overnight at room temperature with 10 µg/mL of an OVA solution in carbonate buffer (pH 9.6). The plates were washed and blocked with 0.5% gelatin. Afterwards, appropriately diluted samples and standards were added for 3 h. In order to assess total anti-OVA antibodies, peroxidase-conjugated anti-rat Ig and OPD-H2 O2 solution were added. To quantify specific anti-OVA Ig isotypes, biotin-conjugated anti-rat IgG1, IgG2a, IgG2b, IgG2c, IgM, or IgA monoclonal antibodies were used and, thereafter, peroxidase-conjugated extrAvidin and an OPD-H2 O2 solution were added. Absorbance was measured in a microplate photometer (LabsystemsMultiskan, Helsinki, Finland) at 492 nm and data was interpolated by Ascent v.2.6 software (Thermo Fisher Scientific). The relative anti-OVA antibody concentration was calculated giving the value of 1 to the mean value obtained from samples from the RF/R group tested in the same conditions and, therefore, all values were expressed as an increase of the mean value of RF/R group. 2.6. Immunofluorescence Staining and Flow Cytometry Analysis Lymphocytes from MLN (5 ˆ 105 cells) were stained using mouse anti-rat monoclonal antibodies conjugated to fluorescein isothiocyanate (FITC), phycoerythrin (PE), peridininchlorophylla protein (PerCP), or allophycocyanin (APC). The antibodies used were anti-CD4, anti-CD8α, anti-CD8β, anti-TCRαβ, anti-TCRγδ, anti-NKR-P1A, anti-CD62L, anti-CD25, and anti-CD103. Cells were incubated with a mixture of saturating concentrations of antibodies in PBS containing 2% FBS and 0.1% Na3 N, at 4 ˝ C in darkness for 20 min. After washing, cells were fixed with 0.5% p-formaldehyde and stored at 4 ˝ C in darkness until analysis by flow cytometry. A negative control staining using an isotype-matched monoclonal antibody was included in each cell sample. Analyses were performed with a Gallios™ Cytometer (Beckman Coulter, Miami, FL, USA) in the Scientific and Technological Centers of the University of Barcelona (CCiTUB). 2.7. Gene Expression from MLN Lymphocytes Lymphocytes from MLN were kept in RNAlater® until analysis. On the day of RNA extraction, lavages with PBS were performed to remove RNAlater® . Immediately, cells were homogenized in a
Nutrients 2016, 8, 242
5 of 17
vortex for 2 min. Total RNA was extracted by RNeasy® mini kit (Qiagen, Madrid, Spain) in accordance with the manufacturer’s instructions. RNA quantification was performed with a NanoPhotometer (BioNova Scientific, CA, USA) and reverse-transcribed with TaqMan® Reverse Transcription Reagents (Applied Biosystems, Thermo Fisher Scientific) [27]. Real-time PCR assays (ABI Prism 7900 HT, AB) were performed using specific PCR TaqMan® primers (Applied Biosystems): OX40L (Rn00585582_m1, Inventoried (I)), NF-κB (Rn01399572_m1, I), CD11c (Rn01511082_m1), IL-1β (Rn00580432_m1), IL-12 (Rn00584538_m1), IL-17α (Rn01757168_m1, I), and IL-33 (Rn01759835_m1). The expression of HPRT1 (Rn01527840_m1) was used to normalize the quantification of the studied genes. Relative gene expression levels were calculated using the 2´∆∆Ct method, as previously described [20]. The relative mRNA level was calculated giving the value of 1 to the mean value obtained from samples from the RF/R group tested in the same conditions. 2.8. Cytokine Quantification Interleukin (IL) 4, IL-10, interferon (IFN) γ, and tumor necrosis factor (TNF) α were quantified by BD™Cytometric Bead Assay Rat Soluble Protein Flex Set (BD Biosciences, Madrid, Spain) as detailed in previous studies [13]. 2.9. Statistical Analysis Data are expressed as means ˘ standard error. All statistical analyses were performed with IBM Social Sciences Software Program (SPSS, version 22.0, Chicago, IL, USA). Levene’s test was performed to assess variance equality, followed by Kolmogorov–Smirnow to determine its distribution. When the results demonstrated equality of variance and normal distribution, a two-way ANOVA test was performed (oral sensitization and diet). When the interaction between oral sensitization and diet was statistically significant, Bonferroni’s post hoc test was performed between groups. Otherwise, when the results had high variance and/or non-normal distribution (food and water intake, anti-OVA antibody concentration, cytokine concentration in MLN cell supernatants), non-parametric tests, such as Kruskal–Wallis and Mann–Whitney U tests were performed. When p < 0.05, statistical difference was considered significant. 3. Results 3.1. Food and Water Intake, Flavonoid Absorption and Body Weight Food and water intake were monitored throughout the study (Table 3). No differences were found among groups (established by Kruskal–Wallis and Mann–Whitney U tests). Total polyphenol concentration was quantified in urine samples at the end of the study. Rats fed standard diet showed values ranging between 3.16 and 18.6 µg/mL (mean ˘ standard error, 10.12 ˘ 1.63). Cocoa-fed animals had concentrations significantly higher ranging between 26.1 and 61.8 µg/mL (35.86 ˘ 3.24) (diet effect p = 0.000 by two-way ANOVA; no significant effect of oral sensitization, p = 0.079, or interaction, p = 0.960). Body weight (Table 3) increased progressively during the study (time effect p = 0.000 by two-way ANOVA) and oral sensitization did not affect it (p = 0.873 by two-way ANOVA). However, the cocoa diet produced a slower growth (p = 0.000 by two-way ANOVA). No significant interactions were found between oral sensitization and diet or time, between diet and time, or between oral sensitization, diet, and time.
Nutrients 2016, 8, 242
6 of 17
Table 3. Body weight (g) and food and water intake (g/100 g rat/day) from the four groups over the study. Data represent mean ˘ standard error (n = 9 for body weight, n = 3 for water and food intake established in each cage). Statistical difference: * means statistical significant difference induced by the diet by two-way ANOVA (p < 0.001). Day 0 0–7 0–7 7 7–14 7–14 14 14–21 14–21 21 21–28 21–28 28
Group 1
Variable Body weight Food intake Water intake Body weight Food intake Water intake Body weight Food intake Water intake Body weight Food intake Water intake Body weight
RF/R
RF/C
OVA/R
OVA/C
59.9 ˘ 4.27 10.38 ˘ 2.35 12.06 ˘ 0.17 92.7 ˘ 6.05 11.65 ˘ 0.97 9.68 ˘ 0.90 129.04 ˘ 5.96 9.63 ˘ 1.03 9.12 ˘ 0.26 154.29 ˘ 3.72 6.79 ˘ 1.86 9.11 ˘ 0.10 174.13 ˘ 3.23
59.78 ˘ 4.58 13.46 ˘ 1.12 23.85 ˘ 4.03 82.28 ˘ 5.30 * 13.05 ˘ 0.51 21.08 ˘ 3.11 107.82 ˘ 5.84 * 11.12 ˘ 0.95 17.26 ˘ 0.09 133.80 ˘ 5.24 * 9.74 ˘ 0.51 14.99 ˘ 0.53 153.32 ˘ 5.67 *
60.86 ˘ 4.24 9.72 ˘ 2.50 12.06 ˘ 1.81 94.00 ˘ 5.88 11.72 ˘ 1.04 10.68 ˘ 0.65 129.03 ˘ 6.06 9.07 ˘ 0.92 9.13 ˘ 0.38 152.73 ˘ 5.67 6.82 ˘ 1.99 10.24 ˘ 0.96 171.61 ˘ 4.35
58.62 ˘ 4.16 13.43 ˘ 0.82 23.04 ˘ 3.04 80.90 ˘ 4.80 * 12.77 ˘ 0.33 22.64 ˘ 2.10 109.35 ˘ 4.53 * 11.24 ˘ 0.12 21.39 ˘ 0.99 135.55 ˘ 4.63 * 8.8 ˘ 1.36 25.45 ˘ 4.04 150.53 ˘ 2.57 *
1
Groups: RF/R (reference group: vehicle and AIN-93M diet); RF/C (reference cocoa group: vehicle and 10% cocoa diet); OVA/R (sensitized group: OVA plus CT and AIN-93M diet); and OVA/C (sensitized cocoa group: OVA plus CT and 10% cocoa diet).
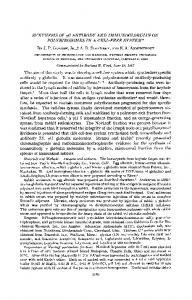
3.2. Immune Response to OVA: Serum Anti-OVA Antibodies As shown in Figure 1a, specific total anti-OVA antibodies appeared progressively with the oral sensitization process in the OVA/R group, there being a 7.4-, 82.5-, 75.5-, and 424.5-fold increase with respect to the RF/R group at days 7, 14, 21, and 28, respectively. At the end of the study, total anti-OVA antibodies concentration in the OVA/R group was significantly higher than that in the RF/R group (p = 0.038 by Mann–Whitney U test). A total of 78% of animals of the OVA/R group developed antibodies established as mean value of RF/R group plus 2 ˆ SD. On the contrary, levels in the OVA/C group throughout the study were quite similar to those found in the RF/R and RF/C groups (ranging between 1.5- and 3.4-fold increase with respect to the RF/R group) and were significantly lower than those found in the OVA/R group (p = 0.035 by Mann–Whitney U test on day 28). Isotypes of serum anti-OVA antibodies were determined at the end of the study when results could be analyzed with higher sensitivity (Figure 1b). Although no detectable levels of specific IgG2c and IgA were found, the oral sensitization procedure led to the production of anti-OVA IgG1, IgG2a, IgG2b and IgM in such a way that levels were IgG1 (477.8-fold increase of RF/R group) > IgG2a (292.6-fold increase of RF/R group) >> IgG2b (13.9-fold increase of RF/R group) > IgM (2.0-fold increase of RF/R group). These concentrations were significantly higher than those found in the RF/R group (p = 0.000, p = 0.002, p = 0.000, p = 0.041 for IgG1, IgG2a, IgG2b, and IgM, respectively, according to Mann–Whitney U test). In comparison with the OVA/R group, the cocoa-enriched diet significantly attenuated the increase of anti-OVA IgG1, IgG2b, and IgM (p = 0.016, p = 0.000, p = 0.000 by Mann–Whitney U test, respectively) in such a way that concentrations ranged between a 0.5-fold increase for IgM and a 17.9-fold increase for IgG1 of the RF/R group. With regard to IgG2a, although the cocoa diet values were more than 10 times lower than those in the OVA/R group, no statistically significant difference was found with respect to this group (p = 0.164 by Mann–Whitney U test). Anti-OVA antibodies were also analyzed in intestinal lavage but these results were under the limit of detection.
anti‐OVA Ab [fold increase]
(p = 0.038 by Mann–Whitney U test). A total of 78% of animals of the OVA/R group developed antibodies established as mean value of RF/R group plus 2 × SD. On the contrary, levels in the OVA/C group throughout the study were quite similar to those found in the RF/R and RF/C groups Nutrients 2016, 8, 242 7 of 17 (ranging between 1.5‐ and 3.4‐fold increase with respect to the RF/R group) and were significantly Nutrients 2016, 8, 242 7 of 17 lower than those found in the OVA/R group (p = 0.035 by Mann–Whitney U test on day 28). error (n = 9). Statistical differences: p > IgG2b (13.9‐fold increase of RF/R group) > IgM (2.0‐fold 0 7 14 21 28 increase of RF/R group). These concentrations were significantly higher than those found in the RF/R Days (b) group (p = 0.000, p = 0.002, p = 0.000, p = 0.041 for IgG1, IgG2a, IgG2b, and IgM, respectively, 10000 according to Mann–Whitney U test). 1000 In comparison with the OVA/R group, the cocoa‐enriched diet significantly attenuated the 100 # increase of anti‐OVA IgG1, IgG2b, and IgM (p = 0.016, p = 0.000, p = 0.000 by Mann–Whitney U test, respectively) in such a way 10that concentrations ranged between a 0.5‐fold increase for IgM and a # # 1 17.9‐fold increase for IgG1 of the RF/R group. With regard to IgG2a, although the cocoa diet values were more than 10 times lower than those in the OVA/R group, no statistically significant difference IgG1 IgG2a IgG2b IgM was found with respect to this group (p = 0.164 by Mann–Whitney U test). Day 28 Anti‐OVA antibodies were also analyzed in intestinal lavage but these results were under the Figure 1. Serum anti-OVA antibodies. (a) Total anti-OVA antibody levels throughout the study; limit of detection. Figure 1. Serum anti‐OVA antibodies. (a) Total anti‐OVA antibody levels throughout the study; (b)
(b) anti-OVA IgG1, IgG2a, IgG2b, IgM at the end of the study. Values are expressed as mean ˘ standard
anti‐OVA IgG1, IgG2a, IgG2b, IgM at the end of the study. Values are expressed as mean ± standard error (n = 9). Statistical differences: φ p < 0.05 compared with RF/R group, and # p < 0.05 compared
3.3. Total IgA Antibodies: Serum and Intestinal Concentrations with OVA/R group by Mann–Whitney U test. Groups: RF/R = reference group; RF/C = reference group fed cocoa diet; OVA/R = sensitized group; OVA/C = sensitized group fed cocoa diet.
To assess the influence of oral sensitization on the main intestinal immunoglobulin, serum and intestinal IgA concentrations were quantified at the end of the study (Figure 2). In both cases, oral 3.3. Total IgA Antibodies: Serum and Intestinal Concentrations sensitization did not significantly modify the IgA concentration (p = 0.564 and p = 0.830 for serum To assess the influence of oral sensitization on the main intestinal immunoglobulin, serum and and intestinal values, respectively, by two‐way ANOVA). However, the 10% cocoa diet produced a intestinal IgA concentrations were quantified at the end of the study (Figure 2). In both cases, oral significant decrease in the IgA levels (p = 0.000 in both cases by two‐way ANOVA), that was more sensitization did not significantly modify the IgA concentration (p = 0.564 and p = 0.830 for serum values, respectively, by two-way ANOVA). However, the 10%was cocoa found diet produced a marked and in intestinal the intestinal compartment. No significant interaction between oral significant decrease in the IgA levels (p = 0.000 in both cases by two-way ANOVA), that was more sensitization and diet (p = 0.074 and p = 0.525 for serum and intestinal values, respectively, by marked in the intestinal compartment. No significant interaction was found between oral sensitization two‐way ANOVA). and diet (p = 0.074 and p = 0.525 for serum and intestinal values, respectively, by two-way ANOVA).
(a) Serum IgA (ng/mL)
6000
*
*
4000
2000
0 Day 28
Intestinal IgA (g/g tissue)
(b)
8000
6
RF/R RF/C OVA/R OVA/C
5 4 3 2 1
* *
0 Day 28
Figure 2. Serum (a) and intestinal (b) IgA concentrations at the end of the study. Values are expressed
Figure 2. Serum (a) and intestinal (b) IgA concentrations at the end of the study. Values are as mean ˘ standard error (n = 9). Statistical difference: * means statistical significant difference induced expressed ± standard error = 9). Statistical * means significant by as the mean diet by two-way ANOVA (p < (n 0.001). Groups: RF/R =difference: reference group; RF/C = statistical reference group difference the diet by two‐way ANOVA (p