Mohd Abdul Hameed et al. / International Journal on Computer Science and Engineering (IJCSE)
Collaborative Filtering Based Recommendation System: A survey Mohd Abdul Hameed, , Dept. of CSE University College of Engg Osmania University Hyderabad 500007, AP, India
[email protected]
Omar Al Jadaan Medical and Health Sciences University Ras Al-Khaimah United Arab Emirates
[email protected]
S. Ramachandram, Dept. of CSE University College of Engg Osmania University Hyderabad 500007, AP, India
[email protected] Abstract—the most common technique used for recommendations is collaborative filtering. Recommender systems based on collaborative filtering predict user preferences for products or services by learning past user-item relationships from a group of user who share the same preferences and taste. In this paper we have explored various aspects of collaborative filtering recommendation system. We have categorized collaborative filtering recommendation system and shown how the similarity is computed. The desired criteria for selection of data set are also listed. The measures used for evaluating the performance of collaborative filtering recommendation system are discussed along with the challenges faced by the recommendation system. Types of rating that can be collected from the user to rate items are also discussed along with the uses of collaborative filtering recommendation system. Keywords Algorithms,recommendation,filtering,rating,measure I.
INTRODUCTION
Collaborative Filtering is the process of filtering or evaluating items using the opinions of other people. This filtering is done by using profiles. Collaborative filtering techniques collect and establish profiles, and determine the relationships among the data according to similarity models. The possible categories of the data in the profiles include user preferences, user behavior patterns, or item properties. A. Differences between content based filtering and collaborative filtering systems are Content based filtering algorithms are based on the assumption that users are going to give similar rating to object with similar objective features[1]. Collaborative filtering algorithms are on the assumption that people with similar taste will rate thing similarly. Content based filtering requires content to analyze using an appropriate model, it can be difficult to obtain the content analyze and represent. Collaborative filtering algorithms do not require content [2]. Content based filtering algorithms recommends the items that match up the user profile, it does not recommends the items that do not match up user profile even though they are very similar to items matching up the profile. Collaborative filtering algorithms recommend all items that are similar to the given item.
ISSN : 0975-3397
Vol. 4 No. 05 May 2012
859
Mohd Abdul Hameed et al. / International Journal on Computer Science and Engineering (IJCSE)
B. Drawbacks of content based filtering algorithms There are two major drawbacks to the use of content based filtering systems. • The first drawback is some items do not have intrinsic content, because content–based systems are primarily document classifiers, and don’t generally work with other types of items like movies, restaurants, etc. • The second problem is that they may be too restrictive may not be able generalize sufficiently because they are primarily designed to return items similar to those already rated by the user, there is a chance that a user may miss out on interesting items outside the range of documents they have already rated.. C. Advantages of Collaborative filtering Algorithms • Collaborative filtering Algorithms do not require contents to be analyzed. • Collaborative filtering Algorithms does not spend time on developing language, analyzing document, developing parsing tools and word stemming algorithms, it focus on the clustering algorithms. • Collaborative filtering Algorithms does not store huge amounts of term frequency data for each user and document, it creates user profiles and item profile. User profile which are defined by the user’s ratings for the items he has rated, rather than probability figures for very word in the English language. Item profile consists solely of the item’s actual content. II.
COLLABORATIVE FILTERING SYSTEM FUNCTIONALITIES
The functionalities of Collaborative filtering recommendations system can be stated as A. Recommendations and predictions 1) Recommendation Recommendations functionality displays a list of items to a user. The items are listed in the order of usefulness to the user. For example Amazon’s recommendation algorithm aggregates items similar to a user’s purchases and ratings without ever computing a predicted rating [3]. 2) Prediction In prediction a calculation of predicted rating is made for a particular item. Prediction is more demanding that recommendations because in order to make predictions the system must be able to say something about required item. Some algorithms take advantage of this to be more scalable by saving memory and computation time [3, 4]. B. Prediction versus Recommendation • Prediction and Recommendation tasks place different requirements on a CF system. • To recommend items, information regarding all items is not required. To provide predictions for a particular item, information regarding every item, even rarely rated ones is required • The Algorithms used for recommendations have less memory and computation time requirements when compared to algorithms used for making predictions. • Recommendation tasks require calculation of predictions or some scoring function for many (if not all) items. Therefore a single prediction request can afford a more expensive prediction calculation than a recommendation request. III.
CHALLENGES AND PROBLEMS OF COLLABORATIVE FILTERING
A. Challenges Challenges faced by collaborative filtering algorithms are 1) Sparsity of data When recommendations system are used for large number of products then the size of user-item matrix become large and sparse thus it becomes challenging to make recommendations and to maintain the performance of recommendations. The cold start problem is an example of data sparsity problem when a new user or item has just entered the system; it is difficult to find similar ones because there is not enough information [5, 6]. 2) Increase in the number of users and items Scalability problem occurs when the number of users and items grows tremendously .There will not be adequate computational resources to meet the new demands. 3) Similar items Some items will be categorized as different items by recommendation system because of difference in name this situation is addressed as synonymy problem. 4) Graysheep Some users will not consistently agree or disagree with any group of people these users are called Graysheep, they cannot take the advantage of collaborative filtering techniques. 5) Blacksheep
ISSN : 0975-3397
Vol. 4 No. 05 May 2012
860
Mohd Abdul Hameed et al. / International Journal on Computer Science and Engineering (IJCSE)
Blacksheeps are opposite group of people who are not in favor of recommendation system concept. 6) False recommendations When there is no restriction on who can make recommendations many companies (workers) loads the recommendation system with thousands of recommendations for their products and negative recommendations for their competitors. 7) Privacy People do not like intrusion in their lifestyle they do not want their habits, preferences, taste, views to be made public. To protect against this, security techniques are developed based on encryption and shared keys [7]. Where a user can encrypt their ratings and peers can tally encrypted ratings. Once ratings are totaled, distributed agents use shared keys to decrypt the rating tallies, without being able to see the original ratings. B. Problems If few ratings are available for user or items collaborative filtering algorithms will not make correct recommendation. Steps must be taken to overcome these problems by incorporating few adjustments for users, items, and user and item pairs with few co-ratings some adjustments for rarely-rated entities are 1) Setting threshold for rating A threshold will be set up for rating if the value of rating is greater than the threshold then we take that user/items in consideration for predicting recommendations ex in user-based algorithm, all neighbors will be discarded who have fewer than k co-ratings with the target user. 2) Rarely-rated entities The rarely-rated entities are adjusted by pulling them closer to an expected mean. Users with few co-ratings may be adjusted closer to 0 in Pearson similarities. The adjustment amount is inversely proportional to the number of ratings in collaborative filtering. 3) Prior belief Skewing of data can be avoided by incorporating artificial data points that match an expected distribution. For example, if we believe that user’s ratings will generally match a probability distribution p. This prior belief can be incorporated into user correlation calculation by including k artificial co-rated items whose ratings are independently drawn from p. IV.
SIMILARITY COMPUTATIONS IN COLLABORATIVE FILTERING ALGORITHMS
The most critical step in memory based collaborative filtering techniques is the computation of similarity between user or items, for item based collaborative filtering we first compute the similarity between item i and item j first and then identify the users who have rated both these items and a similarity computation is done to determine the similarity between co-rated items of uses, for user based collaborative filtering algorithms the similarity Wx,y between the user x, user y who have already rated the items is calculated first.There are many different methods to compute similarity or weight between users or items. A. Correlation based similarity Correlation based similarity measures can be used for computing similarity between two users x and y or between two items i and j. ex is pearson correlation measures the extent to which two variables linearly relate to one another [8]. Pearson correlation measures for users are given as in (2).
ru ,i ru rv, j rv iI
wu ,v
ru ,i ru rv, j rv iI iI 2
2
(1)
Pearson correlation measures for items is given as
wi , j
r
uU
r
uU
u ,i
u ,i
ri ru , j rj
ri
2
r iI
u, j
rj
2
(2)
Other correlation-based similarities include constrained pearson correlation, a variation of pearson correlation that uses midpoint instead of mean rate. Spearman rank correlation, similar to pearson correlation, except that
ISSN : 0975-3397
Vol. 4 No. 05 May 2012
861
Mohd Abdul Hameed et al. / International Journal on Computer Science and Engineering (IJCSE)
the ratings are ranks and kendall’s τ correlation, similar to the spearman rank correlation, but instead of using ranks themselves, only the relative ranks are used to calculate the correlation. B. Vector cosine similarity In vector cosine similarity documents are treated as vectors of words frequency and similarity between two documents is measured by computing the cosine of the angle formed by frequency vectors [9]. We can adapt vector cosine based similarity for collaborative filtering by treating users or items as document and rating instead of word frequency. If R is mxn matrix then the similarity between two items i and item j can be computed as the cosine of the n dimensional vector corresponding to ith and jth column of matrix R (3). _
i*j _ wi , j cos i , j _ || i || * || j ||
(3)
To get the desired similarity computed for n items an nxn similarity matrix is computed. If a vector A={x1,y1}, vector B={x2,y2}then the vector cosine similarity between A and B is given as in (4) x1 x2 y1 y 2 A*B w A, B cos A , B 2 || A || * || B || x1 y12 x22 y 22 (4) V.
CATEGORIZATION OF COLLABORATIVE FILTERING ALGORITHMS
The collaborative filtering algorithms are categorized as 1. Memory based Recommendations 2. Model based Recommendations 3. Hybrid Recommendations 4. Recommendations based Probabilistic algorithms 5. Recommendations based Non-probabilistic A. Memory based Recommendation Memory based Recommendation generalizes from memory based data at the time of making memory based learning it is also referred as lazy learning. In memory based learning users are divided into groups based on their interest. When a new user comes into system we determine neighbors of users to make predictions for him. Memory based recommendation uses entire or sample of user item database to make predictions. Basically the memory based collaborative filtering can be represented in two ways according to breese[2]. 1. Neighbor based collaborative filtering 2. Top N Recommendation 1) Neighbor based collaborative filtering In order to obtain predictions and recommendations to neighbor–based collaborative filtering we chose a subset of neighbors of active users the criteria for choosing a subset is based on the similarity of users with active users then we compute the weighted aggregate for their rating to generate recommendations [10]. Neighbor–based collaborative filtering consists of the three main steps. In first step all users will be weighted and similarity is computed with respective to the active user. In the second step subsets of user called as predictors will be selected. In the third step rating is normalized and the weights of selected neighbors are combined with rating to make prediction. a) User-Based Nearest neighbor algorithms User-based nearest neighbor algorithms generated predictions for users based on ratings from similar users called as neighbors .If a user n is similar to a user u, we say that n is a neighborof u. user-based algorithms generate a prediction for an item i by analyzing ratings for ifrom users in u’s neighborhood. by using the following formula (5).
userSim(u , n)
iCRu ,n
i CRu ,n
ISSN : 0975-3397
r
ui
r u rni r n
(rui r u )
2
Vol. 4 No. 05 May 2012
i CRu , n
(rni r n ) 2
(5)
862
Mohd Abdul Hameed et al. / International Journal on Computer Science and Engineering (IJCSE)
userSim()is calculated by using the pearson correlation. The pearson correlation coefficient is calculated by comparing ratings for all items rated by both the target user and the neighbor as given in (6).
pred u , i ru
n neighbors u userSimu, n .r r n neighbors u userSimu, n
ni
(6)
n
Above formula calculates pearson correlation coefficient between user u and neighbor n, where CRu,n. denotes the set of co-rated items between u and n.Pearson correlation ranges from 1.0 for users with perfect agreement to -1.0 for perfect disagreement users [4,11]. CHALLENGES OF USER-BASED ALGORITHMS Skewing occurs when the number of user who has rated a common items are few Pearson coefficient fails to incorporate global agreement. The negative correlations in are not valuable in increasing prediction accuracy correlations.
Pearson coefficient
To calculate neighbors efficiently the amount of memory and time increase linearly with the increase in number of users and items. In order to reduce memory and time consumption we can use sub sampling by selecting a subset of users before a prediction is made and clustering algorithms where a user is compared with a group of users rather than a single user. b) Item-Based Nearest Neighbor Algorithms Item-based algorithms generate predictions based on similarities between items [12]. Items are prediction based on a user’s ratings for similar items. Item based algorithms are transpose of user based algorithms. A prediction for a user u and item i is composed of a weighted sum of the user u’s ratings for items most similar to i where itemSim()is a measure of item similarity, but not user similarity.ItemSim() is calculated using (7)
itemSim (i, j )
uCRBi , j
u RBi , j
r
ui
(rui r u )
r u rni r n
2
u RBi , j
( rnj r u ) 2
(7)
Adjusted-cosine similarity, similarity metric is used to compute item similarity by using all users who have rated both item i and j as in (8). RBi,j denotes the set of users who have rated both item iand item j. pred u, i
j ratedItems u itemSimu, n.i j .rui j ratedItems u itemSimi, j
(8)
CHALLENGES OF ITEM-BASED ALGORITHMS
Skewing occurs when there are few items co rated by users.
As the number of items increases the size of the model increases we can reduce the size by only storing correlations for item pairs with more than k co- ratings, by pruning many of the correlations it becomes difficult to make a prediction for a given target item and user, since the items correlated with the user’s ratings may not contain the target item.
2) Top N Recommendations In Top N Recommendations system the set of top N ranked item that will be of interest to a certain user will be recommended [13]. a) User based Top N Recommendations Algorithms The first step in user based top n recommendations is to identify the k most similar users to the active user by either person correlation or vector space model. Each user is represented as m dimensional item space similar computations are carried on vectors user-based top-n recommendation algorithms have limitations related to scalability and real-time performance [13]. b) Item based Top N Recommendations Algorithms The first step in Item based top n recommendations is to identify the k most similar item to the given set of items. Candidate set c is calculated by taking the union of k and removing each item in the set u that a user has
ISSN : 0975-3397
Vol. 4 No. 05 May 2012
863
Mohd Abdul Hameed et al. / International Journal on Computer Science and Engineering (IJCSE)
already purchased the similarity is computed between the set c and u recommendations are made for the top n items by sorting the result set in decreasing order. 3) Extensions to memory based algorithms Extensions to pure memory based algorithms are provided by the following approaches a) Voting The recommendations becomes unreliable when there are only few users that have voted for a particular item in order to avoid this problem we can introduce the concept of default voting with some minimum value for votes[8,14]. b) User Frequency inverse The items liked by all users may not be useful in computing the similarity when compared to the items liked by few users this idea is called as inverse user frequency and it is defined as fx=log(n/nx) where x is the number of users who have rated item x and n is the total number of users [15]. c) Case amplification In case amplification extension we apply transformation to the weight by favoring high weights and low weights are neglected [10]. d) Imputations-Boosted collaborative filtering algorithms When the rating data for collaborative filtering becomes sparse the accuracy of pearson correlation based collaborative filtering becomes problematic to maintain [16, 17]. The solution for this problem is to use Imputations techniques to fill in the data before using pearson correlation based collaborative filtering. e) Weighted majority prediction The prediction in the weighted majority prediction is made using the rows with observed data in the same column, weighted by the believed similarity between the rows with binary rating values [18]. B. Model based collaborative filtering Model based collaborative filtering is a two stage process for recommendations in the first stage model is learned offline in the second stage a recommendation is generated for a new user based on the learned model. Model based collaborative filtering can be represented as[19] . 1) Bayesian Belief network collaborative filtering Bayesian Belief network is a directed acyclic graph(DAG) with a triplet,each node n∑N represents random variable each directed arc a∑A represents probabilistic association between variables and Θ represents a conditional probability table quantifying how much a node depends on its parents[20]. a) Simple naïve Bayesian collaborative filtering algorithms Naive Bayes (NB) strategy is used to make predictions for simple bayesian collaborative filtering algorithms[21]. In Naive Bayes classifier we assume the features are independent for a given class the probability is calculated by taking all features, the class with the highest probability will be classified as predicted class. b) NB-ELR and TAN-ELR collaborative filtering algorithms The drawback of simple Bayesian algorithms is the inability to deal with incomplete data. In order to overcome this drawback Extended Logistic Regression algorithm(ELR) a gradient descent algorithm is used which is a discriminative parameter learning algorithm that maximize log conditionals likelihood TAN-ELR (Tree Augmented Naïve Bayes and Naïve Bayes optimized by ELR) have high classification accuracy for Both complete and incomplete data[22]. 2) Clustering collaborative filtering algorithms A cluster is a collection of data objects that have high intra class similarity and low inter class similarity [23, 24]. Similarity is measured using minkowski distance and pearson correlation for two data object X=(x1,x2,x3……xn) and Y=(y1,y2,y3…..yn) minkowski distance is defined as in (9)
d X ,Y q
n
| x i 1
i
yi | q (9)
Where n is the dimension number of objects and xi,yi are the values of the ith dimension of object x and y respectively. q is a positive integer If q=1, then d is called as manhattans distance If q=2, then d is called as Euclidian distance. clustering methods can be classified as Partitioning methods ,Density based methods and Hierarchical methods 3) Regression based collaborative filtering algorithms
ISSN : 0975-3397
Vol. 4 No. 05 May 2012
864
Mohd Abdul Hameed et al. / International Journal on Computer Science and Engineering (IJCSE)
Regression based collaborative filtering algorithms are used when two rating vectors differ in terms of Euclidean distance but have very high similarity according to vector cosine or pearson correlation measure[25]. Memory based collaborative filtering algorithms cannot be used in this case because they do not fit well in this situation. We use regression methods which uses regression model to addressesthis problem by making good predictions for numerical values. 4) MDP based collaborative filtering algorithms Recommendations are viewed as a sequential optimization problem in MDP based collaborative filtering algorithms. It uses Markov decision processes (MDP) model for generating recommendations [26, 27]. 5) Latent semantic collaborative filtering models Latent semantic collaborative filtering models introduces latent class variables in a mixture model setting to discover user communities and prototypical interest profiles by using statistical modeling techniques[28,29,30].The model performs decomposition of user preferences using overlapping user communities. This technique has high accuracy and scalability when compared to standard memory based methods. C. Hybrid collaborative filtering techniques In Hybrid collaborative filtering system collaborative filtering is combined with other recommendations techniques like content based filtering. Content based recommendation system make predictions based on the content of textual information like URLs, logs, item description and profiles about user taste, preferences and needs. Demographic based recommendation system uses user profile information such as occupation, gender, postcode to make recommendations Utility based recommenders and knowledge based recommender system uses knowledge about how a particular object satisfies user needs. 1) Hybrid recommenders combining collaborative filtering algorithms This type of recommendations uses the combination of both classes of collaborative filtering approaches memory based collaborative filtering algorithms and model based collaborative filtering algorithms [31]. The performance of these algorithms is better that than some pure memory based and model based collaborative filtering algorithms. 2) Hybrid Recommenders Incorporating CF and Content-Based Features. Content boosted collaborative filtering algorithm is based on naïve bayes classifier which classifies the content and fills in the missing values of rating matrix with the predictions of the content predictors to form a pseudo rating matrix in which observed rating are kept untouched and missing rating are replaced by the predictions of content predictors. boosted collaborative filtering recommender performance is better that some pure memory based and model based collaborative filtering algorithms[32]. D. Probabilistic Algorithms Probabilistic CF algorithms predict rating based on probability distributions [2]. The probabilistic CF algorithms calculate the probability that, given a user u and a rated item i, the user assigned the item a rating of r: p(r|u,i). Predicted rating is calculated based on either the most probable rating value or the expected value of r. The formula for user u ’s expected rating for an item I is given as follows in (10).
E r | u , i r. pr | u , i r
(10)
1) Bayesian network models Bayesian-network models are the most popular probabilistic framework thatderive probabilistic dependencies among users or items [33]. Bayesian networks uses decision trees to compactly represent probability tables, for each recommendable item a separate tree is constructed. The choice of a branch at a node in the tree depends on the user's rating (or lack of rating) for a particular item. Probability vector for user's ratings of the predicted item is stored in the nodes of the tree. 2) Probabilistic clustering dimensionality reduction techniques. A hidden variable p(z|u) that represents the probability a user belongs to the hidden class z is introduced by Probabilistic dimension reduction techniques. The formula(11) for calculating the probability of user u rating item i value r.
pr | u , i pr | i, z p z | u z
(11)
The corresponding prediction is the expectation of the rating value given in (12)
ISSN : 0975-3397
Vol. 4 No. 05 May 2012
865
Mohd Abdul Hameed et al. / International Journal on Computer Science and Engineering (IJCSE)
E r | u, i r. pr | z, i p z | u r z
(12)
Advantage of probabilistic algorithms probabilistic algorithms can produce a probability distribution across possible rating values by compute the most probable rating, the algorithm’s confidence can be calculated by computing the likelihood of that rating being correct. E. Non-probabilistic Algorithms The examples for Non-probabilistic Algorithms arenearest neighbor algorithms. There are two different classes of nearest neighbor CF algorithms: user-based nearestneighbor and item-based nearest neighbor. Nonprobabilistic dimensionality reduction algorithms that transform the ratings space to reduce the ratings space dimensionality. Other commonly cited algorithms not discussed here include graph-based algorithms, neural networks, and rule-mining algorithms. 1) Non-probabilistic Dimensionality Reduction Algorithms Collaborative filtering can support millions of users and items which forms the domain for collaborative filtering. Several dimensionality reduction algorithms are proposed to reduce the domain complexity by carrying out the mapping from item space to a smaller number of underlying dimensions [34,35]. The advantages of smaller dimensions are less run-time performance requirements and it lead to larger numbers of co-rated dimensions. The dimensions might represent the latent topics or tastes present in those items. Items can be predicted based on a user’s underlying tastes. Vector-based technique defines a mapping between a user’s taste and their ratings. Simple vector operations are used in mapping functions, and item can be predicted in constant time. Vector-based techniques for extracting underlying dimensions include support vector decomposition [34], principal component analysis [35], and factor analysis [36]. 2) Challenges in Dimensionality Reduction Algorithms The primary challenge for Dimensionality Reduction Algorithms is the mathematical complexity which leads to challenges in debugging and maintaining the software. Dimensionality Reduction Algorithms expensive offline computation are carried to generate the latent dimensional space. Heuristic methods are needed for practical implementation of these techniques for incrementally updating the latent dimensional space without re-computing it in entirely. Dimensionality Reduction Algorithms can improve accuracy in predicting ratings but the improvements are not substantial enough to overcome the practical challenges of complexity. VI.
USES OF COLLABORATIVE FILTERING
The tasks for which collaborative filtering can be performed are [37] 1. To find new items that a user might like. 2. To find a group of users who share common interest. 3. To find a set of items that a group of user may like. 4. To gain an advice on a particular item. 5. To find a set of items that are recommended along with the previous set of items that a user has liked. 6. To find a set of items that can be recommended along with a single item. VII. PROPERTIES OF DOMAIN SUITABLE FOR COLLABORATIVE FILTERING The properties of domain can be classified as properties concerning 1. Items, 2. Users, 3. Changes in item/preferences. A. Items
Many items must be present in the domain.
Many rating must be associated with each item.
Homogeneity must be present in items of same type (like all CDs must have same price range).
ISSN : 0975-3397
Vol. 4 No. 05 May 2012
866
Mohd Abdul Hameed et al. / International Journal on Computer Science and Engineering (IJCSE)
B. Users
Many users must be there in the domain.
Each user must rate multiple items.
There must be a set of users who share a common taste.
There must be a provision for user to inform other users in the group about a new product by giving subjective measure.
C. Changes in items There are many items in collaborative filtering technique and only few will be rated by a set of users who have already rated some other similar item, if items are added and subtracted from the item space frequently then it becomes difficult to maintain the performance of collaborative filtering algorithms. D. Changes in preferences If the user taste changes frequently with time then it becomes difficult to implement collaborative filtering algorithms. VIII.
SELECTION OF DATA SET FOR COLLABORATIVE FILTERING
The criteria for selection of data set depends on the following questions 1. Whether the recommendations can be based on offline evaluations made on data set or it require online evaluations 2. Whether the recommendation can be based on simulated data or actual data. 3.What properties must be present for a dataset to best model the task for which the recommendations is being evaluated. The advantages of making recommendation evaluation offline are it is quick, economical and requires the running of algorithm on the appropriate subset of data. The drawbacks of offline evaluations are if a user has not rated a particular item recommendations cannot be evaluated and recommendations does not reflect the changes that occur in user preferences because they are limited to objective evaluation of prediction results an alternative to offline is to carry live user experiments that may be controlled. The dataset specifically synthesized to match the properties of target domain is called simulated data set and it is used in situations when existing data sets does not match perfectly the properties of the target domain and task. The simulated data set can used for testing data for oblivious flaws but cannot be used for modeling the nature of real users and real data. A. Properties of data sets Properties of data sets depends on 1. Nature of content being recommended. 2. Nature of specific recommender system from which the data was collected. 3. Distribution of data sets. 1) Nature of content being recommended The nature of content being recommended depends on On the context in which recommendations are made. Tradeoff between novelty and quality needs of users novelty is the urge for some additional new information which may be of interest to user apart from high confidence(quality ) predictions made traditional collaborative filtering system. Whether the benefit derived from recommendation system outranges the cost incurred in recommendation system. The levels of user preferences. In binary preferences two levels are present either good or bad. Levels of user preferences are different from ranges of rating, in rating the user gives the rating value but is not bothered about whether the rating corresponds to good or bad. 2) Nature of specific recommender system from which the data was collected Nature of specific recommender system from which the data was collected includes Features of rating
ISSN : 0975-3397
Vol. 4 No. 05 May 2012
867
Mohd Abdul Hameed et al. / International Journal on Computer Science and Engineering (IJCSE)
Features concerning data collection methods
a) Feature of rating i. Explicit or implicit rating or both are used to rate items. Explicit is taken by user directly; implicit is inferred from user behavior. ii. The scale used for rating items ex: unary, binary. iii. Number of dimensions (attributes) used for rating. iv.When timestamp are associated with a particular item. Timestamps are associated with datasets when user preferences are expected to change in future. b) Features concerning data collection methods i. Some recommendations record all recommendations results provided to the user by time stamping the recommendations made and storing them in logs. ii. Demographic data is also recorded along with the datasets so that demographic information can be used to obtain recommendations. iii. Bias is associated with data collection mechanism used by user to rate an item. 3) Distribution of data sets The distribution of data emphasis on statistical information like size of data set and properties of data sets. The number of users for which recommendations are made.
The number of items rated by each user.
The tradeoff between number of users and number of items. IX.
PAST AND CURRENT TRENDS IN DATASETS
EachMovie Dataset (http:// research.compaq.com/SRC/eachmovie/) is the most commonly used dataset.This extensive dataset has over 2.8 million ratings from over 70,000 users, and it includes information such as timestamps and basic demographic data for some of the users EachMovie Dataset was used in dozens of machine learning and algorithmic research projects to study new and potentially better ways to predict user ratings. EachMovie Dataset is the seed to MovieLens system (http://www.movielens.org). Extracts (100,000 ratings and 1 million ratings) of the MovieLens dataset have also been released for research use these extracts have been used by several researchers, in their investigation of cold start recommendations, in their evaluation of item-based algorithms in their community extraction research, in their work on “collaborative sanctioning.” Jester dataset is used more recently, which was collected from the Jester joke recommendation website. The Jester dataset has different characteristics than the MovieLens and Eachmovie data. First of all, there is a set of training items (jokes) that are rated by every single user, providing complete data on that subset of items. Second, in the Jester user interface, the user clicks on a unlabeled scale bar to rate a joke, so the ratings are much less discrete and may suffer from different kinds of biases since it is hard for the user to intentionally create a ranking among their rated items. X.
ACQUIRING RATINGS
Collaborative filtering is based on acquiring rating from users on items .rating can be taken from user in either of the following ways 1. Explicit Rating 2. Implicit Rating A. Explicit Rating Explicit ratings offer the most accurate description of a user’s preference for an item with the least amount of data ,it is provided explicitly by users and it require additional work from the user, therefore it can be challenging to collect ratings particularly when creating a new collaborative filtering service[38]. B. Implicit Rating In implicit ratings observations are made from user behavior by deriving inferences of user preference [39]. Implicit rating is collected with little or no cost to the user, but ratings inference may be imprecise. To overcome this uncertainty associated with implicit ratings we use aggregated values by collecting multiple observations of variables that are predictive of a rating and combining them into a single estimated rating either by voting or averaging.
ISSN : 0975-3397
Vol. 4 No. 05 May 2012
868
Mohd Abdul Hameed et al. / International Journal on Computer Science and Engineering (IJCSE)
C. The Challenge of Collecting Explicit Ratings Explicit ratings require time and dedicated attention of the user. Many experiments have demonstrated that collecting explicit ratings is not as challenging as previously thought because of the following reasons [40]. 1. In Collaborative filtering system all users are not required to provide large no of ratings Instead you just need a relatively small number of “early adopters” who rate frequently and continuously. Sufficient information is provided by early adopters to generate recommendations for the remaining users of the system. A limited number of ratings must be provided by the remaining users so that the system can learn their preferences. 2. Users appear to gain benefit from rating by having higher quality recommendations. 3. By providing Explicit rating user will feel a sense of responsibility by providing an opinion that will contribute to the advancement of community. D. Rating Scales The choice of explicit rating scale is very important ex of some scales are unary scale which rates either good or “don’t know”, Binary scale which rates as good or bad. Integer scale which provides integer ranges 1-5, 1-7, or 1-10[41]. More information regarding each user’spreference can be collected if we use fine grained scale. Finer grained scales require more complex user interfaces. If a very precise scale (with a large range) is selected, a user can give different rating to same items at different time because of the diversity in range of scale there by increasing the uncertainty in the rating. The most important consideration is the desires of the user population. Sometime users feel to have fine-grained scales so that they can represent their preferences properly. XI.
COLD START PROBLEM
For initial recommendations to be made there will not be enough rating this situation is referred to as cold start problem the performance of the system is degraded by this problem. The problem can occur in three scenarios. A. New user A new use registers for a collaborative filtering service ,they do not have rating on record so no personalized predictions can be made this problem can be solved by making user rate some items before using a service or displaying non personalized recommendations until the user has rated enough or asking for demographic information. B. New item A new item added to collaborative service will not have rating therefore it will not be recommended this problem can be solved by randomly selecting item with few or no rating and by asking user to rate those items or recommending through content analysis. C. New Community Boostrapping a new community is the biggest cold start problem to overcome boostraping problem rating incentives are provided to small bootstrap subset of the community, before inviting entire community to use the service or we can use non collaborative filtering techniques to provide initial recommendations. XII.
MEASURES USED FOR COLLABORATIVE FILTERING
A. Confidence Metrics A confidence metric indicates the support for a particular prediction can be supplied by collaborative filtering system when the confidence measures are below a certain applications may choose not to display predictions. Confidence measures can also be used when selecting items for recommendation. Generally the items with highest predicted ratings are recommended by collaborative filtering algorithms. Probabilistic algorithms may be able to use their computed probability distributions to estimate confidence [42]. User-based algorithms often use confidence measures that incorporate the agreement for an item in a user’s neighborhood, and the number of co rated items between neighbors and the user. Item-based algorithms may measure the number of ratings for correlated pairs of items contributing to a prediction B. Predictive Accuracy Metrics. Predictive accuracy metrics measure the closeness of the true user ratings and recommender system’s predicted ratings. Predictive accuracy rating will be displayed to the user as an annotation in context in predictive accuracy metrics like number of stars are displayed as rating in movielens for a movie. . predictive accuracy can also be used to measure the ability of a recommender system to rank items with respect to user preference as the predicted rating values create an ordering across the items, to measure predictive
ISSN : 0975-3397
Vol. 4 No. 05 May 2012
869
Mohd Abdul Hameed et al. / International Journal on Computer Science and Engineering (IJCSE)
accuracy the metric that computes the difference between the predicted rating and true rating such as mean absolute error are used[43] . 1) Mean Absolute Error and Related Metrics. Mean absolute error (often referred to as MAE) measures the average absolute deviation between a predicted rating and the user’s true rating[45]. N
E
| p i 1
i
N
ri | (13)
There are basically two advantages of mean absolute error first the computation logic is simple and easy to understand. Second, mean absolute error is based on sound statistical properties that provide a means for testing the significance of a difference between the mean absolute errors of two systems. Three measures related to mean absolute error Mean squared error, Root mean squared error, Normalized mean absolute error. In the first two variations importance is given to errors by squaring error before summing it. The third related measure allows comparisons to be done between prediction runs on different datasets. Normalized mean absolute error is mean absolute error normalized with respect to the range of rating values C. Classification Accuracy Metrics. The frequency with which a recommender system makes correct or incorrect decisions about whether an item is good is obtained by classification metrics measure. Classification metrics are used for taskswhen users have true binary preferences. Data sparsity problem occurs when classification accuracy metrics is applied to nonsynthesized data in offline experiments. D. Precision and Recall and Related Measures To evaluate information retrieval systems the two most important metrics are precision and recall [45,46] TABLE 1: Table Showing the Categorization of Items in the Document Set
Not selected Total Relevant Nrs Nrn Nr Irrelevant Nts Ntn Nn Total Ns Nn N The item set used for precision and recall must be separated into two classes’ i.e. relevant or not relevant. The rating scale must be transformed to binary. We also need to separate the item set into the set that was returned to the user (selected/recommended), and the set that was not. We assume that the user will consider all items that are retrieved. 1) Precision Precision is defined as the ratio of relevant items selected to number of items selected. Precision represents the probability that a selected item is relevant is given as (14).
P
N rs Ns
(14)
Where Nrs are the relevant items selected Ns is the number of items selected 2) Recall Recall,, is defined as the ratio of relevant items selected to total number of relevant items available. Recall represents the probability that a relevant item will be selected is given as in (15).
R
N rs Nr
(15)
Precision and recall depend on the separation of relevant and non-relevant items. Most information retrieval evaluation has focused on an objective version of relevance in objective version relevance is defined with
ISSN : 0975-3397
Vol. 4 No. 05 May 2012
870
Mohd Abdul Hameed et al. / International Journal on Computer Science and Engineering (IJCSE)
respect to a query, and is independent of the user. In Recommender systems items are recommended based on the user preferences and the user is the only person who can determine if an item meets his taste requirements. Thus, relevance is more inherently subjective in recommender systems than in traditional document retrieval. Several approaches have been taken to combine precision and recall into a single metric. One approach is the F1 metric which combines precision and recall into a single number is given by (16)
F1
2 PR PR
(16)
Mean average precision or MAP is an alternate approach taken by the TREC community is to compute the average precision across several different levels of recall or the average precision at the rank of each relevant document. F1 and mean average precision may be appropriate if the underlying precision and recall measures on which it is based are determined to be appropriate. Precision and recall cannot measure the quality of the ordering among items that are selected as relevant.
Precision and recall are less appropriate for domains with non-binary granularity of true preference.
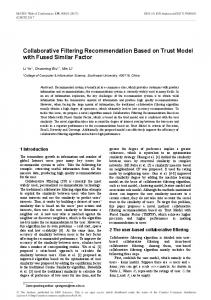
E. ROC Curves, Swets’ A Measure, and Related Metrics A theoretically grounded alternative to precision and recall is provided by ROC curve-based metrics. The ROC model attempts to measure the extent to which an information filtering system can successfully distinguish between signal (relevance) and noise [47,48]. The ROC model assumes that the information system will assign a predicted level of relevance to every potential item.
Figure.1: A possible representation of the density functions or relevant and irrelevant items
Fig. 1 gives the distribution of density function for the relevant and irreverent items .The distribution on the right indicates the probability for items that are relevant. The distribution on the left represents the probability distribution for an item that is in reality not relevant to the information need. The further apart these two distributions are, the better the system is at differentiating relevant items from non-relevant items. zc is the cut off that all items that the system ranks above the cutoff are viewed by the user, and those below the cutoff are not viewed by the user. For each value of zc, there will be a different value of recall (percentage of good items returned, or the area under the relevant probability distribution to the right of zc) and fallout (percentage of bad items returned, or the area under the non- relevant probability distribution to the right of zc). The ROC curve represents a plot of recall versus fallout, where the points on the curve correspond to each value of zc. An example of an ROC curve is shown in the following above figure. A common algorithm for creating an ROC curve goes as follows: (1) Select the criteria for identify whether an item is relevant or non-relevant. (2) A predicted ranking is generated for all items. (3) For each predicted item, in decreasing order of predicted relevance (starting the graph at the origin).
ISSN : 0975-3397
Vol. 4 No. 05 May 2012
871
Mohd Abdul Hameed et al. / International Journal on Computer Science and Engineering (IJCSE)
Figure.2: An example of an ROC curve
(a) If the predicted item is indeed relevant, draw the curve one step vertically. (b) If the predicted item is not relevant, draw the curve one step horizontally to the right. (c) If the predicted item has not been rated (i.e., relevance is not known), then the item is simply discarded and does not affect the curve negatively or positively. An example of an ROC curve constructed in this manner is shown in above Fig. 2.The p-values shown on the curve represent different prediction cutoffs. For example, if we chose to select all items with predictions of 4 or higher, then we experience approximately 45% of all relevant items and 20% of all non-relevant items. An ROC curve for a perfect predictive system goes straight upward until 100% of relevant items have been encountered, then straight right for the remaining items. A random predictor is expected to produce a straight line from the origin to the upper right corner. ROC curves are useful for tuning the signal/noise tradeoff in information systems. ROC curves make an assumption of binary relevance Similar to Precision and Recall measures. Items recommended are either successful recommendations (relevant) or unsuccessful recommendation (nonrelevant). Thus the ordering among relevant items has no consequence on the ROC metric—if all relevant items appear before all non-relevant items in the recommendation list, you will have a perfect ROC curve. F. Learning Rate Statistical models are used by learning algorithms [49]. The performance of Collaborative filtering recommender systems is based on the amount of learning data available. As size of learning data increases, the quality of the predictions or recommendations should increase. Different recommendation algorithms can reach “acceptable” quality of recommendations at different rates. Some algorithms may only need a few data points to start generating acceptable recommendations, while others may need extensive data points. Three different learning rates have been considered in recommender systems: Overall learning rate, Per item learning rate, Per user learning rate. The recommendation quality is determined by overall learning rate as a function of the overall number of ratings in the system (or the overall number of users in the system). The quality of predictions for an item is determined by the per-item learning rates is a function of the number of ratings available for that item. The quality of the recommendations for a user is determined by per-user learning rate is as a function of the number of ratings that user has contributed.
ISSN : 0975-3397
Vol. 4 No. 05 May 2012
872
Mohd Abdul Hameed et al. / International Journal on Computer Science and Engineering (IJCSE)
The most common method for comparing the learning rates of different algorithms is to graph the quality versus the number of ratings (quality is usually accuracy). Learning rates are non-linear and asymptotic (quality can’t improve forever), and thus it is challenging to represent them compactly. Large size of data sets is the major reason for not having adequate metrics for evaluation of learning rate. Algorithm learning rates will become a much more significant evaluation factor when the recommender systems spread into the more data-sparse domains. G. Coverage The measure of the domain of items in the system over which the recommendation system can form predictions or make recommendations [50]. Systems with lower coverage will be limited in the decisions may be less valuable to users.The most common measure for coverage has been the number of items for which predictions can be formed as a percentage of the total number of items. To measure coverage of this type is to collect random sample of user/item pairs, a prediction is made for each pair, and we measure the percentage for which a prediction was provided. Coverage must be measured in combination with accuracy. H. Novelty Novelty is the ability of a CF system to recommend items that the user was not already aware of even stronger than novelty is the idea of serendipity, where users are given recommendations for items that they would not have seen given their existing channels of discovery. Researchers have studied how to adjust algorithms to promote serendipity and novelty, but measuring novelty is challenging because it requires live user studies where participants indicate if a recommendation was novel. XIII. EVALUATION OF COLLABORATIVE FILTERING RECOMMENDER SYSTEM Recommendation is provided to a user based on the opinion of group of users who belong to the same community. The evaluation of recommender system and their algorithms depends on the following three main criteria A. Characteristic of data set The performance of collaborative filtering algorithms dependence on the type of data sets. Many collaborative filtering algorithms have been designed specially to suite the characteristic of data set, different algorithms are used when there are many users than items and when there are many items when compared to user. B. Goals Collaborative filtering algorithms can be used for various goals such as measuring the accuracy of collaborative filtering or for measuring large errors that occur due to difference in actual rating and predicted rating or for measuring the degree to which recommendations cover the entire range of items. But the most important goals of recommendation algorithm is to attain high level of user satisfaction .the user must be satisfied by using recommendation system. C. Choice of measure Many measures are available to measure the performance of collaborative filtering algorithms. An efficient choice has to made to select the best possible measure for evaluating the performance of collaborative filtering algorithms XIV. USER EVALUATION OF COLLABORATIVE FILTERING ALGORITHMS User evaluation metrics are used to evaluate user reaction to a recommender system. Thedimensions for user evaluation are as follows A. Explicit (ask) vs. implicit (observe) For explicit evaluation we ask users about their reactions to a system and for implicit evaluation we observe user behavior. In explicit evaluation survey and interview methods are used. The implicit evaluation usually consists of logging user behavior, then subjecting it to various sorts of analyses. B. Laboratory studies vs. field studies Lab studies are good for testing well-defined hypotheses under controlled conditions. Lab studies allow focused investigation of specific issues. Field studies can reveal what users actually do in their own real contexts, showing common uses and usage patterns, problems and unmet needs, and issues that investigators may not have thought of to consider in lab settings. C. Outcome vs. process We have to design what counts as a successful outcome for each task in the system accuracy may be the fundamental metric from systems perspective. From a user perspective, however, metrics must be defined
ISSN : 0975-3397
Vol. 4 No. 05 May 2012
873
Mohd Abdul Hameed et al. / International Journal on Computer Science and Engineering (IJCSE)
relative to their particular task. For most tasks a successful outcome requires users to act on the system’s recommendations, and actually purchase a book, rent a movie, or download a paper. However, to simply measure whether a goal is achieved is not sufficient. D. Short-term vs. long-term Some issues may not become apparent in a short term study, particularly a lab study. Therefore we have to dedicate enough resources and time for long term issues. XV.
CONCLUSION
The progress made by recommender systems over the last decade is tremendous. Content based, collaborative and hybrid methods were proposed and several industrial-strength systems have been developed. The advantage of collaborative filtering is that recommendations for a new user are based on the preferences made by group of users who has similar taste or preferences. Collaborative filtering techniques have been proposed to decrease the processing time and the data latency. The recommendation systems can predict user behavior patterns without any knowledge of the user in advance, and accuracy can be evaluated by comparing the prediction and reality. In this paper, we reviewed various limitations of the current recommendation methods and discussed possible extensions that can provide better recommendation capabilities.However, despite all these advances, the current generation of recommender systems surveyed in this paper still requires further improvements to make recommendation methods more effective in a broader range of applications. These extensions include, inclusion of context in recommendations, incorporating improvements in modeling of users and items, support for multidimensional ratings. We hope that the issues covered in this paper would advance the discussion in the recommender systems community about the next generation of recommendation technologies. XVI. FUTURE WORK There are many open research problems in recommender systems; we focus attention on evaluation-related problems. When error occurs in recommendation system user satisfaction is decreased. The most important things are to decide to which metric the user is sensitive to, what is the minimum change in level before user notice or user behavior changes. As the performance of collaborative filtering algorithms depends on the domain used till now no researchers have systematically compared a set of algorithms across a variety of different domains to understand the extent to which different domains are better served by different classes of algorithms. If such research is done then it would simplify the evaluation of algorithms a dataset with the desired properties can be selected by system designers without needing domain-specific testing. Most metrics used primary focus on accuracy, and ignore issues such as usefulness of results and the level of satisfaction the user has obtained by using recommendation system. Hybrid recommendations can be developed that combines advantages of collaborative and content based filtering techniques. Much research has to performed in the area that covers the changes in preference of user over time, choosing an appropriate data sets that best models the task that the recommendation system has to perform ,there are basically only few datasets that are freely available to validate the performance of collaborative filtering algorithms, effective techniques has to be designed to overcome the cold start problem and genetic algorithms can be used to perform optimization on the results obtained by recommendation system. XVII. REFERENCES [1]
[2]
[3] [4] [5] [6] [7] [8]
[9]
Pazzani, M., Billsus, D.” Content-based Recommendation Systems.” In: Brusilovsky, P., Kobsa, A., Nejdl, W. (eds.): The Adaptive Web: Methods and Strategies of Web Personalization, Lecture Notes in Computer Science, Vol. 4321. Springer-Verlag, Berlin Heidelberg New York (2007) this volume. Breese, J.S., Heckerman, D., Kadie, C.” Empirical Analysis of Predictive Algorithms for Collaborative Filtering”. In Proceeding of the Fourteenth Conference on Uncertainty in Artificial Intelligence (UAI). (1998) Madison, Wisconsin. Morgan Kaufmann p. 43-52. Linden, G., Smith, B., York, J.”Amazon.Com Recommendations: Item-To-Item Collaborative Filtering”. Internet Computing, IEEE, 2003. 7(1): p. 76-80. Sarwar, B., Karypis, G., Konstan, J.A., Riedl, J.:”Item-Based Collaborative Filtering Recommendation Algorithms”. Proceedings of the 10th international conference on World Wide Web. (2001) Hong Kong. ACM Press p. 285-295. G.Adomavicius and A. Tuzhilin,”Toward the next generation of recommender systems: a survey of the state-of-theart and possible extensions”,IEEE Transactions on Knowledgeand Data Engineering, vol. 17, no. 6, pp. 734–749, 2005. K.Yu, A. Schwaighofer, V. Tresp, X. Xu, and H.-P. Kriegel,” Probabilistic memory-based collaborative filtering”, IEEETransactions on Knowledge and Data Engineering, vol. 16, no.1, pp. 56–69, 2004. Canny, J.” Collaborative Filtering with Privacy via Factor Analysis”. In Proceedings of the 25th annual international ACM SIGIR conference on Research and development in information retrieval. (2002) Tampere, Finland. ACM Press p. 238-245. P. Resnick, N. Iacovou, M. Suchak, P. Bergstrom, and J. Riedl.”Grouplens: an open architecture for collaborative filtering ofnetnews”,in Proceedings of the ACM Conference on ComputerSupported Cooperative Work, pp. 175–186, New York, NY,USA, 1994 G. Salton and M.McGill”, Introduction to Modern Information Retrieval”, McGraw-Hill, New York, NY, USA, 1983..
ISSN : 0975-3397
Vol. 4 No. 05 May 2012
874
Mohd Abdul Hameed et al. / International Journal on Computer Science and Engineering (IJCSE)
[10] Y. Koren.” Factorization meets the neighborhood: a multifacetedcollaborative filtering model”, in Proceedings of the14th ACM SIGKDD International Conference on KnowledgeDiscovery and Data Mining (KDD ’08), pp. 426–434, Las Vegas, Nev, USA, August 2008. [11] K. Miyahara and M. J. Pazzani.”Improvement of collaborative filtering with the simple Bayesian classifier”,Information Processing Society of Japan, vol. 43, no. 11, 2002. [12] Sarwar, B., Karypis, G., Konstan, J.A., Riedl, J.”Item-Based Collaborative Filtering Recommendation Algorithms”. Proceedings of the 10th international conference on World Wide Web. (2001) Hong Kong. ACM Press p. 285-295. [13] G. Karypis.”Evaluation of item-based top-N recommendation algorithms” in Proceedings of the International Conference on Information and Knowledge Management (CIKM ’01),pp. 247–254, Atlanta, Ga, USA, November 2001. [14] B. M. Sarwar, G. Karypis, J. A. Konstan, and J. Riedl.”Analysis of recommendation algorithms for E-commerce.” in Proceedings of the ACM E-Commerce, pp. 158–167, Minneapolis,Minn, USA, 2000. [15] G. Salton andM.McGill, “Introduction toModern Information Retrieval”, McGraw-Hill, New York, NY, USA, 1983. [16] X. Su, T. M. Khoshgoftaar, and R. Greiner.”A mixture imputation-boosted collaborative filter”, in Proceedings ofthe 21th International Florida Artificial Intelligence ResearchSociety Conference (FLAIRS ’08), pp. 312–317, Coconut Grove, Fla, USA, May 2008. [17] X. Su, T. M. Khoshgoftaar, X. Zhu, and R. Greiner.”Imputation-boosted collaborative filtering using machine learning classifiers”, in Proceedings of the 23rd Annual ACMSymposium on Applied Computing (SAC ’08), pp. 949–950, Cear´a Fortaleza, Brazil, March 2008. [18] S. A. Goldman and M. K. Warmuth,.”Learning binary relations using weighted majority voting,Machine Learnin”g, vol. 20, no. 3, pp. 245–271, 1995. [19] C. Basu, H. Hirsh, and W. Cohen.”Recommendation as classification: using social and content-based information in recommendation” inProceedings of the 15th NationalConference on Artificial Intelligence (AAAI ’98), pp. 714–720, Madison,Wis, USA, July 1998. [20] J. Pearl, Probabilistic Reasoning in Intelligent Systems” Networks of Plausible Inference”, Morgan Kaufmann, San Francisco,Calif, USA, 1988. [21] R. Greinemr, X. Su, B. Shen, and W. Zhou.”Structural extension to logistic regression: discriminative parameter learning of belief net classifiers”, Machine Learning, vol. 59, no. 3, pp. 297–322, 2005. [22] B. Shen, X. Su, R. Greiner, P. Musilek, and C. Cheng”Discriminative parameter learning of general Bayesian network classifiers”, in Proceedings of the 15th IEEE InternationalConference on Tools with Artificial Intelligence, pp. 296–305, Sacramento, Calif, USA, November 2003. [23] S. H. S. Chee, J. Han, and K. Wang,”:RecTree: an efficient collaborative filtering method”, in Proceedings of the 3 rd International Conference on DataWarehousing and KnowledgeDiscovery, pp. 141–151, 2001 [24] B. M. Sarwar, G. Karypis, J. A. Konstan, and J. Riedl.”Recommender systems for large-scale E-commerce: scalable neighborhood formation using clustering”, in Proceedings ofthe 5th International Conference on Computer and InformationTechnology (ICCIT ’02), December 2002. [25] S. Vucetic and Z. Obradovic.”Collaborative filtering using a regression-based approach, Knowledge and Information Systems”, vol. 7, no. 1, pp. 1–22, 2005. [26] G. Shani, D. Heckerman, and R. I. Brafman.”An MDP-based recommender system”,Journal of Machine Learning Research, vol. 6, pp. 1265–1295, 2005. [27] R. E. Bellman, “Dynamic Programming”, Princeton University Press, Princeton, NJ, USA, 1962. [28] T. Hofmann.”Latent semantic models for collaborative filtering”,ACM Transactions on Information Systems, vol. 22, no. 1, pp. 89–115, 2004. [29] T. Hofmann.”Unsupervised learning by probabilistic latent semantic analysis, Machine Learning”, vol. 42, no. 1-2, pp. 177–196, 2001. [30] T. Hofmann and J. Puzicha,”Latent class models for collaborative filtering”,in Proceedings of the 16th International JointConference on Artificial Intelligence (IJCAI ’99), pp. 688–693, 1999. [31] R. Burke.”Hybrid recommender systems: survey and experiments, UserModelling and User-Adapted Interaction”, vol. 12, no. 4, pp. 331–370, 2002. [32] P. Melville, R. J. Mooney, and R. Nagarajan.” Content boosted collaborative filtering for improved recommendations”,in Proceedings of the 18th National Conference onArtificial Intelligence (AAAI ’02), pp. 187–192, Edmonton, Canada, 2002. [33] McLaughlin, M., Herlocker, J.” A Collaborative Filtering Algorithm and Evaluation Metric that Accurately Model the User Experience”. In Proceedings of the SIGIR Conference on Research and Development in Information Retrieval. (2004) p. 329336. [34] Goldberg, K., Roeder, T., Gupta, D., Perkins, C.” Eigentaste: A Constant-Time Collaborative Filtering Algorithm”. Information Retrieval, (2001) 4(2): p. 133-151. [35] Sarwar, B., Karypis, G., Konstan, J.A., Riedl, J.”Incremental SVD-Based Algorithms for Highly Scaleable Recommender Systems”. Proceedings of the Fifth International Conferenceon Computer and Information Technology (2002) [36] Canny, J.”Collaborative Filtering with Privacy via Factor Analysis”. In Proceedings of the 25th annual international ACM SIGIR conference on Research and development in information retrieval. (2002) Tampere, Finland. ACM Press p. 238-245. [37] Ludford, P.J., Cosley, D., Frankowski, D., Terveen, L.”Think Different: Increasing Online Community Participation Using Uniqueness And Group Dissimilarity”. Proceedings of the SIGCHI conference on Human factors in computing systems (2004) ACM Press: Vienna, Austria p. 631-638. [38] Avery, C., Resnick P., Zeckhauser, R.”The Market for Evaluations. American Economic Review”, (1999) 89(3): p. 564-584 [39] Oard, D.W., Kim, J.:”Implicit Feedback for Recommender Systems”. In Proceedings of the AAAI Workshop on Recommender Systems. (1998) Madison, Wisconsin [40] Harper, F., Li, X., Chen, Y., Konstan, J.” An Economic Model Of User Rating In An Online Recommender System”. In Proceedings of the 10th International Conference on User Modeling, (2005) Edinburgh, UK p. 307-216. [41] Cosley, D., Lam, S.K., Albert, I., Konstan, J.A., Riedl, J.” Is Seeing Believing?: How Recommender System Interfaces Affect Users' Opinions”. In: Proceedings of the SIGCHIconference on Human factors in computing systems. (2003) ACM Press: Ft. Lauderdale, Florida, USA. p. 585-592. [42] Herlocker, J.L., Konstan, J.A., Riedl, J.”Explaining Collaborative Filtering Recommendations”. In Proceedings of the 2000 ACM conference on Computer supported cooperative work. (2000) Philadelphia, Pennsylvania. ACM Press p. 241-250.
ISSN : 0975-3397
Vol. 4 No. 05 May 2012
875
Mohd Abdul Hameed et al. / International Journal on Computer Science and Engineering (IJCSE)
[43] Dahlen, B. J.,Konstan, J. A., Herlocker, J. L., Good, N., Borchers, A., And Riedl, J. 1998.”Jumpstarting Movielens: User Benefits Of Starting A Collaborative Filtering System With “Dead Data””. Tr98-017. University Of Minnesota [44] Breese, J. S., Heckerman, D., And Kadie, C. 1998. “Empirical Analysis Of Predictive Algorithms For Collaborative Filtering”. In Proceedings Of The 14th Conference On Uncertainty In Artificial Intelligence(Uai-98). G. F. Cooper, And S. Moral, Eds. Morgan-Kaufmann, San Francisco, Calif., 43–52. [45] Sarwar, B. M., Karypis, G., Konstan, J. A., And Riedl, J. 2000a.: “Analysis Of Recommendation Algorithms For E-Commerce”. In Proceedings Of The 2nd Acm Conference On Electronic Commerce(Ec’00). Acm, New York. 285–295. [46] Sarwar, B. M., Karypis, G., Konstan, J. A., And Riedl, J. 2000b. “Application Of Dimensionality Reduction In Recommender System–A Case Study”. In Proceedings Of The Acm Webkdd 2000 Web Mining For E-Commerce Workshop. [47] Hanley, J. A. Andmcneil, B. J. 1982.”The Meaning And Use Of The Area Under A Receiver Operating Characteristic (Roc) Curve. Radiology “143, 29–36 [48] Le And Lindren 1995]. Le, C. T., Lindren, B. R. 1995”. Construction And Comparison Of Two Receiver Operating Characteristics Curves Derived From The Same Samples”. Biom. J. 37, 869–877. [49] Schein, A.I., Popescul, A., Ungar, L.H.” Generative Models for Cold-Start Reco mendations.” Proceedings of the Twenty-third Annual International ACM SIGIR Workshop on Recommender Systems. (2001) New Orleans, Louisiana. [50] Good, N., Schafer, J. B., Konstan, J. A., Borchers, A., Sarwar, B. M., Herlocker, J. L., And Riedl, J. 1999. “Combining collaborative filtering with personal agents for better recommendations.” In Proceedings of the 16th National Conference on Artificial Intelligence (AAAI-99), J. Hendler, and D. Subramanian, Eds. AAAI Press, Menlo Park, Calif., 439–446 AUTHORS PROFILE
Mohd Abdul Hameed received graduate degree in computer science engineering from the JNTU Hyderabad, AP, India in 2004, where he continued masters in the area of Software Engineering for 2 years. He is working as Assistant Professor, Dept of CSE, University College of Engineering (A), Osmania University, Hyderabad, AP, India. Since 2007, he is working toward the PhD degree at Osmania University, Hyderabad, India. His main research interests include Data Mining, Information Retrieval System, Artificial Intelligence, Machine Learning and Soft Computing. Very often he visits as a recourse person in National Level Workshops. He contributed main papers in IEEE, ACM and Springer and also acting as a Member in International Program Committee of IEEE.
Dr. Omar Al Jadaan (1973) received his bachelor’s degree in Electrical and Electronics Engineering (1996), Masters in Computer Sciences (2004) and Ph.D. in Computer sciences engineering (2010). He is presently working as assistant professor at Ras Al Khaimah Medical and Health Sciences University, UAE. His research areas include Multi-objective Optimization, Evolutionary Computation, Cloud Computing, Artificial Intelligence, Data mining, Algorithms,and Software Engineering.He has published several research papers in IEEE international conferences.
Dr. S. Ramachandram (1959) received his bachelor’s degree in Electronics and Communication (1983), Masters in Computer Science (1985) and a Ph.D. in Computer Science (2005). He is presently working as a Professor and Vice Principal, University College of Engineering(A), Osmania University, Hyderabad, India. His research areas include Mobile Computing, Grid Computing, Server Virtualization and Software Engineering.He has authored several books on Software Engineering, handled several national & international projects and published several research papers.
ISSN : 0975-3397
Vol. 4 No. 05 May 2012
876