Jun 5, 2007 - 3Department of Mathematics and Statistics and Department of Physics, University of Vermont, Burlington, Vermont 05401, USA. (Received 1 ...
PHYSICAL REVIEW LETTERS
PRL 98, 236801 (2007)
week ending 8 JUNE 2007
Collective Excitations in Electron-Hole Bilayers G. J. Kalman,1 P. Hartmann,2 Z. Donko´,2 and K. I. Golden3 1
Department of Physics, Boston College, Chestnut Hill, Massachusetts 02467, USA Research Institute for Solid State Physics and Optics, Hungarian Academy of Sciences, P.O. Box 49, H-1525 Budapest, Hungary 3 Department of Mathematics and Statistics and Department of Physics, University of Vermont, Burlington, Vermont 05401, USA (Received 1 November 2006; published 5 June 2007)
2
We report a combined analytic and molecular dynamics analysis of the collective mode spectrum of a bipolar (electron-hole) bilayer in the strong coupling classical limit. A robust, isotropic energy gap is identified in the out-of-phase spectra, generated by the combined effect of correlations and of the excitation of the bound dipoles. In the in-phase spectra we identify longitudinal and transverse acoustic modes wholly maintained by correlations. Strong nonlinear generation of higher harmonics of the fundamental dipole oscillation frequency and the transfer of harmonics between different modes is observed. DOI: 10.1103/PhysRevLett.98.236801
PACS numbers: 73.20.Mf, 52.27.Gr, 52.65.Yy, 73.21.�b
An impressive amount of work has been devoted over the past decades to the properties of charged particle bilayers, consisting of two quasi-two-dimensional (2D) layers separated from each other by a distance d, such that d is comparable to the interparticle distance. The physics of such systems is remarkable, because of the interplay of the 2D dynamics and 3D interaction. In the bipolar bilayers (BPBL) the charges in the two layers have opposite polarities. The physical realization of the BPBL is the electron-hole bilayer in semiconductors, which has been of special recent interest [1]. The main distinguishing feature of the bipolar system is that, in the appropriate parameter domain, the electrons and the holes bind to each other in a dipolelike excitonic formation [1,2]. These excitons may also form a Bose condensate [1,3–5]. It is also expected that at strong enough coupling the system undergoes a transition into a Wigner crystal-like solid phase [2,3]. A recent work has also pointed out the exciting possibility of the existence of a supersolid phase over the dipole-solid domain [6]. A more detailed picture has emerged from a Monte Carlo simulation of a strongly coupled classical BPBL [2], revealing the existence of dipole-liquid, dipole-solid, Coulomb-liquid, and Coulomb-solid ‘‘phases.’’ There is little doubt that the topology delineated by the classical phase diagram [2] is quite generally correct [6]. A central problem for bilayer systems is the spectrum of collective excitations. This spectrum in the case of the electronic bilayer (EBL), where the charges in the two layers are identical, has been shown to possess the unique feature that it becomes qualitatively changed once the system is in the strong coupling regime [7–9]. Does the BPBL exhibit a similar behavior? This is the problem we address in this Letter in the framework of mapping out the full collective mode spectrum of the BPBL in the strong coupling (SC) regime. We study the parameter range that spans all four phases but we focus on the more important and more intriguing SC liquid states. From the point of 0031-9007=07=98(23)=236801(4)
view of the collective mode spectrum, the dominant characteristic of the SC regime is the localization or quasilocalization of the particles, either in the crystalline solid or in the SC liquid phase [10]. This fact and the physical separation of the two oppositely charged layers that prevents their collapse allows one to represent the dynamics of the collective modes in the BPBL, even in the quantum domain, through a classical modeling [7,10,11]. The in-layer exchange effects, precisely because of the quasilocalization of the charges, contribute only to generating an exchange-correlation energy, which is well emulated by the equivalent classical correlation energy [12], and tunneling is insignificant, because for any reasonable layer separation d value d=aB � 1. This latter condition also ensures that the excitation energy of the exciton is well described in terms of its classical Kepler frequency. Our approach is based on a combined classical molecular dynamics (MD) simulation and theoretical analysis. To study collective excitations, simulation of a large number of particles is needed, which, at present, becomes feasible only by using a classical approach. Hence the special merit of the classical MD simulation. What the classical approach obviously misses, however, is primarily the effect of condensate (discussed later). The BPBL model consists of two 2D monolayers 1 and 2 with intralayer and interlayer interactions given by ’11 �k� � ’22 �k� � 2�e2 =k, ’12 �k� � ’21 �k� � ��2�e2 =k� exp��kd�. While in an electron-hole bilayer the masses in the two layers are, generally speaking, unequal, a simplified symmetric model with equal masses gives insight into the dominating aspects of the mode spectrum [5]. Within the classical modeling, the symmetric BPBL system is then characterized by (i) the in-layer Coulomb coupling coefficient � � �e2 =akT� [a � �n���1=2 is the Wigner-Seitz (WS) radius, n is the areal density of particles] and (ii) d, the separation distance between the two layers. Addressing first the theoretical description of the collective mode spectrum, one should realize that, in
236801-1
© 2007 The American Physical Society
PRL 98, 236801 (2007)
PHYSICAL REVIEW LETTERS
contrast to the case of the EBL, for layer separations of interest a weak coupling approach is bound to fail —even at low � values—due to the dominance of the excitonic bound state in the spectrum. Nevertheless, as a matter of orientation, we can start with the random phase approximation (RPA). The diagonalization of the ’ interaction matrix in the layer space leads to the identification of 2 longitudinal modes as in-phase and out-of-phase (�) p������ modes: !L� �k� � !0 ka�1 � exp��kd� 1=2 , where !0 � p������������������� 2e2 =ma3 . The small-k behavior p������of the mode is acoustic, here with a slopeps�����
� � !0 ad, while the � mode has the typical 2D ! / ka behavior. Thus, the RPA misses, as it must, the appearance of the frequency of the intrinsic oscillation (excitation) of the dipole in the spectrum. In addition, the RPA is also unable to account for the correlation-induced shear modes. In an appropriate SC description, both of these effects should be correctly represented. We adopt the quasilocalized charge approximation (QLCA) [10,13], the method that we previously employed to identify the gapped excitation in the collective spectrum of the EBL [7]. The longitudinal (L) and transverse (T) QLCA dielectric matrices in layer space (i; j) [7] "L;T ij �k; !� � �ij �
nk2 ’ �k� � �!2 I � DL;T �k� �1 (1) lj m il
become functionals of the longitudinal (L) and transverse (T) projections of the dynamical matrix D�� ij �k� � P 1 P � � q q �’ �q�h �jk � qj� � � ’ �q�h �q� , hij �q� ij ij ij l il il mA q are the Fourier transforms of hij �r� � gij �r� � 1, where gij �r� is the pair distribution function and A is a large but finite surface. The resulting mode structure !L� �k� � f!20 ka�1 � exp��kd� DL11 �k� � DL12 �k�g1=2 (2) !T� �k� � �DT11 �k� � DT12 �k� 1=2
week ending 8 JUNE 2007
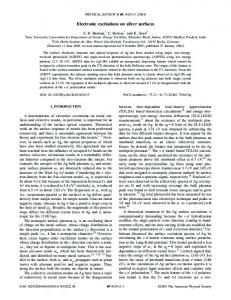
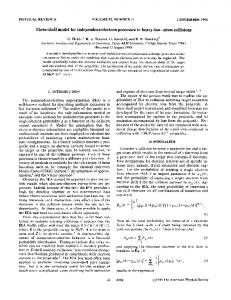
FIG. 1. Dispersion relations for the L , L� , T , and T� modes (k� � ka) at � � 40 and different layer separations. The legend shown in the d� � d=a � 0:6 plot applies to all panels. Lines: QLCA; symbols: MD simulation. Inset shows the observed values of k�cutoff of the T mode.
dinal mode may be regarded as a density oscillation of the dipoles: with a 1=r3 type dipole-dipole interaction, this suggests an ! / k dispersion. This is borne out by the present calculation: the mode shows an acoustic behavior, similarly to the RPA result, but with a phase velocity instead of being proportional to �d=a�1=2 Ris of the order of d=a: s !L �k ! 0�=k � !0 d��99=96� dr�g12 �r�=�r2 1=2 [see Fig. 2(b)]. (iii) In addition to the 2 longitudinal modes 2 transverse shear modes appear, with a behavior qualitatively similar to their longitudinal counterparts, except that, as expected for shear modes in a liquid, the T
mode does not extend below a finite kC value (see Fig. 1 inset) [15]. (iv) For k ! 1 all four modes approach the Einstein frequency (the frequency of oscillation of a single particle in the frozen environment of the others) [7] of the
(3)
now exhibits a behavior significantly different from its RPA counterpart. These dispersion curves were calculated by using MD-generated hij �r� data and are displayed together with MD results (see below) in Fig. 1. (i) At k � 0 the � mode becomes a gapped mode [see also Fig. 2(a)], with !L� �k � 0� � !T� �k � 0� �G �d�;
(4)
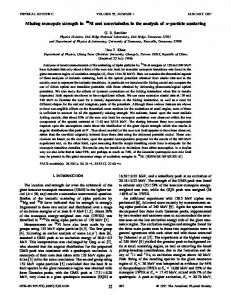
where �G �d� is a functional of h12 �r� as given in [14]. In the BPBL h12 �r� is governed by a central peak h012 �r� around r � 0 [2] [see Fig. 2(c)]. For d=a < 1 �G �d� is well described by replacing h12 �r� by h012 �r�. When this central peak is approximated by a Gaussian (representing a thermally excited dipole) �G �d� becomes �0K �d�, the thermally broadened small amplitude oscillation p������������������ � 2 3 Kepler frequency �K �d� � 2e =d m � !0 �a=d�3=2 of the oscillating dipole. Dipole-dipole correlations shift �G �d� from this value only for d=a > 1. (ii) The longitu-
FIG. 2. (a) Dependence of the Kepler frequency �K , the thermally shifted Kepler frequency �0K , and the gap frequency �G on d� at � � 80. Also shown for comparison is the EBL gap. (b) s sound velocity versus d� for � � 80. (c) MD pair correlation functions for � � 80 and d� � 0:6 (left [right] vertical scales pertain to the left [right] horizontal segment of the diagram).
236801-2
PRL 98, 236801 (2007)
PHYSICAL REVIEW LETTERS
system: �2E �d� � �2E;2D 12�2G �d�;
(5)
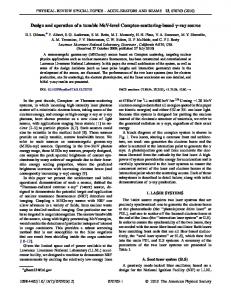
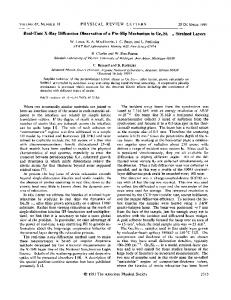
R where �2E;2D � �!20 =2� dr�g11 �r�=r�2 0:38!20 is the Einstein frequency of an isolated 2D layer [16] (see later). Illustrative longitudinal and transverse current-current correlation spectra obtained from our MD simulations (based on the particle-particle –particle-mesh method [17] with periodic boundary conditions) are displayed in Fig. 3 for � � 40 and d=a � 0:6. The MD-generated dispersion relations inferred from the spectral peaks for the 4 modes for � � 40 and for a series of d=a values are displayed in Fig. 1, together with theoretically calculated values. Agreement between the QLCA theory and simulation data is very good, especially for lower k values. Deviation from the characteristic d3=2 behavior of �K �d� seems to occur on passing the (dipole liquid)/(Coulomb liquid) phase boundary around d=a � 1:1 and 1.4 for � � 40 and 80, respectively [2]. Comparison with the EBL spectrum [7,8] reveals a more pronounced and more robust gap value [Fig. 2(a)], which is not unexpected if one is mindful of the different physical mechanisms responsible for creating the gap. A remarkable feature of the simulation spectra is the appearance of higher harmonics of the gap frequency: we observe the emergence (a) of the third harmonic in the � spectra and (b) of the second harmonic (but not the fundamental) in the spectra [Fig. 4]. These harmonics are the most pronounced around � � 40 in the strongly coupled dipole-liquid phase, showing a diminishing trend both for lower and higher coupling values: at high � values the low amplitude of the thermally excited oscillations is not con-
FIG. 3. Longitudinal current (a), (b) and transverse current (c), (d) fluctuation spectra obtained at � � 40 and d� � 0:6. The arrows indicate increasing wave numbers k� as listed in the panels. Note the appearance of higher harmonics of the gap frequency: the second and fourth harmonic in the spectra, and the third harmonic in the � spectra.
week ending 8 JUNE 2007
ducive to the generation of harmonics, while at lower � values the thermal motions damp the higher harmonics. We calculate the phonon spectrum of the crystalline phase, through the standard harmonic approximation, by summing over a lattice of 2 � 107 sites. In the solid phase the BPBL crystallizes in a hexagonal structure, with the particles in the two layers facing each other (for any layer separation, in contrast to the EBL that exhibits a variety of lattice structures). The mode spectrum is shown in Fig. 5. One can recognize the 4 modes identified in the liquid state, with an expected anisotropic dispersion and with the understanding that the ‘‘longitudinal’’ and ‘‘transverse’’ labeling of the modes describes their polarization for propagation along the principal crystal axes only. The � modes in the lattice spectrum exhibit a k � 0 gap, very similar to the one in the liquid spectrum; in contrast to the EBL, the gap is not split by the lattice anisotropy. This is a consequence of the quasi-isotropy of the hexagonal lattice environment to O�k2 �. Physically, the � modes can be regarded, in a good approximation, especially for small d=a values, as the superposition of a mode on the �K dipole oscillation frequency. The angle-averaged modes emulate the liquid-phase mode dispersion for low and moderate k values, but deviate substantially from it for k ! 1. To understand this difference, one has to focus on h012 �r�, which shows a quasi-Gaussian behavior in the liquid, but becomes a delta function in a perfect T � 0 lattice. The contribution of oscillating dipoles within a Gaussian distribution results in a superposition of random phases at k ! 1, averaging out to 0, ensuring the limit shown in Eq. (5). In contrast, a delta-function distribution generates coherent k-independent terms that survive for k ! 1. The simulation results clearly indicate that even for high � values the large but finite k dispersion curves follow the trend set by Eq. (5) that pertains to the liquid, rather than the one pertaining to the lattice. The great sensitivity of the behavior of the mode dispersions at higher k values to the width of h012 �r� could motivate an observational technique to acquire information on the
FIG. 4. Longitudinal current fluctuation spectra showing the higher harmonics of the gap frequency for k� � 3:54, d� � 0:6. The transverse spectra behave similarly.
236801-3
PRL 98, 236801 (2007)
PHYSICAL REVIEW LETTERS
FIG. 5. (a) Lattice dispersion of the quasi-L and quasi-L� (solid lines) and quasi-T and quasi-T� (dashed lines) modes for a series of lattice angles between 0� � � � 30� (� � 0� corresponds to the nearest neighbor direction, the arrows indicate increasing �). (b) Comparison at d� � 0:6 of QLCA (at � � 80) and angular averaged lattice dispersion.
width of central peak distribution through tracking the high-k behavior of the collective excitations. The phonon spectrum in the BPBL was the subject of a recent investigation by [18]. This work addressed the behavior of the dipolar ‘‘phase’’ within a model that represents the system as a 2D (d � 0) lattice of dipoles with an intrinsic degree of freedom: this approach, reasonable as it may appear, leads to the violation of the local rotational symmetry exhibited by the 2D hexagonal lattice [19]. In particular, [18] finds (i) that the gap is split and there are disparate transverse and longitudinal gap values, (ii) that both of these exhibit an anisotropic behavior, and (iii) that for k ! 0 the � mode dispersion curves exhibit a negative slope. These features violate basic physical principles pointed out above. In summary, we have determined the dispersion characteristics of a strongly coupled symmetric bipolar (electronhole) bilayer in the strongly coupled domain, where the dominant exchange-correlation energy provides a sufficient quasilocalization of the particles to engender a quasiclassical behavior. Our analysis in the strongly coupled liquid phase is based on the MD simulation of the density and current fluctuation spectra and on the application of the theoretical QLCA technique. The benchmark phonon spectrum in the crystalline solid phase is determined through lattice summation technique. The results of all these various approaches reinforce each other and provide a coherent physical picture. The 4 modes, characteristic of bilayer systems [in phase (out of phase), longitudinal (transverse)] emerge, with the expected k � 0 energy gap in the spectrum of the out-of-phase mode [7,8]. The latter now is mostly governed by the intrinsic oscillation frequency of the dipoles and affected by collective interaction only in the Coulomb phase, for d * a. A remarkable effect, unique to the strongly coupled liquid phase, the generation of harmonics of the gap frequency and the transfer of the even harmonics from the out-of-phase to the in-phase mode, has been observed.
week ending 8 JUNE 2007
While the QLCA description of the collective modes captures the dominant physics, the quantum simulation results of [5] point at two effects that may somewhat modify the QLCA mode dispersion: (i) all the peaks— especially the central one —of g12 �r� are broadened by the finite width of the wave packets [compare Fig. 2(c) with Fig. 3 of [5]) [this would be reflected in a similar modification of Dij �k�], (ii) the presence of a condensate which would manifest itself by reducing the quasilocalization of the particles (as clearly demonstrated by [20]). A rough estimate of this expected reduction is provided by replacing hij �k� [and thus Dij �k�] by h�ij �k� � �1 � f�2 hij �k�, where f is the condensate fraction, as suggested by [21]. Since f in the SC regime is expected to be quite small (f � 0:02 [5]), this should not be a dramatic effect. This work was supported by NSF Grants No. PHY0514619 (G. J. K.) and No. PHY-0514618 (K. I. G.), and by Hungarian Grants No. OTKA T-48389, No. PD-049991, No. MTA-OTKA-90/46140, and No. OTKA-IN-69892 (P. H. and Z. D.).
[1] P. B. Littlewood and X. Zhu, Phys. Scr. T68, 56 (1996); U. Sivan et al., Phys. Rev. Lett. 68, 1196 (1992). [2] P. Hartmann et al., Europhys. Lett. 72, 396 (2005). [3] Yu. E. Lozovik and V. I. Yudson, Pis’ma Zh. Eksp. Teor. Fiz. 22, 556 (1975) [JETP Lett. 22, 274 (1975)]; Solid State Commun. 19, 391 (1976); T. Fukuzawa et al., Phys. Rev. Lett. 64, 3066 (1990). [4] P. Ludwig et al., Phys. Status Solidi B 243, 2363 (2006); A. V. Filinov et al., Phys. Status Solidi C 0, 1518 (2003); J. E. Golub et al., Phys. Rev. B 41, 8564(R) (1990). [5] S. De Palo et al., Phys. Rev. Lett. 88, 206401 (2002). [6] Y. N. Joglekar et al., Phys. Rev. B 74, 233302 (2006). [7] G. Kalman et al., Phys. Rev. Lett. 82, 3124 (1999). [8] Z. Donko´ et al., Phys. Rev. Lett. 90, 226804 (2003). [9] S. Ranganathan and R. E. Johnson, Phys. Rev. B 69, 085310 (2004). [10] K. I. Golden and G. J. Kalman, Phys. Plasmas 7, 14 (2000); 8, 5064 (2001). [11] Z. Donko´ et al., Phys. Plasmas 10, 1563 (2003). [12] K. I. Golden et al., Phys. Rev. E 70, 026406 (2004); 71, 036401 (2005). [13] G. Kalman and K. I. Golden, Phys. Rev. A 41, 5516 (1990). [14] K. I. Golden et al., Phys. Rev. E 74, 056405 (2006). [15] M. S. Murillo, Phys. Rev. Lett. 85, 2514 (2000); V. Nosenko et al., Phys. Rev. Lett. 97, 115001 (2006). [16] K. I. Golden et al., Phys. Rev. A 46, 3454 (1992); 46 3463 (1992). [17] R. W. Hockney and J. W. Eastwood, Computer Simulation Using Particles (McGraw-Hill, New York, 1981). [18] D. V. Kulakovskii et al., JETP 99, 850 (2004). [19] L. Bonsall and A. A. Maradudin, Phys. Rev. B 15, 1959 (1977). [20] J. B. Mayers, Phys. Rev. B 64, 224521 (2001). [21] G. J. Hyland et al., Phys. Lett. A 31, 465 (1970).
236801-4