African Journal of Biotechnology Vol.11 (59), pp. 12339-12355, 24 July, 2012 Available online at http://www.academicjournals.org/AJB DOI: 10.5897/AJB11.3506 ISSN 1684-5315 ©2012 Academic Journals
Full Length Research Paper
Response surface methodology for optimization of the treatment of textile wastewater by a novel bacterial consortium: Enzymes and metabolites characterization Lamia Ayed1*#, Imen Ksibi2#, Abdelkarim Cheref3 and Amina Bakhrouf1 1
Laboratoire d’Analyse, Traitement et Valorisation des Polluants de l’Environnement et des Produits, Faculté de Pharmacie, Rue Avicenne, 5000 Monastir, Tunisie. 2 Unité de Recherche Chimie Appliqué et Environnement. Faculté de Science. Avenue de l'environnement 5019 Monastir–Tunisie. 3 Laboratoire de Géochimie et Physicochimie de l’Eau, CERTE, Technopole Borj Cedria 2073 Nabeul, Tunisie. Accepted 7 May, 2012
Textile wastewater (TWW) causes many environmental problems, and colored substances must be removed from it before their discharge into the environment. An optimization process was analyzed using custom response surface methodology (RSM). In the present study, the effect of different combinations of eight strains was studied using equilateral triangle diagram (Minitab 14.0) and mixture experimental design to assess color and chemical oxygen demand (COD) removal during the growth of species. Under optimal conditions, the bacterial consortium developed was able to decolorize completely (>84%) the dye within 72 h. The color and COD removal were 89.97 and 84.71%, respectively. A significant increase in azoreductase, lignin peroxidase and laccase activities in the cells were obtained after complete decolorization. Ultraviolet (UV)–vis and nuclear magnetic resonance (NMR) spectroscopy analysis confirmed the biodegradability of the TWW by the developed bacterial consortium. Key words: Biodegradation, decolorization, textile wastewater, response surface methodology, nuclear magnetic resonance (NMR), UV–visible.
INTRODUCTION The textile industries discharge wastewater originating from the dyeing and finishing processes. The use of organic dyes in these industries has reached an amount of 700 000 tonnes/year, while an annual world production of 30 million tonnes of textiles is reported (Abraham, 1993). Wastewater generated by different production steps of a textile mill have high pH, temperature, detergents, oil, suspended and dissolved solids, toxic and
*Corresponding author. E-mail:
[email protected]. +21673461000. Fax: +21673461830.
Tel:
#These authors contributed equally to this work.
Abbreviations: TWW, Textile wastewater; RSM, response surface methodology; COD, chemical oxygen demand; UV, ultraviolet; NMR, nuclear magnetic resonance.
non-biodegradable matter, color and alkalinity. Wastewater from fabric and yarn printing and dyeing pose serious environmental problems both because of their color and high chemical oxygen demand (COD) (Kumar et al., 2007). Important pollutants in textile effluent are mainly recalcitrant organics, color, toxicants, and surfactants, chlorinated compounds, pH and salts effect (Ayed et al., 2011a). Therefore, up to 40% of the color is discharged in the effluent from reactive dyeing operation resulting in a highly colored effluent (Kim et al., 2008; Carr, 1995; EPA, 1995). Color, a hard-to-treat textile waste originating primarily from dyeing or printing operations is being increasingly regulated and is widely recognized as a significant problem (Kobayashi and Rittmann, 1982). Effluent from most textile dyeing operations generally has a dark reddish-brown color that is aesthetically unpleasing when
12340
Afr. J. Biotechnol.
Table 1. Operating conditions.
Parameter COD (mg O2/L) BOD (mg O2/L) Glucose (g/L) Yeast extract (g/L) Inoculum pH Color (C.U) Salinity mg/L Phenol mg/L
Value 4503 4300 1.25 3.0 10% 11.3 1346 12386 148
discharged to receiving waters. The relatively low fixation efficiency of the dyes results in effluent color, which is not easily removed in treatment systems. Although many methods of color removal exist, none of them works in every case. Color can interfere with the transmission of light in receiving waters; high doses of color can interrupt photosynthesis and aquatic life. It can also interfere with ultraviolet (UV) disinfection of treated wastewater (Kobayashi and Rittmann, 1982). Those chemicals are discharged into wastewater in different process stages of textile industry. So, textile wastewater containing dyes must be treated before their discharge into the environment (Kobayashi and Rittmann, 1982). Physicochemical methods are applied for the treatment of this kind of wastewater, achieving high dye removal efficiency (Vandevivere et al., 1998). Numerous processes have been proposed for the treatment of colored wastewater example, precipitation, flocculation, coagulation, adsorption and wet oxidation (Hongman et al., 2004; Thomas et al., 2006). All these methods have different color removal capabilities, capital costs and operating speed. Among low cost, viable alternatives, available for effluent treatment and decolorization, the biological systems are recognised by their capacity to reduce biochemical oxygen demand (BOD) and chemical oxygen demand (COD) through conventional aerobic biodegradation (Kornaros and Lyberatos, 2006; Balan and Monteiro, 2001). On the other hand, in recent years, there is a tendency to use biological treatment systems to treat dye-bearing wastewater. Aerobic processes have been recently used for the treatment of textile wastewater as standalone processes and it is confirmed that they are efficient and cost-effective for smaller molecules. The use of an aerobic reactor is an effective technique to treat industrial wastewater (Coughlin et al., 2002; Khehra et al., 2005; Buitron et al., 2004; Sandhaya et al., 2005). So, bacteria capable of dye decolorization, either in pure cultures or in consortia have been reported. The utilization of microbial consortia offers considerable advantages over the use of pure cultures in the degradation of synthetic dyes (Jadhav et al., 2010). Response surface methodology (RSM) is defined as a
tool to analyse the effect of a selected response of independent variables and for modelling of complex systems (Ayed et al., 2010c). RSM is a useful approach for analysing biological processes and has been used widely in food science and technology, microbiology and enzyme applications (Ayed et al., 2010c). Mixtures methodology and RSM could be associated by studying the physical characteristics of the measured response surface such as the shape, slope or the highest point (Ayed et al., 2010c). This work aims to optimize the treatment of textile wastewater by a novel bacterial consortium (Pseudomonas cepacia, Pseudomonas vesicularis, Sphingomonas paucimobilis, Bacillus cereus ATCC 14579, B. cereus ATCC 11778, Staphylococcus epidermidis, filamentous bacteria and Bacillus sp.) using custom response surface methodology (RSM). However, the selection of optimal conditions for the growth and the different proportions of the eight microorganisms using the response surface methodology could ameliorate the decolorization performances of the cells for the textile wastewater. The produced metabolites during the degradation were also characterized using UV–vis and nuclear magnetic resonance (NMR) spectroscopy analysis. MATERIALS AND METHODS Samples and chemicals In this study, textile wastewater (λmax = 423 nm), which was supplied from a textile factory located in KsarHellal, Tunisia, was used. The characteristics of the used textile wastewater are summarized in Table 1. All chemicals used were of the highest purity available and of analytical grade. Microorganisms and culture media Eight microorganisms, P. cepacia, P. vesicularis, S. paucimobilis, B. cereus ATCC 14579, B. cereus ATCC 11778, filamentous bacteria and Bacillus sp. were used in this study. S. paucimobilis, Bacillus sp. and S. epidermidis were isolated in previous works of Ayed et al. (2009a, b, 2010a, b, 2011a, b), with the ability of degrading azo and triphenyl methane dyes (Congo red, methyl red, malachite green, phenol red, fushin, methyl green and crystal violet). P. cepacia and P. vesicularis were isolated from textile wastewater plant in Ksar- Hellal (Tunisia). B. cereus ATCC 14579 and B. cereus ATCC 11778 were isolated in previous works of Ayed et al. (2010c) with the ability of degrading azo dye methyl Orange. The used medium was composed in 1000 ml of textile wastewater (COD, 4300 mg O2/L; BOD, 4503 mg O2/L; color, 1346 CU), glucose (1250 mg/L), yeast extracts (3000 mg/L) and it was maintained at a constant pH of 7 by the addition of phosphate buffer (Plackett and Burman, 1946; Wang et al., 2006). Decolorization experiments For the decolorization experiments, wastewater had been treated in a series of 250 ml Erlenmeyer flasks on a rotary shaker operating at 150 rpm. The consortium was grown at 30°C for 48 h in 50 ml of the medium (autoclaved at 121°C for 15 min). The medium contained (per/L of the above wastewater) 3.0 g/L y east extract and 1.25 g/L
Ayed et al.
12341
glucose and was inoculated with bacterial biomass (cell density fixed at OD600 = 1 with the addition of within 24 h at pH 7, 150 rpm and 30°C) (Ayed et al., 2010a, b).
and 10% of mixed culture which were inoculated into the effluent solution (3.0 g/L yeast extract and 1.25 g/L glucose) at 37°C for 10 h in shaking conditions (150 rpm).
Assays
Statistical analysis
Samples (10 ml) were drawn every 24 h from the shake-flasks, centrifuged at 8000 rpm for 10 min and the supernatants were used for the determination of decolorization efficiency (Ghanem et al., 2000). The precipitant was used to calculate the bacteria mass. Absorbance of the supernatant withdrawn at different time intervals were measured at the maximum absorption wavelength for the effluent (λmax = 423 nm) using a Shimadzu double beam spectrophotometer (UV 1601). The determination of chemical oxygen demand was carried out with O'Dell and James (1993) micro method on samples extracted from biodegradation tests of the effluent. The initial absorbance of the effluent was used as a reference. The decolorization and COD removal were calculated according to the following Equations (Ayed et al., 2010a, c, 2011a; Zhou et al., 2007):
The statistical analyses were performed by the use of multiple regressions and ANOVA with the softwares Minitab v 14.0 and Essential Regression v 2.2. The significance of each variable was determined by applying Student’s t-test (Deligiorgis et al., 2008; Wang et al., 2006). The P-value is the probability that the magnitude of a contrast coefficient is due to random process variability. A low P-value indicated a “real” or significant effect.
I-F Color removal (%) =
× 100 I
(1)
Where, I is the initial concentration of the effluent and F is the concentration of the effluent at time t (min). Initial COD – Observed COD (t) COD removal (%) =
× 100 Initial COD
(2)
All assays were carried in triplicate.
Experimental design and methods The D-optional method in the experimental design, provided by the software Minitab (Ver. 14.0, U.S. Federal Government Commonwealth of Pennsylvania, USA), was used to optimize the formulation of the microbial consortium. Response surface methodology (RSM) is an empirical quadratic modelling technique that provides the relationship between a set of controllable experimental factors and observed results. This technique is employed to study the interactions among various factors and their corresponding responses. It is also used to optimize all affecting parameters collectively by statistical experimental design (Xudong and Rong, 2008; Liu et al., 2009). It is usually applied following a screening study to explore the region of interest of the factors identified by the preceding study (Ayed et al., 2011a). The mixture design is widely used in the formulation of food experiment, chemicals, fertilizer, pesticides, and other products. It can estimate the relationship between formulation and performance through regression analysis in fewer experiment times (Zhang et al., 2006). Generally, the mixture design was used to study the relationships between the proportion of different rate of bacteria (Table 2) and responses (color and COD removal) (Table 3). Since Scheffe devised a single-lattice and single-core design in 1958, the mixture design has developed a variety of methods (Ayed et al., 2010a). In this study, S. paucimobilis, Bacillus sp., S. epidermidis, B. cereus ATCC 14579, B. cereus ATCC 11778, P. cepacia, P. vesicularis and filamentous bacteria were used as mixture starters, ranging from 0 to 100%, as shown in Table 2. Decolorization experiments was taken according to the ratio given by the experiment design,
Enzymatic activities P. cepacia, P. vesicularis, S. epidermidis, S. paucimobilis, B. cereus ATCC 14579, B. cereus ATCC11778, filamentous bacteria and Bacillus sp. cells were grown separately in the nutrient broth (pH 6.6) incubated at 30°C for 24 h and harvested by centrifugation at 10.000 × g for 20 min. These cells (ca. 12 g L-1) were suspended in potassium phosphate buffer (50 mM, pH 7.4) for sonication (Sonics vibra-cell ultrasonic processor), keeping sonifier output at 40 A and giving 8 strokes each of 40 s with a 2 min interval at 4°C. This extract was used as source of enzyme without centrifugation. Similar procedures were followed for the obtained cells after complete decolorization (6 h) (Ayed et al., 2010c). The enzymatic activities of S. paucimobilis, B. cereus ATCC 14579 and B. cereus ATCC11778 were studied in previous works of Ayed et al. (2010c). Lignin peroxidase (Lip) and laccase activities were assayed in cell-free extract, as well as in culture supernatant. Lip activity was determined by monitoring the formation of propanaldehyde at 300 nm in the reaction mixture of 2.5 ml containing 100 mM n-propanol, 250 mM tartaric acid and 10 mM H2O2 (Ayed et al., 2010c). Laccase activity was determined in the reaction mixture of 2 ml containing 0.1% 2,2’-azino-bis (3-ethylbenzothiazoline-6-sulfonic acid (ABTS) (Sigma, St. Louis, USA) in 0.1M acetate buffer (pH 4.9) and monitored by measuring the increase of optical density at 420 nm (Ayed et al., 2010c). Enzyme assays were carried in triplicate at 30°C. The blanks contained all components except the enzyme. One unit of enzyme activity was defined as a change in absorbance unit min-1 mg protein-1. Azoreductase activity was determined by monitoring the decrease in the methyl orange concentration at 466 nm by the reaction mixture of 2.2 ml containing 152 mM methyl orange, 50 mM sodium phosphate buffer (pH 5.5) and 20 mM NADH. One unit of enzyme activity was defined as a microgram of methyl orange reduced min-1 mg protein-1 (Ayed et al., 2010c). Malachite green reductase activity was determined as described previously by Ayed et al. (2010c). All assays were carried out in triplicate.
UV- Vis and NMR spectral analysis Decolorization was monitored by UV–Vis spectroscopic analysis, whereas biodegradation was monitored using FTIR Spectroscopy. The decolorization of the dye was followed by monitoring changes in its absorption spectrum (200 to 700 nm) using a Hitachi UV–Vis spectrophotometer (Hitachi U-2800). The obtained results were compared to those of the respective controls. The produced metabolites during the dye biodegradation were centrifuged at 15,000 rpm for 30 min after complete degradation of effluent to remove any remained bacterium (Ayed et al., 2010a, b, c). Metabolites were extracted from supernatant by adding equal
12342
Afr. J. Biotechnol.
Table. 2. Mixture design matrix with the experimental
M(I)
M(II)
M(III)
Assay
P. cepacia
P. vesicularis
Bacillus sp.
Bacillus cereus ATCC14579
Bacillus cereus ATCC11778
Filamentous bacteria
1 2 3 4 5 6 7 8 9 10
1.000 0.000 0.000 0.500 0.500 0.000 0.333 0.666 0.166 0.166
0.000 1.000 0.000 0.500 0.000 0.500 0.333 0.166 0.666 0.166
0.000 0.000 1.000 0.000 0.500 0.500 0.333 0.166 0.166 0.666
1.000 0.000 0.000 0.500 0.500 0.000 0.333 0.666 0.166 0.166
0.000 1.000 0.000 0.500 0.000 0.500 0.333 0.166 0.666 0.166
0.000 0.000 1.000 0.000 0.500 0.500 0.333 0.166 0.166 0.666
Sphingomonas Paucimobilis 1.000 0.000 0.000 0.500 0.500 0.000 0.333 0.666 0.166 0.166
Bacillus sp.
Staphylococcus epidermidis
Total
0.000 1.000 0.000 0.500 0.000 0.500 0.333 0.166 0.666 0.166
0.000 0.000 1.000 0.000 0.500 0.500 0.333 0.166 0.166 0.666
1,000 1,000 1,000 1,000 1,000 1,000 1,000 1,000 1,000 1,000
Table 3. Experimental analyses.
M(I) Assay
COD removal (%)
1 2 3 4 5 6 7 8 9 10
9.434 43.962 24.339 23.396 36.981 41.283 38.113 30.377 46.981 47.622
M(II) Decolorization (%) 83.090 79.873 86.428 81.576 87.347 82.968 84.428 83.360 79.535 85.292
volume of ethyl acetate; the samples were used for UV–Vis spectral analysis. All 1HNMR spectra were recorded on a Bruker Avance 300 spectrometer at 300.13MHz at 300 K. The dried samples were dissolved in DMSO-d6 and transferred to 5 mm-diameter tubes. The water was suppressed by the
COD removal (%)
Decolorization (%)
75.581 44.302 11.860 56.976 52.093 50.930 59.302 62.093 53.023 49.302
80.348 75.912 79.592 79.765 78.102 79.483 77.550 79.093 77.034 79.190
M(III) COD removal Decolorization (%) (%) 20.377 42.426 31.509 46.361 4.1509 53.292 31.886 45.977 30.754 49.741 35.660 50.754 44.339 52.042 43.207 51.701 42.264 48.974 23.396 52.293
classical double-pulsed field gradient of echo sequence: WATERGATE. In total, 64 scans were collected (relaxation delay, 5 s; acquisition time, 3.64 s; spectral window of 3420 Hz; 32,000 data points). A 0.3 Hz line broadening was applied before Fourier transformation and a baseline correction was performed on the spectra before integration
M(IV) COD removal (%)
Decolorization (%)
85.156 70.833 73.177 83.593 87.630 81.562 86.302 87.208 74.557 79.052
89.401 84.443 84.143 89.221 87.485 88.922 90.119 90.059 87.844 89.940
with Bruker software. Proton Nuclear Magnetic Resonance (NMR), 1H NMR studies were used for the effluent dye before bacterial consortium treatment and for the produced products. The samples were prepared after 6 h of incubation of S. paucimobilis, Bacillus sp., S. epidermidis, B. cereus ATCC 14579, B. cereus ATCC 11778, P.
Ayed et al.
12343
Table 4. Analysis of variance of COD removal% (ANOVA) for the selected linear and interactions model for effluent textile wastewater (M I).
Source Regression Linear Quadratic Residual Error Total
DF 5 2 3 4 9
Seq SS 56.0894 51.1811 4.9082 4.2838 60.373
Adj SS 56.089 26.985 4.908 4.283
Adj MS 11.217 13.492 1.6361 1.0709
F 10.47 12.60 1.53
P 0.020 0.019 0.337
Table 5. Analysis of variance of color removal% (ANOVA) for the selected linear and interaction model for effluent textile wastewater (M I).
Source Regression Linear Quadratic Residual Error Total
DF 5 2 3 4 9
Seq SS 1237.05 718.71 518.34 116.89 1353.94
Adj SS 1237.048 695.122 518.337 116.890
Adj MS 247.410 347.561 172.779 29.222
F 8.47 11.89 5.91
P 0.030 0.021 0.059
cepacia, P. vesicularis and filamentous bacteria in the cultivation medium containing the effluent. The dried samples were dissolved in deuterated dimethyl sulfoxide (DMSO d6) for recording the 1H NMR Bruker 300 UltraShield TM 300MHz NMR (Ayed et al., 2010c).
ATCC 11778 and S6 is filamentous bacteria
RESULTS
YCOD = 21.995 S7 + 31.412 S8 + 1.498 S9 + 39.897 S7*S8 + 84.974 S7*S9 + 78.902 S8*S9 2 R = 90.08 %; P = 0.03
Model establishment Through linear regression fitting, the regression models of two responses (Table 3) (COD% and color removal %) were established (Tables 4 to 11) for four mixture design (M (I), M (II), M (III) and M (IV)). The regression model equations are as follows: M (I): Ydecolorization% = 83.091 S1 + 79.522 S2 + 86.526 S3+ (-1.446) S1*S2+ (9.429) S1*S3+ (-2.361) S2*S3 2 R = 92.90 %; P=0.02 YCOD = 8.828 S1 + 44.355 S2 + 25.456 S3 + (-2.905) S1*S2 + (92.127) S1*S3 + 42.275 (S2*S3) 2 R = 91.37 %; P = 0.03 Where, S1 is P. cepacia, S2 is P. vesicularis and S3 is Bacillus sp. M (II): Ydecolorization% = 80.510 S4 + 75.790 S5 + 79.874 S6+ 3.551 S4*S5+ (-9.650) S4*S6+ 4.181 S5*S6 2 R = 83.88 %; P=0.09 YCOD = 74.32 S4 + 43.51 S5 + 13.45 S6 + (-10.56) S4*S5 + 39.55 S4*S6 + 98.41 S5*S6 2 R = 97.63 %; P = 0.02 Where, S4 is B. cereus ATCC 14579, S5 is B. cereus
M (III): Ydecolorization% = 43.138 S7 + 45.879 S8 + 52.742 S9+ 12.837 S7*S8+ 13.897 S7*S9+ 7.691 S8*S9 2 R = 82.00 %; P=0.1
Where, S7 is S. paucimobilis, S8 is Bacillus sp. and S9 is S. Epidermidis. M (IV): Ydecolorization% = 89.319 A + 84.077 B + 84.535 C+ 10.091 A*B+ 5.257 A*C+ 20.353 B*C 2 R = 90.82 %; P=0.03 YCOD = 85.83 A + 69.91 B + 72.90 C+ 16.70 A*B+ 29.45 A*C+ 30.63 B*C 2 R = 88.02 %; P=0.05 Where, A is 29.91% P. cepacia, 14.37% P. vesicularis and 55.71% and Bacillus sp. B: 57.81% B. cereus ATCC 14579, 0.0% B. cereus ATCC 11778 and 42.19% filamentous bacteria; and C: 48.97% S. paucimobilis, 27.23% Bacillus sp. and 23.80% S. epidermidis.
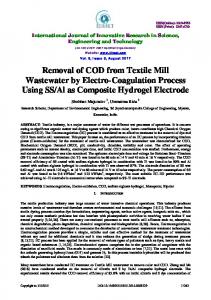
Effect of formulation on the color and COD removal of effluent textile wastewater In the mixture design, the effect of the variables changes on the responses can be observed on the ternary contour
12344
Afr. J. Biotechnol.
Table 6. Analysis of variance of COD removal% (ANOVA) for the selected linear and interaction model for effluent textile wastewater (M II) .
Source Regression Linear Quadratic Residual Error Total
DF 5 2 3 4 9
Seq SS 14.9266 8.6534 6.2731 2.8695 17.7961
Adj SS 14.9266 14.4344 6.2731 2.8695
Adj MS 2.98531 7.21722 2.09105 0.71737
F 4.16 10.06 2.91
P 0.096 0.027 0.164
Table 7. Analysis of variance of color removal% (ANOVA) for the selected linear and interaction model for effluent textile wastewater (M II).
Source Regression Linear Quadratic Residual Error Total
DF 5 2 3 4 9
Seq SS 2356.65 1783.14 573.50 57.25 2413.90
Adj SS 2356.65 2037.72 573.50 57.25
Adj MS 471.33 1018.86 191.17 14.31
F 32.93 71.18 13.36
P 0.002 0.001 0.015
Table 8. Analysis of variance of COD removal% (ANOVA) for the selected linear and interactions model for effluent textile wastewater (M III).
Source Regression Linear Quadratic Residual Error Total
DF 5 2 3 4 9
Seq SS 88.146 67.273 20.872 19.343 107.489
Adj SS 88.1458 53.8555 20.8723 19.3428
Adj MS 17.6292 26.9277 6.9574 4.8357
F 3.65 5.57 1.44
P 0.117 0.070 0.356
Table 9. Analysis of variance of color removal% (ANOVA) for the selected linear and interaction model for effluent textile wastewater (M III).
Source Regression Linear Quadratic Residual Error Total
DF 5 2 3 4 9
Seq SS 1231.99 478.99 753.01 135.61 1367.60
Adj SS 1231.995 514.684 753.006 135.610
Adj MS 246.399 257.342 251.002 33.902
F 7.27 7.59 7.40
P 0.039 0.043 0.041
Table 10. Analysis of variance of COD removal% (ANOVA) for the selected linear and interaction model for effluent textile wastewater (M IV).
Source Regression Linear Quadratic Residual Error Total
DF 5 2 3 4 9
Seq SS 303.414 199.115 104.299 41.296 344.710
Adj SS 303.414 157.502 104.299 41.296
Adj MS 60.6828 78.7511 34.7662 10.3239
F 5.88 7.63 3.37
P 0.055 0.043 0.136
Ayed et al.
12345
Table 11. Analysis of variance of color removal% (ANOVA) for the selected linear and interaction model for effluent textile wastewater (M IV).
Source Regression Linear Quadratic Residual Error Total
DF 5 2 3 4 9
Seq SS 40.2946 12.9993 27.2953 4.0738 44.3684
map. Figures 1 to 4 show the effect of the interaction of P. cepacia, P. vesicularis and Bacillus sp.; B. cereus ATCC 14579, B. cereus ATCC 11778 and filamentous bacteria; S. paucimobilis, Bacillus sp. and Staphylococcus epidermidis; 29.91% P. cepacia, 14.37% P. vesicularis and 55.71% Bacillus sp.; B: 57.81% B. cereus ATCC 14579, 0.0% B. cereus ATCC 11778 and 42.19% filamentous bacteria; C: 48.97% S. paucimobilis, 27.23% Bacillus sp. and 23.80% S. epidermidis on the variation of color and COD removal. The statistical significance of the ratio of mean square variation due to regression and mean square residual error was tested using analysis of variance. Only the obtained results for color and COD removal were presented herein for clarity of purpose. According to ANOVA test (Tables 4 to 11), the regression adjusted average squares and the linear regression adjusted average squares were 247.41, 347.56 and 11.21, 13.49 for MI; 471.33, 1018.86 and 2.98, 7.21 for MII; 246.39, 257.34 and 17.62, 26.92 for MIII; 8.05, 9.27 and 60.68, 78.75 for MIV, allowing the calculation of the Fisher ratios (F-value) for assessing the statistical significance. The model F –value, which were (10.47, 8.47 for MI; 4.16 and 32.93 for MII; 3.65 and 7.27 for MIII; 5.88 and 7.91 for MIV, implies that most of the variation in the response can be explained by the regression equation. The predicted values (using the above equations) were compared with experimental values (Table 3). The summary of the ANOVA tests (analysis of variance) corresponding to the quadratic Equation (MIV) are shown in Table 3, the contour plots of color, and COD removal showed the behavior of the system.
Adj SS 40.2946 18.5483 27.2953 4.0738
Adj MS 8.05892 9.27414 9.09844 1.01844
F 7.91 9.11 8.93
P 0.034 0.032 0.030
or two points are outliers (Figure 5b and 5b’). The histogram presented in Figure 5c and 5c’, of the residuals showed the distribution of the residuals for all the observations. The one long tail in the plot indicated skewness in the data whereas one bar is far from the others, these points were outlined. This last plot of Figure 5d and 5d’ is the residual value and the order of the corresponding observations.
Process optimization curve In order to confirm the experimental results that 90% of color removal was obtained when 84.7% of COD was consumed, a response surface optimization curve was plotted by the MINITAB-14 Software Program. Minimum and maximum values of color removal and COD consumption were fixed at 84 to 91% and 70 to 88%, respectively and target values were fixed at maximum color removal and minimum COD consumption. The obtained results, as shown in Figure 6, clearly indicated that the 89.97% of color removal and the 84.71% COD consumption (y value given in Figure 6) were predicted if the A (29.91% P. cepacia, 14.37% P. vesicularis and 55.71% and Bacillus sp.) proportion was 35.59% (curve value), B (57.81% B. cereus ATCC 14579, 0.0% B. cereus ATCC 11778 and 42.19% filamentous bacteria) proportion was 35.60% (curve value), and C (48.97% S. paucimobilis, 27.23% Bacillus sp. and 23.80% S. epidermidis) proportion was 28.81% (curve value).
UV–vis and NMR Interpretation of residual graph The normal probability plot (Figure 5a and 5a’) showed that the distribution of residual value which is defined as the difference between the predicted (model) and observed (experimental) formed a straight line and residual value are normally distributed on both sides of the line, indicating that the experimental points are reasonably aligned with the predicted value for color and COD removal. The plot between individual residual values and in the fitted value showed that all the residuals are scattered randomly about the zero and one
Figure 7 shows a typical time dependent UV–vis spectrum of effluent TWW solution during the biodegradation. The decrease of absorbance peaks indicated that the dye was removed. The TWW spectrum in visible region exhibits a main peak with a maximum absorbance at 423 nm (Figure 7). As shown in Figure 7 the main absorbance peak approximately disappeared 1 within 72 h. The H NMR spectrum of effluent before biodegradation (Figure 8a) showed signals between 6.6 and 8.5 ppm corresponding to the protons of the two 1 rings. After biodegradation (Figure 8b), the H NMR spectrum of the extracted metabolites without any
12346
Afr. J. Biotechnol.
P. cepacia
(a)
Decolorization(%) < 80 80 - 82 82 - 84 84 - 86 > 86
1
0
0
P. cepacia = 0.234180 cepacia ==0.00483696 0,234180 P. P. vesicularis P. vesicularis = 0,00483696 Bacillus sp. = 0.760983 Bacillus sp. = 0,760983 Decolorization (%) = 87.3579
Decolorization(%) = 87,3579
1
0
P. vesicularis
1
Bacillus sp.
P. cepacia
COD Removal (%) < 10 10 - 20 20 - 30 30 - 40 > 40
1
(b)
0
0
P. cepacia = 0.0133270 cepacia ==0.703396 0,0133270 P.P. vesicularis P. vesicularis = 0,703396 Bacillus sp. = 0.283277 Bacillus sp. = 0,283277 Decolorization (%) = 47.2720
COD Removal (%) = 47,2720
1
P. vesicularis
0
1
Bacillus sp.
Figure 1. Mixture contour plots between the variables (P. cepacia, P. vesicularis and Bacillus sp.) for i Decolorization (%), ii COD removal (%).
purification showed the disappearance of some peaks at 8.5 and 1.6 ppm, corresponding to the characteristic peak of aromatic protons and specific to cyclic ethers. This result shows that the aromatic ether has been biodegraded. In contrast, the spectrum showed the
formation of a number of compounds; the appearance of new peaks between 3.6 and 4.8 ppm which could be derived from biodegradation. It also confirms the results obtained by the method UV-Visible. An important number of signals were observed in the
Ayed et al.
Decolorization (%) < 76 76 - 77 77 - 78 78 - 79 79 - 80 > 80
Bacillus cereus ATCC 14579 1
0
0
1
Bacillus cereus ATCC 11778
0
12347
Bacillus cereus ATCC 14579 = 0,985292 Bacillus cereus ATCC 11778 = 0,0138090 Filamentous bacteria = 0,000898605 Decolorization (%) = 80,4839
1 Filamentous bacteria
A
Bacillus cereus ATCC 14579 1
COD Removal (%) < 20 20 - 30 30 - 40 40 - 50 50 - 60 60 - 70 > 70
Bacillus cereus ATCC 14579 = 0,985549 Bacillus cereus ATCC 11778 = 0,00542240 Filamentous bacteria = 0,00902868 COD Removal (%) = 73,9013
0
1
Bacillus cereus ATCC 11778
0
0
1 Filamentous bacteria
B Figure 2. Mixture contour plots between the variables (Bacillus cereus ATCC 14579, Bacillus cereus ATCC 11778 and filamentous bacteria) for (a) Decolorization (%) and (b) COD removal (%).
1
high field region (0.5 - 3.0 ppm) of the H NMR spectrum, indicating the formation of hydrocarbon aliphatic compounds. Other overlapped signals between 3 and 4
ppm currently attributed to oxygenated methenes and/or methylenes. We also observe that a number of organic contaminants from 0.8 to 1.24 ppm present in sewage
12348
Afr. J. Biotechnol.
Sphingomonas paucimobilis
Decolorizatio (%) < 44 44 - 46 46 - 48 48 - 50 50 - 52 > 52
1
(a)
0
0 Sphingomonas paucimobilis = 0.154673 Sphingomonas paucimobilis = 0,154673 Bacillus sp. = 0.0235674 Bacillus .sp = 0,0235674 Staphylococcus epidermidis = 0.821760 Staphylococcus epidermidis = 0,821760 Decolorization (%) = 53.0571 Decolorization (%) = 53,0571
1
0
Bacillus .sp
1
Staphylococcus epidermidis COD Removal (%) < 10 10 - 20 20 - 30 30 - 40 > 40
Sphingomonas paucimobilis 1
(b)
0
1
Bacillus .sp
0
0
Sphingomonas paucimobilis = 0.290130 Sphingomonas paucimobilis = 0,290130 Bacillus sp..sp = 0.479082 Bacillus = 0,479082 Staphylococcus epidermidis = 0.230788 Staphylococcus epidermidis = 0,230788 Decolorization (%)(%) = 41.7355 COD Removal = 41,7355
1
Staphylococcus epidermidis
Figure 3. Mixture contour plots between the variables (Sphingomonas paucimobilis, Bacillus sp. and Staphylococcus epidermidis.) for (a) decolorization (%) and (b) COD removal (%).
waste textiles, have proven recalcitrant to biodegradation.
Enzymatic analysis The enzymatic activities in P. cepacia, P. vesicularis, S. epidermidis, filamentous bacteria and Bacillus sp. cells before and after complete decolorization of azo dye methyl orange in plain distilled water were represented in Table 12. The term azo dye reduction may involve different mechanisms or locations like enzymatic, non-
enzymatic, mediated, intracellular and various combinations of these mechanisms and locations. Oxidative biodegradation takes place upon action of enzymes such as peroxidases and laccases. Bacterial extracellular azo dyes oxidizing peroxidases have been characterized in P. cepacia, P. vesicularis, S. epidermidis, Bacillus sp. and filamentous bacteria. Lignin peroxidase catalyzes the oxidative breakdown of the azo dye methyl orange. In this study, the induction of lignin peroxidase, azo reductase and MG reductase at shaking condition, strongly indicated that effluent textile wastewater can be
Ayed et al.
(a)
A 1
Decolorization (%) < 85 85 - 86 86 - 87 87 - 88 88 - 89 89 - 90 > 90
A = 0.534540 A = 0,534540 B = 0.280626 B = 0,280626 C = 0.184833 C = 0,184833 Decolorization (%) = 90.0520
Decolorization (%) = 90,0520
0
0
1 B
(b)
0
1 C
A 1
COD Removal (%) < 70 70 - 75 75 - 80 80 - 85 > 85
A = 0.717112 A = 0,717112 B = 0.00878590 = 0,00878590 C =B0.274102 C = 0,274102 Decolorization (%) = 88.1152
COD Removal (%) = 88,1152
0
1 B
0
0
1 C
Figure 4. Mixture contour plots between the variables A, B and C for (a) decolorization (%) and (b) COD removal (%). A: 29.91% P. cepacia, 14.37% P. vesicularis and 55.71% and Bacillus sp. B: 57.81% Bacillus cereus ATCC 14579, 0.0% Bacillus cereus ATCC 11778 and 42.19% filamentous bacteria; C: 48.97% Sphingomonas paucimobilis, 27.23% Bacillus sp. and 23.80% Staphylococcus epidermidis.
12349
12350
Afr. J. Biotechnol.
Normal Probability Plot of the Residuals
Residuals Versus (c) the Fitted Values
(a)
99
1.5 1,5
1,0 1.0
Residual
Percent
90 50 10 1
0,5 0.5 0,0 0.0 -0,5 -0.5
-2
-1
0 Residual
1
2
84,0 84.0
4
1,5 1.5
3
1,0 1.0
2 1 0
87,0 87.0 Fitted Value
88,5 88.5
90,0 90.0
Residuals Versus the Order of the Data
Residual
Frequency
Histogram(b) of the Residuals
85,5 85.5
(d)
0,5 0.5 0,0 0.0 -0.5 -0,5
-1.0 -1,0
-0.5 -0,5
0.0 0.5 0,0 0,5 Residual
1.0 1,0
1.5 1,5
1
Normal Probability Plot of the Residuals
3
4 5 6 7 8 Observation Order
9
10
Residuals Versus the Fitted Values
(a′)
99
2
(b′)
2
Residual
Percent
90 50 10 1
-2 -4
-5.0 -5,0
-2.5 -2,5
0.0 0,0 Residual
2.5 2,5
5.0 5,0
70
Histogram of (c′)the Residuals
75
80 Fitted Value
85
Residuals Versus(d′) the Order of the Data
3
2
2
Residual
Frequency
0
1
0 -2 -4
0
-5
-4
-3
-2 -1 Residual
0
1
2
1
2
3
4 5 6 7 Observation Order
8
9
10
Figure 5. Residual plots for decolorization (%) and COD removal (%). a,a’ Normal probability plot of the residuals; b,b’ histogram of the residuals; c,c’ residual versus the fitted value; d,d’ residual versus the order of the data.
Ayed et al.
Figure 6. Optimization plot to confirm the experimental results that 84.71% COD Removal and 89.97 decolorization when the consortium composition was 35.59% A, 35.60% B and 28.81% C. The desirability (D) was 0.957. A: 29.91% P. cepacia, 14.37% P. vesicularis and 55.71% and Bacillus sp.; B: 57.81% Bacillus cereus ATCC 14579, 0.0% B. cereus ATCC 11778 and 42.19% filamentous bacteria; C: 48.97% Sphingomonas paucimobilis, 27.23% Bacillus sp. and 23.80% Staphylococcus epidermidis.
Figure 7. UV–vis spectra of effluent textile wastewater biodegraded by bacterial consortium (P. cepacia, P. vesicularis, Sphingomonas paucimobilis, Bacillus cereus ATCC 14579, Bacillus cereus ATCC 11778, Sphingomonas paucimobilis, filamentous bacteria and Bacillus sp.) before and after degradation. Temperature = 30°C, pH = 7.0.
12351
12352
Afr. J. Biotechnol.
a
Figure 8. The 1H NMR spectrum of effluent before (a) and after biodegradation (b).
Ayed et al.
b
Figure 8. The 1H NMR spectrum of effluent before (a) and after biodegradation (b).
12353
12354
Afr. J. Biotechnol.
Table 12. Enzymatic activity of control (0 h) and the induced state (48 h decolorization).
Enzymatic activity Control S1 S2 S3 S4 S9
Azo reductase 1.59 ± 0.01 2.48 ± 0.01 4.39 ± 0.01 2.59 ± 0.01 6.33 ± 0.01 2.48 ± 0.01
a
c
Laccase 0.0196 ± 0.009 0.0206 ± 0.010 0.0293 ± 0.008 0.0256 ± 0.007 0.0276 ± 0.006 0.0246 ± 0.009
MG reductase 8.91 ± 0.31 15.81 ± 0.31 19.71 ± 0.31 34.94 ± 0.31 26.61 ± 0.31 17.91 ± 0.44
b
Lignine peroxidase 10 ± 0.3 13.0 ± 0.3 14.33 ± 0.3 12.66 ± 0.3 15.45± 0.3 11.33 ± 0.3
c
a
μmoles of Methyl Orange reduced/mg of protein/minute. bμg of MG reduced/mg of protein/minute. cEnzyme activity – Units /mg of protein/minute. S1: Staphylococcus epidermidis S2: Bacillus sp., S3: Pseudomonas cepacia, S4: Pseudomonas vesicularis and S5: filamentous bacteria.
degraded and reductively cleaved into the simple metabolites.
DISCUSSION The associated P–value is used to judge whether F–ratio is large enough to indicate statistical significance. A Pvalue less than 0.1 (that is; α =0.05 or 95% confidence) indicates that the model may be considered statistically signficant and the quadratic model is statistically significant for the response and therefore it can be used for further analysis (Muteki et al., 2007). The P–value for the regression obtained for color and COD removal for the four design expert was less than 0.1 and means consequently that at least one of the terms in the regression equation has significant correlation with the response variable. The ANOVA test also shows a term for residual error, which measures the amount of variation in the response data left unexplained by the model (Elibol, 2002). All points from the residual plot lies close to the straight line confirming the conjecture that affects other than those considered in the model may be readily explained by random noise (Ayed et al., 2010c). The plot is useful when the order of the observations may influence the results which can occur when the data is collected in a line sequence. This plot can be helpful to a designed experiment in which the runs are not randomized. For residual activity data, the residuals appear to be randomly scattered about zero. No evidence exists that the regression terms are correlated one with another (Harbi et al., 2010; Ravikumar et al., 2007). The decrease of absorbance of effluent showed a rapid degradation of the dye. According to Chen et al. (2008), the biodecolorization of dyes can be due to the adsorption to the biomass or the biodegradation. If the color removal is attributed only to the biodegradation, either the major visible light absorbance peak will disappear or a new peak will appear. In addition an extra absorbance peaks appeared in the decolorized solution, probably resulting from the absorbance of metabolites or degraded fragments of the dye molecules (Chen et al., 2008). These results indicated that the decolorization by
the consortium may be largely attributed to biodegradation. To confirm this result, the effluent and the produced metabolites were analyzed by NMR spectra. The initial step of the biodegradation of azo compounds is a reductive cleavage of the azo group by azo reductase which cleaves the azo bridge (Jadhav et al., 2008). Moreover, the involvement of fungal peroxidases and laccases for the oxidation of sulfonated azo dyes has been reported earlier (Jadhav et al., 2008). Dawkar et al. (2008) observed the induction of intracellular laccase during the decolorization of Brown 3 REL by using Bacillus sp. VUS. There was absence of riboflavin reductase and azo reductase activities throughout the decolorization process. Additionally, at shaking condition, oxygen inhibits the azo reductase activity required for azo dye reduction (Waghmode et al., 2011).
Conclusions The developed consortium showed a better biodegradation yield as compared to pure cultures, which proved a complementary interaction among various isolated bacteria. The consortium achieved significantly a higher reduction in color (89.97%) and COD removal (84.71%) in 72 h. The biodegradation of the textile wastewater was achieved by the developed consortium using A: 29.91% P. cepacia, 14.37% P. vesicularis and 55.71% Bacillus sp.; B: 57.81% B. cereus ATCC 14579, 0.0% B. cereus ATCC 11778 and 42.19% filamentous bacteria; C: 48.97% S. paucimobilis, 27.23% Bacillus sp. and 23.80% S. epidermidis. A very high regression coefficient between the variables and the responses 2 2 (color and COD removal were R = 90.82% and R = 88.02%, respectively) was obtained, indicating an excellent evaluation of experimental data by polynomial regression model. Furthermore, UV–vis and nuclear magnetic resonance (NMR) spectroscopy analysis confirmed the biodegradability of the TWW by the developed bacterial consortium. The results therefore suggest the potential of the consortium for future application towards treatment of textile wastewaters as the ability of the
Ayed et al.
bacterial consortium to decolorize dye indicates its potential application for decolorizing textile-dyeing effluents. Further pilot scale studies are, however, necessary with this strains for real industrial applications. REFERENCES Abraham R (1993). Dyes Environmental Chemistry: Encyclopaedia of Chemical Technology, Wiley, NY., 8: 672-783. Ayed L, Achour S, Khelifi E, Cheref A, Bakhrouf A (2010a). Use of active consortia of constructed ternary bacterial cultures via mixture design for Congo Red decolorization enhancement. Chem. Eng. J., 162: 495-502. Ayed L, Bakhrouf A, Achour S (2011a). Application of the Mixture Design to decolorize effluent textile wastewater using continuous stirred bed reactor. Water SA, 37: 21-26. Ayed L, Chaieb K, Cheref A, Bakhrouf A (2009a). Biodegradation of triphenylmethane dye Malachite Green by Sphingomonas paucimobilis. World J. Microbiol. Biotechnol., 25: 705-711. Ayed L, Chaieb K, Cheref A, Bakhrouf A (2010b). Biodegradation of triphenylmethane dyes by Staphylococcus epidermidis. Desalination, 260: 137-146. Ayed L, Cheriaa J, Laadhari N, Cheref A, Bakhrouf A (2009b). Biodegradation of Crystal Violet by an isolated Bacillus sp. Ann. Microbiol., 59: 267-272. Ayed L, Khelifi E, Ben Jannet H, Miladi H, Cheref A, Achour S, Bakhrouf A (2010c). Response surface methodology for decolorization of azo dye Methyl Orange by bacterial consortium: Produced enzymes and metabolites characterization. Chem. Eng. J., 165: 200-208 Ayed L, Mahdhi A, Cheref A, Bakhrouf A (2011b). Decolorization and degradation of azo dye Methyl red by Sphingomonas paucimobilis. Desalination, 274: 272-277 Balan DSL, Monteiro RTR (2001). Decolourization of textile indigo dye by ligninolytic fungi. J. Biotechnol., 89: 141-145. Buitron G, Quezada M, Moreno G (2004). Aerobic degradation of the azo dye acid red 151 in a sequencing batch biofilter. Bioresour. Technol., 92:143-149. Carr K ed (1995). Reactive Ryes, Especially Bi-reactive Molecules: Structure and Synthesis, Blackie Academic and Professional, London, pp. 87-122. Chen CH, Chang CF, Ho CH, Tsai TL, Liu SM (2008). Biodegradation of crystal violet by a Shewanella sp. NTOU1. Chemosphere 72: 17121720. Coughlin MF, Kinkle BK, Bishop PL (2002). Degradation of acid orange 7 in an aerobic biofilm. Chemosphere, 46: 11-19. Deligiorgis A, Xekoukoulotakis NP, Diamadopoulos E, Mantzavinos D (2008). Electrochemical oxidation of table olive processing wastewater over boron-doped diamond electrodes: Treatment optimization by factorial design. Water Res., 42: 1229-1237. EPA (1995) Environmental Protection Agency US, EPA Office of Compliance Sector Notebook Project: Profile of the Textile Industry, EPA310R97009, USA, 1995 Elibol M (2002). Response surface methodological approach for inclusion of perflurocarbon in actinohordin fermentation medium. Process. Biochem., 38: 667-773. Environmental Monitoring Systems Laboratory Office of Research and Development U.S. Environmental Protection Agency CINCINNATI, OHIO45268. Method, 4: 1-12. Ghanem NB, Yusef HH, Mahrouse HK (2000). Production of Aspergillus terreus xylanase in solid state cultures: application of the Plackett– Burman experimental design to evaluate nutritional requirements. Bioresour. Technol., 73: 113-121. Harbi B, Chaieb K, Jabeur C, Mahdouani K, Bakhrouf A (2010). PCR detection of nitrite reductase genes (nirK and nirS) and use of active consortia of constructed ternary adherent staphylococcal cultures via mixture design for a denitrification process. World. J. Microbiol. Biotechnol., 26: 473-480.
12355
Hongman H, Jiti Z, Jing W, Cuihong D, Bin Y (2004). Enhancement of laccase production by P. ostreatus and its use for the decolourization of anthraquinone dye. Process. Biochem., 39: 1415-1419. Jadhav JP, Kalyani DC, Telke AA, Phugare SS, Govindwar SP (2010). Evaluation of the efficacy of a bacterial consortium for the removal of color, reduction of heavy metals, and toxicity from textile dye effluent. Bioresour. Technol., 101: 165-173. Jadhav SU, Kalme SD, Govindwar SP (2008). Biodegradation of Methyl red by Galactomyces geotrichum MTCC 1360. Int. Biodeter. Biodegr., 62: 135-142. Khehra MS, Saini HS, Sharma DK, Chadha BS, Chimni SS (2005). Decolorization of various azo dyes by bacterial consortium. Dyes. Pigments, 67: 55-61. Kim SY, An JY, Kim BW (2008). The effects of reductant and carbon source on the microbial decolorization of azo dyes in an anaerobic sludge process Dyes.Pigments, 76: 256-263. Kobayashi H, Rittmann BE (1982). Microbial removal of hazardous organic compounds. Environ. Sci. Technol., 16: 170-183. Kornaros M, Lyberatos G (2006). Biological treatment of wastewaters from a dye manufacturing company using a trickling filter. J. Hazard. Mater., 136. 95-102. Kumar P, Prasad B, Mishra IM, Chand S (2007). Catalytic thermal treatment of desizing wastewater. J.Hazard. Mater., 149: 26-34. Liu L, Lina Z, Zheng T, Lin L, Zhenga C, Lin Z, Wang S, Wang Z (2009). Fermentation optimization and characterization of the laccase from Pleurotus ostreatus strain 10969. Enzyme. Microb. Tech., 44: 426-433. Muteki K, MacGregor JF, Ueda T (2007). Mixture designs and models for the simultaneous selection of ingredients and their ratios. Chemometr. Intell. Lab., 86: 17-25. O’Dell and James (1993). Revision 2.0 The determination of chemical oxygen demands by semi-automated colorimetry. Inorganic chemistry branch chemistry research division. Plackett RL, Burman JP (1946).The design of optimum multifactorial experiments. Biometrika, 33: 305-325. Ravikumar K, Krishnan S, Ramalingam S, Balu K (2007). Optimization of process variables by application of response surface methodology for dye removal using a novel adsorbent. Dyes Pigments, 72: 66-74. Sandhaya S, Padmavathy S, Swaminathan K, SubrahmanyamYV, Kaul SN (2005). Microaerophilic-aerobic sequential batch reactor for treatment of azo dyes containing simulated wastewater. Process. Biochem., 40: 885-890. Thomas B, Aurora T, Wolfgang S (2006). Electrochemical decolourization of dispersed indigo on boron-doped diamond anodes. Diam. Relat. Mater., 15: 1513-1519. Vandevivere P, Bianchi R, Verstraete WJ (1998). The effects of reductant and carbon source on the microbial decolorization of azo dyes in an anaerobic sludge process. Chem. Technol. Biotechnol., 72: 289-302. Waghmode TR, Kurade MB, Govindwar SP (2011). Time dependent degradation of mixture of structurally different azo and non azo dyes by using Galactomyces geotrichum MTCC 1360. Inter. Biodeter Biodegr., 65: 479-486 Wang X, Zhang XB, Liu JX, Xu QM, Cao B (2006). Application of a mixed experiment design in the study of controlled release urea for watermelon production, Chi. J. Soil Sci., 37: 1142-1145. Xudong L, Rong J (2008). Decolorization and biosorption for Congo red by system rice hull Schizophyllum sp. F17 under solid-state condition in a continuous flow packed-bed bioreactor. Biores. Technol., 99: 6885-6892. Zhang C, Tong HR, Zhang DM, Li HN (2006). Study on optimization of the formula for vegetable protein drink. J. S. Agr. Univ. (Natural Science), 28: 197-200. Zhou JZ, Liou XL, Huang KH, Dong MS, Jiang HH (2007). Application of the Mixture Design to Design the Formulation of Pure Cultures in Tibetan kefir. Agr. Sci. China, 6: 1383-1389.