Floral Index, 1989). Brewer (1993) found that busi- nesses planned to increase gift spend- ing by 6.3% in 1993. The two top recipients of gifts purchased by busi-.
Production &Marketing Reports Communication Could Increase Florists’ Commercial Account Purchases Lori J. Anderson1, Bridget K. Behe2, and Kenneth C. Sanderson3 Additional index words. survey Summary. Two surveys (one of 101 florists and one of 122 businesses) determined that florists spend little time or money recruiting commercial accounts. Poor communication among businesses and florists was a problem. Of the responding businesses, 91% were never contacted by their florists for any reason, and the methods florists did use for recruiting commercial accounts were incompatible with the means that businesses used to choose florists. Because 79% of businesses made some type of pur-
Alabama Agricultural Expt. Station journal no. 11955117. This research was generously funded by the American Floral Endowment. 1
Former Graduate Research Associate, at Department of Horticulture, Auburn University, Alabama. Current address: Environmental Care International, 6161 North Washington Boulevard., Sarasota, FL 34232.
2
Associate Professor, Department of Horticulture, Auburn University, Ala.
3
Professor Emeritus, Department of Horticulture, Auburn University, Ala. The cost of publishing this paper was defrayed in part by the payment of page charges. Under postal regulations, this paper therefore must be hereby marked advertisement solely to indicate this fact.
266
chase from a florist during the year, florists could pursue commercial accounts as a way of increasing sales. When recruiting new accounts, florists should consider businesses’ product preferences, peak gift-giving times, and purchasing preferences.
M
any consumers buy fresh flowers to enjoy in their homes. According to the 1994–95 National Gardening Survey, 25% of American households bought flowers (Gallup, 1995). Businesses also purchase flowers for their clients and employees. Research has been conducted to identify the kinds of consumers that purchase flowers (Behe, 1993; Behe and Wolnick, 1991; Behe et al., 1991); however, little is known about the types and reasons that businesses buy flowers. Business accounts could be an important market segment for florists. By communicating with existing commercial accounts, florists may be able to revitalize during slow periods by increasing commercial account purchases. Retail florists now compete with supermarkets, garden centers, mailorder catalogs, and street vendors. While there has been considerable growth (228% increase) in retail sales for traditional retail florists in the past 10 years, there has been more for nontraditional outlets (261%) (The Floral Index, 1989). Brewer (1993) found that businesses planned to increase gift spending by 6.3% in 1993. The two top recipients of gifts purchased by businesses were major customers (75%) and employees (51%). Christmas (75%) and convention–trade shows (43%) were the top two occasions for business gift giving, and September (24%),
October (30%), November (24%), and December (25%) were the top months for business gift orders. Flowers and plants were not listed among popular business gifts in the 1993 Incentive survey. Incentive’s 1992 FACT survey listed flowers and plants as a major business gift purchase, comprising 2% of business gift sales for the year. Brewer also found that many business gifts were purchased directly from a merchandiser (59%), incentive representatives (36%), advertising specialty counselors (36%), and retail stores (25%). An average of 103 business gifts were given by businesses, and an average of seven business gifts were received by each business in 1992. Our objectives were to investigate 1) florists’ marketing efforts toward commercial accounts and 2) commercial uses of floral products and services.
Materials and methods The Auburn Univ. Horticulture Dept., Alabama Agricultural Expt. Station, and the American Floral Endowment collaborated in a study to determine how businesses purchase flowers from florists. The study consisted of two parts: a survey of florists and a survey of businesses. Florist-directed survey. In developing the florist-directed survey, a preliminary questionnaire was constructed and mailed to five florists for their suggestions. Their suggestions for revisions were considered in forming the final questionnaire. A modified version of Dillman’s total design method was used for this study (Dillman, 1978). The revised florist-directed survey was mailed to 1066 florists randomly selected from 10 cities. The 10 cities were chosen at random from the top 100 metropolitan areas ranked by population (Sales and Marketing Management, 1991): Columbus, Ohio; Charlotte, N.C.; Richmond, Va.; Fresno, Calif.; Worcester, Mass.; Ventura, Calif.; Harrisburg, Pa.; Baton Rouge, La.; Vallejo, Calif.; and Miami. Florists were chosen at random from listings in the cities’ Yellow Pages under “florists.” Two forms were mailed twice to each florist. A long version was mailed on 16 and 29 July, and a short version was mailed on 2 and 23 Sept. 1992. Both forms explained the purpose of the survey and defined “commercial account.” We HortTechnology July/Sept. 1996 ●
6(3)
PRODUCTION AND MARKETING REPORTS requested that the surveys be completed by the owner or active manager. The long form consisted of two parts. The first part was related to the florists’ general characteristics, and the second part was concerned with the florists’ commercial accounts. The long version had a 7% response rate (69 of 1001 mailed). By most reported results, this rate was low (Dillman, 1978), so a random telephone survey was conducted on 18 Aug. 1992 to determine reasons for this low response rate. Results of the telephone survey showed that florists lacked concern for the survey or were too busy to complete the survey. Typical comments from respondents were “it was hard to determine percentages for some of the questions,” “we are not interested in the survey,” and “florists have an aversion for paper work.” Based on these responses, a condensed version of the first survey was constructed and mailed to the nonresponding florists. Miami was removed from the condensed survey due to the disruption by hurricane Andrew. We also removed the businesses with incorrect postal addresses and addresses of all florists who completed the longer survey. We mailed 606 condensed surveys and received 52 surveys answered for a 9% response rate. The shorter version contained many of the questions from the longer version and included a postcard to help document the low response rate. On the postcard, the florists were given several choices for reasons they did not complete the survey form. We received 97 postcards for a response rate of 9%.
Of these responses, 30% felt that their time was too limited to complete the questionnaire form, 14% felt that commercial accounts were not important enough to their florist businesses at that time, and 14% didn’t complete questionnaires for any survey or study. Forty-one percent gave other reasons for not answering the survey, including 1) it would take hours of research to complete survey, 2) they were closed in July, 3) business is private information, 4) they were no longer in business, 5) the florist shop is now a gift shop and bookstore, and 6) there was illness or a death in family. The responses from the long and short versions of the survey were combined and compared on three variables: 1) the dollar amount of fresh flowers purchased the preceding week, 2) the percentage of total retail florists’ sales in 1991 accounted for by consumer accounts, and 3) the total retail sales for 1991. A one-way analysis of variance showed that there were no statistically significant differences between the two groups of respondents for all three variables. Thus, responses to identical questions on the two versions were determined to be similar and combined to yield 101 responses. Business-directed survey. The business survey was conducted in Columbus, a well-recognized test market, where 1571 businesses were selected at random from the Columbus Yellow Pages. Of the 1571 businesses, 485 businesses were chosen from five specific categories of firms based on the information from the floristdirected survey: restaurants, real estate companies, insurance companies, doc-
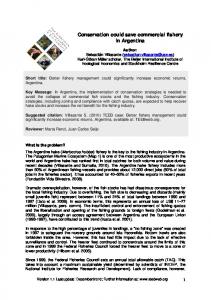
Fig. 1. Percentage of purchases by occasion for commercial accounts. Business survey results. HortTechnology July/Sept. 1996 ●
6(3)
tors’ offices, and churches. Surveys were mailed on 13 and 23 Oct. 1992. Of the 1571 surveys mailed, 167 were returned due to addressing errors, and 122 were returned completed (response rate was 9%).
Results and discussion Florist-directed survey. Florists sell more than just flowers to all their customers. Total product sales for >90% of the responding florists included fresh flowers (56% of retail sales), blooming plants (9% of sales), foliage plants (12% of sales), silk or dried products (9% of sales), and balloons. Most responding florist businesses were small firms with mean total retail sales of $359,338 (about $6,910 weekly) in 1991. The mode was $250,000. The total distribution of 1991 retail sales ranged from $1,100 to $3,000,000, with 50% of the distribution of the total retail sales falling below $250,000. The number of store locations and employment were other indicators that the responding florists were small firms. The surveyed florists had a mean of 1.2 locations. Of respondents, 83% owned one location, and only 14% owned two locations. The Small Business Administration (1995) generally uses employment data as a basis for size comparisons, with firms having