INTERNATIONAL JOURNAL of CIRCUITS, SYSTEMS and SIGNAL PROCESSING Issue 1, Volume 2, 2008
Comparative Study of Chebyshev I and Chebyshev II Filter used For Noise Reduction in ECG Signal MAHESH S. CHAVAN, * RA.AGARWALA, ** M.D.UPLANE Department of Electronics engineering, PVPIT Budhagaon Sangli (MS), INDIA * Department of Electronics and Communication , BBDIT Gaziabad(UP). ** Department of Electronics, Shivaji University Kolhapur (MS), INDIA
[email protected]. Abstract---Signal processing, in general, has a rich history, and its
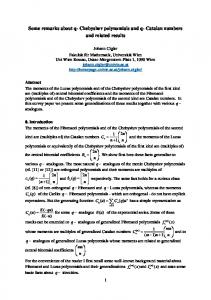
These body surface electrodes are strategically placed on the person’s body particularly at the chest and limbs. In order to record an ECG waveform, a differential recording, referred to as a lead, is made between points on body. The number of Electrodes placed in a variety of combination depends on the desired ECG, wherein every lead system conveys different information about the heart. The basic bandwidth used for the ECG monitoring is from .5 Hz to 100 Hz. Basic ECG waveform is shown in figure 1.
importance is evident in diverse fields as biomedical engineering, acoustics, Sonar. The importance of the digital signal processing appears to be increasing with no visible sign of saturation. The impact of digital signal processing techniques will undoubtedly promote revolutionary advances in some fields of application. A notable example is in the area telephony, medicine. In many medical application, there is need to remove frequency components from a signal while leaving rest of spectrum unaltered. While recording ECG signal it gets corrupted due to different noise interferences and artifacts. Noise and interference are usually large enough to obscure small amplitude features of the ECG hat are of physiological or clinical interest. The bandwidth of the noise overlaps that of wanted signals, so that simple filtering cannot sufficiently enhance the signal to noise ratio. The present paper introduces the digital filtering method to cope with the noise artifacts in the ECG signal. The Chebyshev I and Chebyshev type II filters are applied on the ECG signal. The detailed design procedure with there responses are depicted in the paper. This article also gives the comparison of both types of the filter. It is found that both digital filters works satisfactory with some limitations. All the designs are implemented using MATLAB FDA tool. ECG data is acquired from the Instrumentation amplifier designed in the Laboratory. For the interfacing of ECG amplifier to the computer advantech 711B add on card has been used. Results of the filter are compared with other filters also.
Key Words: Electrocardiogram, Real time processing, Chebyshev Filter, Noise reduction.
A
Figure 1: Basic ECG waveform showing PQRST points.
I. INTRODUCTION
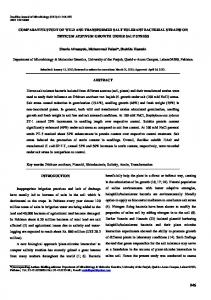
The ECG signal, even rest ECG, is often corrupted by artifacts produced by varies sources of either artificial or biological nature. Main artificial artifacts are power line interference, Impulse noise, Electrostatic potentials and noise of electronic devices. The main biological artifacts are motion artifacts and muscle artifacts (EMG signal) [1]. While designing the ECG amplifiers bandwidth requirements should be considered [2]. Figure 2 shows the schematic of biological and environmental interference sources [3]. Van Alste JA, van Eck W, Herrmann OE has proposed the linear filtering method for base line wonder reduction [4]. The time varying filtering is also proposed by Sornmo L. for the reduction of the baseline wonder [5]. De Pinto V., in his article describes two digital filters that were constructed and found effective in reducing
n Electrocardiogram (ECG) is the recording on the body surface of the electrical activity generated by the heart. ECG signal is a biological, multi-channel signal recorded from a system of electrodes of the ECG device. Manuscript received June 15, 2007: Revised version received Jan. 3, 2008. Mahesh S. Chavan, is with Department of Electronics and Telecommunication Engineering at Rajarambapu Institute of Technology, Rajaramnagar, India. (Phone: +91 2342 223762, +91 9970700782, Email:
[email protected]). R.A.Agarwala, Ex. Professor, National Institute of Technology, Kurukshetra, India. Now he is director, BBDIT Gaziabad (UP) India. (Phone: +91 9899401899, Email:
[email protected]). M.D. uplane, Professor, Department of Electronics, Shivaji University, Kolhapur India. (Phone:+91 9890902031, Email:
[email protected])
1
INTERNATIONAL JOURNAL of CIRCUITS, SYSTEMS and SIGNAL PROCESSING Issue 1, Volume 2, 2008
these two types of signal contamination. For the baseline wander filter presented is a linear phase high-pass filter having a cutoff frequency lower than the heart rate [6]. Alarcon G, Guy CN, Binnie CD has applied the recursive butterworth filter for reducing the noise contaminations [7]. Choy TT, Leung PM, has developed notch filter ECG signal since its analog version is difficult to design [8]. Gaydecki P. has described a simple but highly integrated digital signal processing system for real time filtering of biomedical signals. Filters are realized using a finite impulse response; no phase distortion is introduced into the processed signals [9]. McManus CD, Neubert K D, Cramer E, has compared filtering methods for elimination of AC noise in electrocardiograms[10]. Cramer E te.al has given global filtering approach in which two different filters are designed and are compared for power line estimation and removal in the ECG [11]. Electromyogram (EMG) artifacts often contaminate the electrocardiogram (ECG). They are more difficult to suppress or eliminate, compared for example to the power line interference, due to their random character and to the considerable overlapping of the frequency spectra of ECG. For filtering of electromyogram signal from the ECG signal Christov II, Daskalov IK has given the solution by designing Low pass digital filter of 35 Hz cutoff requency[12]. Figure 2 shows Schematic of Biological and environmental Interference Sources. Different Schemes for removing interference are also elaborated in the literatures [13], [14], [15].
II CHEBYSHEV FILTER This type of filters is named in honor of Pafnuty Chebyshev (Chebyshov, Tchebycheff or Tschebyscheff) a great russian mathematatician because their mathematical characteristics are derived from Chebyshev polynomials. Chebyshev filters, are analog or digital filters having a steeper roll-off and more passband ripple than Butterworth filters. Chebyshev filters have the property that they minimise the error between the idealised filter characteristic and the actual over the range of the filter, but with ripples in the passband. There are two types of the Chebyshev filter namely Chebyshev type I and Chebyshev Type II digital filter. A. Chebyshev Type I Filter: The Chebyshev low pass filter has a magnitude response given by H ( jΩ ) =
A
2 Ω 2 1 + ε C N Ωc
0 .5
Where A is the filter gain, ε is a constant and Ω c is the 3dB cutoff frequency. The Chebyshev polynomial of the first kind th
of N order, C N (x) is given by
C N ( x) = cos(N cos−1 x) , for x ≤ 1 C N ( x ) = cos( N cosh −1 x) , for x ≥ 1 The magnitude response has equiripple pass band and maximally flat stop band. It is seen that by increasing the filter order N, the Chebyshev response approximates the ideal response. B. The Chebyshev Type II Filter The Chebyshev type II filters are also called type Inverse Chebyshev filter. A low pass inverse Chebyshev filter has a magnitude response given by
H ( jΩ ) =
εC N (Ω 2 / Ω )
[1 + ε
2
C N (Ω 2 / Ω)
]
0. 5
Where ε is a constant and Ω c is the 3dB cut-off frequency. C N (x) is the Chebyshev polynomial. The magnitude response has a maximally flat pass band and equiripple stop band; just opposite to the Chebyshev type I filter response. That is why the type II Chebyshev filter are called inverse Chebyshev filter. Generally the low pass filter of the required specifications are designed and the converted into digital filter using either impulse invariance method or the bilinear transformation. Thereafter low pass section is converted into required high pass; band pass and band stop
Figure 2: Schematic of Biological and environmental Interference Sources.
2
INTERNATIONAL JOURNAL of CIRCUITS, SYSTEMS and SIGNAL PROCESSING Issue 1, Volume 2, 2008
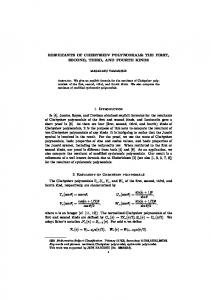
sections using frequency transformation. In the present paper all design is performed using Mathlab FDA tool. Figure 3 shows basic Mathlab model used in the filtration of the ECG using Chebyhsev type I and type II digital filter.
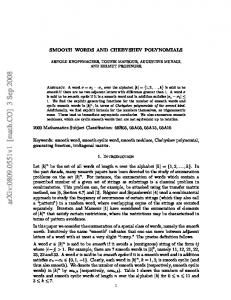
Figure 4: Magnitude responses of the Low pass Chebyshev I filter
Figure 3: Basic Matlab model used for the proposed work
C. Removal of High Frequency Noise Using Chebyshev I Low Pass Filter This section deals with design and implementation of the Chebyshev type I filter for the removal of the high frequency noise in the ECG trace. The useful information in the ECG trace lies with in the frequency range of 0.5Hz to 100Hz. Therefore above 100Hz, all the signals are referred as noise. This filter most commonly used frequency domain filter. Structure of the filter and corresponding numerator and denominator polynomials of the filter are also depicted. At the end results of before and after application of the Chebyshev I filter are elaborated.
Figure 5: Phase response of the Chebyshev I low pass filter.
D. Design Of Chebyshev I Low Pass Filter To design the Chebyshev I filter two parameters namely cutoff frequency and the order of the filter were defined. In the present case, order of the filter is 5 and the cutoff frequency is 100Hz. Figure 4 shows the magnitude response of the Chebyshev I low pass filter. From the magnitude response it is seen that the there are some ripple present in the pass band and then it gradually decreased in the stop band. Figure 5 shows the phase response of the Chebyshev I low pass filter and Figure 6 shows the groups delay of the Chebyshev I low pass filter. Figure 7 and Figure 8 shows the impulse response and the step response of the filter. Figure 9 shows the pole zero diagram of the Chebyshev I low pass filter.
Figure 6: Group delay of the Chebyshev I low pass filter
3
INTERNATIONAL JOURNAL of CIRCUITS, SYSTEMS and SIGNAL PROCESSING Issue 1, Volume 2, 2008
• • •
116Hz. therefore the magnitude response is equiripple in the pass band and monotonic in the stop band. The phase response of the filter has found some what nonlinear. Impulse response decays with respect to time. From the poles zero diagram it is seen that the all the pole are within the unit circles it show that the designed filter is stable.
E. Realization of Chebyshev I Low filter Figure 10 shows the realization of the Chebyshev type I low pass filter of the order of 5. The sampling frequency is 1000Hz. in the realized model 11 multiplier(s) are used. Realization requires 5 delay elements and the 10 adder elements. The numerator coefficients of the filter are: 0.0012, 0.0064, 0.128, 0.128, 0.0640, and 0.012. and for the designed filter the denominator coefficients are: 1.00, -2.9, 3.80, -2.54, 0.58, and -0.12.
Figure 7: Impulse response of the Chebyshev I low pass filter
Figure 8: Step response of the Chebyshev I low pass filter
Figure 10: realization of the Chebyshev I Low pass filter of the order 5.
Figure 9: Pole Zero diagram of the Chebyshev I low pass Filter.
From the design of the filter the following observations can be made: • From the response of the filter it is seen that the ripples in the pass band are 3 db and stop band frequency is of
F. Implementation of Chebyshev I Low Pass Filter To implement the Chebyshev I low pass filter in the real time manner to the ECG signal real time model has been
4
INTERNATIONAL JOURNAL of CIRCUITS, SYSTEMS and SIGNAL PROCESSING Issue 1, Volume 2, 2008
built. The model is shown in the Figure 11. The Time scope and Time scope 1 parameters are so chosen that it stores 5000 samples. The scope(s) also display the real time ECG signal before filtration and after filtration. The Same model has been used for the other type of filter also, only type of the filter has been changed.
Figure 14: Power Spectrum of Signal (Lead II) before Low pass filtering.
Figure 11: Real time model for the Chebyshev I low pass filtration of the ECG signal.
Figure 15: Power Spectrum of the Lead II Signal before Low pass filtering
G. Results of the Implementation of the Chebyhsev I Low Pass Filter
H. Removal Of Low Frequency Noise: Chebyshev I High Pass Filter Application
To use the Chebyshev I low pass filter on the ECG signal, the ECG trace of lead II and Lead III are used in present work. Figure 12 shows Lead II ECG trace containing Low frequency noise signal. Figure 13 shows Lead II ECG trace after Low pass filtering. Figure 14 Shows Power Spectrum of the Lead II Signal before Low pass filtering. Figure 15 shows Power Spectrum of the Lead II Signal after Low pass filtering.
Last section describes the design and implementation of the Chebyshev I low pass filter for the removal of the high frequency noise present in the ECG signal. In the present section design of the high pass filter and implementing to the ECG signal is described in details. To eliminate the baseline wander this high pass filter is used. I Design Of the Chebyshev I High Pass Filter To deal with low frequency noise high pass filter with cutoff frequency of 0.5 Hz and sampling frequency of 1000 Hz was designed. Figure 16 shows the magnitude response of the filter, Figure 17 and 18 shows the phase response and the group delay response of the filter. Similarly figure 19, 20 and 21 Shows the Impulse response, step response and the pole zero diagram of the filter.
Figure 12: Lead II ECG trace containing Low frequency noise signal.
Figure 13: Lead II ECG trace After Low pass filtering
Figure 16 Magnitude response of the High pass Chebyshev I filter.
5
INTERNATIONAL JOURNAL of CIRCUITS, SYSTEMS and SIGNAL PROCESSING Issue 1, Volume 2, 2008
Figure 17: Phase response of the Chebyshev I High pass filter.
Figure 20: Step response of the Chebyshev I High pass filter
Figure 18: Group delay of the Chebyshev I High pass filter
Figure 21: Pole Zero diagram of the Chebyshev High pass Filter.
From the design of the filter the following observations can be made: • When the Chebyshev type I filter is designed for the frequency of 0.5 Hz and order 3, the ripple in the pass band 2 dB it provides stop band frequency of 0.244 Hz. It gives ripples in the pass band. • The phase response is approximately linear. • Impulse response is one at time t= zero and for rest of time it is zero. • From the pole zero diagram it is seen that poles lies on the unit circle of the z plane. • The designed Chebyshev I filter is stable. J. Realization Of The Chebyshev I High Pass Filter Filter is realized with direct form II structure. It required three delay elements seven multipliers and six adder elements. Figure 22 shows the realization of the Chebyshev I digital filter.
Figure 19: Impulse response of the Chebyshev I High pass filter.
6
INTERNATIONAL JOURNAL of CIRCUITS, SYSTEMS and SIGNAL PROCESSING Issue 1, Volume 2, 2008
Figure 25: Frequency spectrum of the ECG signal before filtration.
Figure 26: Frequency spectrum of the ECG signal after filtration. Figure 23 shows the ECG trace before application of the Chebyshev I filter. This signal consist of high frequency component as well as low frequency components. It is cleared from the Figure 25. This figure shows the frequency spectrum of ECG trace before filtration. From the frequency spectrum it is seen that the power for the signals below 0.5Hz is varying from the 0dB to the -5dB. Figure 24 shows the ECG trace after application of the Chebyshev I high filter. Figure 26 shows the frequency spectrum of the ECG signal after application of the high pass filter. It is seen from the Figure 26 that for the frequency 0.5 Hz the power is reduced to the -27dB. It clearly indicates that the low frequency noise is reduced with the use of the filter. By observing the ECG traces before filtration and after filtration it is observed that PQRST complex does not retained, which is modified after use of the filter.
Figure 22: Realization of the Chebyshev type I high pass filter.
For the realized filter numerator coefficients are 0.99, -2.98, 2.98, 0.98 and the denominator coefficients are 1.0, -2.99, 2.98, -0.99. K. Results of the Implementation of the Chebyshev I High Pass Filter
L. Removal Of Power Line Interference: Chebyshev I Notch Filter Application. In the previous section the application of the Chebyshev I high pass filter has been used to the ECG signal for the removal of the base line wander. The other interference which generally corrupt the ECG trace is the power line interference. It causes the 50 Hz signal gets added to the ECG signal because of which it becomes very difficult to use it for the diagnostics in the heart disease. Present section deals with the design and implementation of the Chebyshev I notch filter to the ECG signal.
Figure 23: ECG trace (Lead II) before High pass filtration
M. Design of The Chebyshev I Notch Filter To remove the power line interference the Chebyshev I notch filter was designed. In the design the order of the filter was 4 and the sampling frequency of 1000Hz.
Figure 24: ECG trace after application of the Chebyshev I filter
7
INTERNATIONAL JOURNAL of CIRCUITS, SYSTEMS and SIGNAL PROCESSING Issue 1, Volume 2, 2008
Figure 27 shows the Magnitude response of the Chebyshev I notch filter. Figure 28 shows phase response of the Chebyshev I notch filter. Figure 29 shows Group delay of the Chebyshev I notch filter. Figure 30 shows impulse response of the Chebyshev I notch filter. Figure 31 shows step response of the Chebyshev I notch filter. Figure 32 shows the Pole Zero diagram of the Chebyshev I notch Filter. From the responses some observations are made: • Designed Chebyshev I filter is stable as seen from the pole zero diagram all the zeros are on the unit circle. The zeros are located at ± 0.314 radians. • Magnitude response shows the sharp cutoff at 50Hz the frequency. • Phase response shows the nonlinear behavior. Figure 30: Impulse response of the Chebyshev I notch filter.
Figure 27: Magnitude response of the Chebyshev I notch filter
Figure 31: Step response of the Chebyshev I notch filter.
Figure 28: Phase response of the Chebyshev I notch filter.
Figure 32: Pole Zero diagram of the Chebyshev I notch Filter.
N. Realization of the Chebyshev I notch filter Figure 33 Shows the realization of the Chebyshev I notch filter. This is the direct form II structure. This structure required nine multipliers, eight adders and four delay elements.
Figure 29: Group delay of the Chebyshev I notch filter.
8
INTERNATIONAL JOURNAL of CIRCUITS, SYSTEMS and SIGNAL PROCESSING Issue 1, Volume 2, 2008
Figure 36: Signal after Chebyshev I notch filtration.
Figure 37: power spectrum before Chebyshev I notch filtration.
Figure 33: Realization of the Chebyshev I notch filter for the frequency 50Hz.
For the notch filter the numerator coefficients of the filter are: 0.88, -3.36, 4.97, 3.36, and 0.88. The denominator coefficients are: 1.00, -3.79, 5.58, -3.76, and 0.98. O. Results of the implementation of the Chebyshev I notch filter
Figure 38: power spectrum after Chebyshev I notch filtration.
III DESIGN OF THE CHEBYSHEV TYPE II FILTERS
Figure 35 shows the ECG trace before notch filtration. This signal consists of the low frequency, high frequency and power line interference. Figure 36 shows the ECG signal after application of the Chebyshev I notch filter. Figure 37 shows frequency spectrum corresponds to the ECG signal before filtration. It is seen that the power of the signal corresponds to the 50 Hz is -30.93 dB. When it is passed trough the notch filter, the power reduced to -52dB. It is elaborated in the Figure 38. It clearly indicates that the power line interference signal has been reduced. It is seen that the amplitude of the signal has been reduced after filtration operation.
P. Removal of High Frequency Noise: Chebyshev II low pass filter Application In this section effort has been made to remove the high frequency noise from the ECG signal. As per the characteristic Chebyshev II filter, it has equiripple behavior in the stop band and monotonic behavior in the pass band. Complete design with its response and the implementation of the filter is depicted in this section. Q. Design of the Chebyshev II low pass filter The Chebyshev II low pass filter was designed with the following specifications. 1. Filter Order 0.5Hz. 2. Sampling frequency 1000Hz. 3. Cutoff frequency 100Hz. Figure 39 show the magnitude response of the Chebyshev II low pass filter. Figure 40 shows the Phase response of the Chebyshev II low pass filter. Group delay, impulse response and the step response of the filter are shown in Figure 41, Figure 42, and Figure 43 respectively. Figure 44 shows the pole zero diagram of the filter.
Figure 35: Signal before notch filtration.
9
INTERNATIONAL JOURNAL of CIRCUITS, SYSTEMS and SIGNAL PROCESSING Issue 1, Volume 2, 2008
From the design of the filter the following observations are made: • Magnitude response shows that there are ripples present in the stop band. It fives the monotonic behavior in the pass band. • Phase response is approximately linear in the pass band and nonlinear in the stop band. • The impulse response decays with respect to time. • From the poles zero diagram it is seen that the all the pole are with in the unit circles. It shows the filter under study is stable.
Figure 42: Impulse response of the Chebyshev II low pass filter
Figure 39: Magnitude response of the Low pass Chebyshev II filter. Figure 43: Step response of the Chebyshev II low pass filter
Figure 40: Phase response of the Chebyshev II low pass filter
Figure 44: Pole zero diagram of the Chebyshev II low pass filter
R. Realization of the Chebyshev II Low pass filter Figure 45 shows the realization of the Chebyshev Type II low pass filter. The direct form II structure has been used to realize the filter. From the filter structure it has been seen that the filter required 11 multipliers, five delay elements and ten adder blocks.
Figure 41: Group delay of the Chebyshev II low pass filter
10
INTERNATIONAL JOURNAL of CIRCUITS, SYSTEMS and SIGNAL PROCESSING Issue 1, Volume 2, 2008
Figure 47: ECG trace after Chebyshev II Low pass filtration
Figure 48: Frequency spectrum of the ECG signal before filtration
Figure 49: Frequency spectrum of the ECG signal after filtration.
Figure 45: Realization of Chebyshev II low pass filter.
For the designed filter numerator coefficients of the transfer function are: 0.0001, -0.0002, .0001, 0.0001, -0.0002, 0.0001 and Also the denominator coefficients are: 1.00, -4.425, 7.863, -7.01, 3.13, -0.56
Frequency spectrum of signal before filtration has exhibits 52dB signal power at frequency of 100Hz and the average power of the signal frequencies higher than the 100Hz is -79 dB. When the filter is applied it removes high frequency noise and power is dropped to the -93.47 dB. It clears indicates that the higher frequency signal are removed.
S. Results of the implementation of the Chebyshev II Low pass filter
T. .Removal of Low Frequency Noise: Chebyshev II High Pass Filter Application
Figure 46 shows ECG trace before Low pass filtration. Figure 47 shows ECG trace after Low pass filtration. The corresponding frequency spectrum are shown in the Figure 48 and Figure 49 respectively.
Last section deals with filtration of high frequency noise from with the help of Chebyshev II low pass filter. This section shows the results of application of the Chebyshev II high pass filter for the removal of the base line wander. U. Design of the Chebyshev II High pass filte: Chebyshev II high pass filter is designed for the order 3 and the attenuation in the stop band 60dB. The sampling frequency was 1000Hz. Figure 50 Shows magnitude and Figure 51 shows Phase response of the Chebyshev II high filter. Figure 52 and Figure 53 shows Group delay and impulse response of the Chebyshev II high filter. Figure 54 Shows Impulse response of the Chebyshev II high filter and step response is shown in figure 55. Pole zero diagram of the Chebyshev II high pass filter is shown in figure 56.
Figure 46: ECG trace before Chebyshev II Low pass filtration
11
INTERNATIONAL JOURNAL of CIRCUITS, SYSTEMS and SIGNAL PROCESSING Issue 1, Volume 2, 2008
From the responses following observations can be made: • Magnitude response is monotonic in the pass band. This design gives sharp cutoff at the 0.5 Hz. The stop band is characterized by the presence of ripples, each having the same amplitude. This is the converse of what was observed in the case of the Chebyshev I filter. • The phase response is approximately linear for lower pass band frequencies and has value less than zero, indicating lag phase. • Step response is satisfactory as per the requirement. • From the impulse response which decays with time, it clears that the designed filter is stable. • Pole zero diagram clearly shows that poles and zeros are with in the circle so that the designed filter is stable. Figure 53: Impulse response of the Chebyshev II high filter
Figure 50: magnitude response of the Chebyshev II high filter
Figure 54: Step response of the Chebyshev II high filter
Figure 51: Phase response of the Chebyshev II high filter
Figure 55: Pole zero diagram of the Chebyshev II high filter
V. Realization of the Chebyshev II High pass filter Figure 56 shows the realization of the Chebyshev II high pass filter. The realized structure is direct form II it uses six adder elements, three delay elements and seven multiplier elements.
Figure 52: Group delay response of the Chebyshev II high filter
12
INTERNATIONAL JOURNAL of CIRCUITS, SYSTEMS and SIGNAL PROCESSING Issue 1, Volume 2, 2008
Figure 59: Frequency spectrum of the ECG Signal before filtration (Chebyshev II)
Figure 56: realization of the Chebyshev II high pass filter with order 3.
Figure 60: Frequency spectrum of the ECG Signal after filtration (Chebyshev II)
For the designed filter the numerator coefficients are 0.95, -2.87, 2.87, -0.95. And the denominator coefficients are: 1.0, -2.91, 2.83, -0.97.
From the ECG trace and the frequency spectrum of the unfiltered ECG signal it is seen that ECG contains the variation in the base line. This is called as the baseline wonder. Before filtration the signal power varies from -5 dB to the -12dB. When the Chebyshev II high pass filter is used, it is seen that the power is reduced to the -25dB to -0.18dB. It clearly indicates that the low frequency signals are removed.
W. Results Of The Implementation Of The Chebyshev II High Pass Filter. Figure 57 shows ECG trace before filtration (Chebyshev II) and Figure 58 shows ECG trace after filtration (Chebyshev II), Figure 59 and figure 60 shows frequency spectrum of ECG signal before and after filtration.
X. Removal Of Power Line Interference: Chebyshev II Notch Filter Application Last section describes the Chebyshev II filter was applied for dealing with the base line wonder. This section deals with application of the Chebyshev II notch filter for reduction of power line interference. Y. Design of the Chebyshev II notch filter The Chebyshev II notch filter was designed for order 4 and the sampling frequency of 1000Hz. The order 4 was chosen by considering the stability factor of the filter. Figure 61 shows the Magnitude response and figure 62 shows phase response of the Chebyshev II notch filter. Figure 63 shows Group delay and figure 64 shows impulse response and figure 65 shows step response of the Chebyshev II notch filter. The Pole Zero diagram of the Filter is shown in figure 66. Following observations can be made from the design of the filter: • The pass band is the flat. • The stop band is characterized by the presence of ripples, each having the same amplitude. This is the converse of what was observed in the case of the Chebyshev I filter. • Phase response is non linear.
Figure 57: ECG trace before High pass filtration (Chebyshev II)
Figure 58: ECG trace after High pass filtration (Chebyshev II)
13
INTERNATIONAL JOURNAL of CIRCUITS, SYSTEMS and SIGNAL PROCESSING Issue 1, Volume 2, 2008
•
• •
From the impulse response which decays with time, it is infer that the designed filter is stable. This is affirmed by the pole-zero diagram in which all the poles reside within the unit circle. The pole zero diagram also contains 4 zeros which reside on the unit circle. As the order of the filter increased above 12 the filter becomes unstable so that the optimal order selected is 4. The zeros are located at ± 0.314 radians.
Figure 64: Impulse response of the Chebyshev II notch filter.
Figure 61: Magnitude response of the Chebyshev II notch filter
Figure 65: Step response of Chebyshev II notch Filter
Figure 62: Phase response of the Chebyshev II notch filter.
Figure 66: Pole Zero Diagram of Chebyshev II Notch Filter Figure 63: Group delay of the Chebyshev II notch filter.
14
INTERNATIONAL JOURNAL of CIRCUITS, SYSTEMS and SIGNAL PROCESSING Issue 1, Volume 2, 2008
Z. Realization of the Chebyshev II notch filter Figure 67 shows the realization of the Chebyshev II notch filter for the order of 4. It is direct form II structure and it required nine multipliers, eight adders and four delay elements.
Figure 68: Signal before Chebyshev II notch filtration.
Figure 69: Signal after Chebyshev II notch filtration.
Figure 70: power spectrum before Chebyshev II notch filtration.
Figure 67: Realization of the Chebyshev II Notch filter.
The numerator coefficients for the designed filter are: 0.54, -2.08, 3.07, -2.08, 0.54 and the denominator coefficients are 1.0, -2.73, 2.86, 01.424, and 0.311. Z. Results of the implementation of the Chebyshev I notch filter:
Figure 71: power spectrum after Chebyshev II notch filtration.
IV. CONCLUSION: From the result it is seen that both the filters reduces the low and high frequency. The power line noise is also reduced. It is seen tip of the QRS complex is distorted. The outputs of the Chebyshev II filter shows that after using filter there is distortion in the ST part of the waveform. Both the filters work Satisfactory. Table 1 shows the comparision of the chebyshev I and Chebyshev II filter for reduction of baseline noise power line intereference and high frequency noise.
Figure 68 shows the ECG trace before application of filter. This signal consists of the low frequency, high frequency and power line interference. Figure 69 shows the ECG signal after application of the Chebyshev II notch filter. Figure 70 shows frequency spectrum corresponds to the ECG signal before filtration it is seen that the power of the signal corresponds to the 50 Hz is -56dB. When it is passed trough the notch filter its power is reduced to the -60dB. Form the figure 71 it is observed that power line interference is reduced.
15
INTERNATIONAL JOURNAL of CIRCUITS, SYSTEMS and SIGNAL PROCESSING Issue 1, Volume 2, 2008
Table 1: Comparison of low pass filters for removing high frequency noise. Type of Filter
Filter Order
Signal power before Filtration (dB) -38 -50 -79 -56
Signal Power After Filtration (dB) -56 -75 -93.47 -79
Butterworth Chebyshev I Chebyshev II Elliptic
5 5 5 5
Type of Filter
Filter Order
Signal power before Filtration
Signal Power After Filtration
Butterworth
4
-10
-27
Chebyshev I Chebyshev II Elliptic
4 4 4
-30.93 -56 59.71
-52 -60 -64.89
Effect on PQRST waveform Modified Modified modified Less modified Effect on PQRST waveform Not Modified Not Modified Modified Less Modified
Table 2: Comparison of different IIR Filters for removal of baseline wander in ECG. From the table 2 it is seen that when different filters were used the signal power after filtration is reduced. However, PQRST complex modified by Butterworth, Chebyshev I and Chebyshev II filter. The elliptic filter exhibits less modification in the PQRST complex. So it is found suitable as low pass filter. Number of times the ECG signal is disturb due to the low frequency noise also, which is less than the 0.5 Hz. This type of the noise creates the variation in the base line, which is called as base line wander. To remove the base line wander it is required to use the high pass filter of the cutoff frequency of 0.5 Hz. Different high pass filter were designed with sampling frequency of 1000Hz. When Butterworth filter of the cutoff frequency 0.5 Hz used to filter ECG, it is seen that the QRST segment of the ECG signal is modified. It is seen that the power of the signal below 0.5 Hz was dropped. Similarly different filters were used to remove the low frequency noise from the ECG signal. The results were recorded and tabulated in table 4.3. From the table it is seen that signal power is reduced from – 8dB to –25dB after filtering the ECG signal by these filters. The Butterworth, Chebyshev I and Chebyshev II filters modify the PQRST segment of the ECG signal. However the PQRST complex of the ECG signal is slightly modified by the elliptic filter while removing the baseline wander from the ECG.
Power line interference is also a measure cause of the disturbances in that ECG signal. To deal with the power line interference different IIR filters were designed. These filters are Butterworth notch filter, Chebyshev I, Chebyshev II and Elliptic notch filter. These filters were designed for the cutoff frequency of 50Hz and sampling frequency of 1000Hz. When Butterworth filter was applied to ECG signal containing power line interference, from the frequency spectrum of the before filtration it is seen that the signal power at 50 Hz is -27dB. After filtration power is reduced from –27dB to –100dB. Similar results were observed when Chebyshev I, Chebyshev II and elliptic filters were used to filter the powerline interference from the ECG signal. However, reduction in the power after filtering is very small as compared to the Butterworth filters. These results were depicted in table 4.4. Table shows that while filtering the powerline interference the PQRST segment of the ECG signal is retained by the Butterworth and Chebyshev I filter. However, this complex is modified by Chebyshev II filter. At the same time elliptic filter modifies PQRST segment slightly which indicates that elliptic filter is suitable for removing the power line interference. Table 3 shows Comparison of different IIR Filters for removal of Power line Interference.
Table 3: Comparison of different IIR Filters for removal of Power line Interference Type of Filter
Filter Order
Butterworth Chebyshev I Chebyshev II Elliptic
3 3 3 5
Signal power before Filtration -20 -2.5 -12 -18
16
Signal Power After Filtration -28 -27 -25 -25
Effect on PQRST waveform Modified Modified Modified Less Modified
INTERNATIONAL JOURNAL of CIRCUITS, SYSTEMS and SIGNAL PROCESSING Issue 1, Volume 2, 2008
REFERENCES
[9] Gaydecki P, “A real time programmable digital filter for biomedical signal enhancement incorporating a high-level design interface”, Physiol. Meas. 2000 Feb; 21(1):187-96. [10] McManus CD, Neubert KD, Cramer E, “Characterization and elimination of AC noise in electrocardiograms: a comparison of digital filtering methods”, Comput Biomed Res. 1993 Feb;26(1):48-67. [11] Cramer E, McManus CD, Neubert D, “Estimation and removal of power line interference in the electrocardiogram: a comparison of digital approaches”, Comput Biomed Res. 1987 Feb;20(1):12-28. [11] Christov II, Daskalov IK, “Filtering of electromyogram artifacts from the electrocardiogram,” Med. Eng. Phys. 1999Dec; 21(10):731-6. [12] Mahesh S. Chavan, R.A. Agarwala, M.D. Uplane, “ digital Elliptic filter application for noise reduction in ECG signal”, WSEAS transactions on Electronics, January 2006, Volume 3, Issue 1, pp 65-70. [13] Mahesh S. Chavan, R.A. Agarwala, M.D. Uplane,”Application of Chebyshev II digital filter for noise reduction in ECG Signal”, WSEAS transactions on Circuits and Systems, October 2005, Volume 4, Issue 10, pp 1260-1267. [14] Mahesh S. Chavan, R.A. Agarwala, M.D. Uplane, , “ Real Time application of Digital Chebyshev I Filter for removal of interference in the Electrocardiogram Signal”, WSEAS transactions on Biology and Biomedicine, July 2005, Volume 2, Issue 3, pp 280-289.
[1] Tompkins, W.J., Biomedical Digital Signal Processing, Prentice Hall, Inc., 1993. [2] Carr, J.J. and J.M. Brown, Introduction to Biomedical Equipment Technology. Prentice Hall, Inc., 3rd ed., 1998. [3] John G. Webster, Encyclopedia of Medical Devices and Instrumentation. Vol. 2. [4] Van Alste JA, van Eck W, Herrmann OE, “ECG baseline wander reduction using linear phase filters”, Comput. Biomed Res. 1986 Oct; 19(5):417-27. [5] Sornmo L, “Time-varying digital filtering of ECG baseline wander”, Med Biol. Eng Comput. 1993 Sep; 31(5):503-8. [6] De Pinto V,“Filters for the reduction of baseline wander and muscle artifact in the ECG”, J Electrocardiol. 1992; 25 Suppl: 40-8. [7] Alarcon G, Guy CN, Binnie CD, “A simple algorithm for a digital threepole Butterworth filter of arbitrary cut-off frequency: application to digital electroencephalography”, J Neurosci Methods. 2000 Dec 15; 104(1):35-44. [8] Choy TT, Leung PM, “Real time microprocessor-based 50 Hz notch filter for ECG”, J Biomed Eng. 1988 May;10(3):285-8.
17