Vol. 130 (2016)
ACTA PHYSICA POLONICA A
No. 4
Proceedings of the XXIII Conference on Applied Crystallography, Krynica Zdrój, Poland, September 20–24, 2015
Comparative Study of Sb2O3 (Sb2O5) and Ta2O5 Doping Effects with TeO2 on Electrical Properties of δ-Bi2O3 L. Loubbidia,∗ , A. Chagraouia , S. Villainb , L. Bourjaa , B. Orayechc , O. Ait Sidi Ahmeda , A. Moussaouia , A. Tairia a
Laboratoire de Chimie Analytique et Physico-Chimie des Matériaux (LCAPM), Faculté des Sciences Ben M’Sik, Université Hassan II, Casablanca, Maroc b Avenue de l’Université Toulon Var B.P. 20132, Laboratoire IM2NP, Bâtiment R83957, La garde CEDEX, Toulon, France c CIC Energigune, Parque Tecnológico, C/Albert Einstein, 48, 01510 Miñano (Álava), Spain In this study, Sb2 O3 (Sb2 O5 ) and Ta2 O5 are used as co-dopants with TeO2 to stabilize the delta phase of bismuth oxide (δ-Bi2 O3 ). Some compositions with formula (1 − x) BiO1.5 -(x/4) Sb2 Te2 O9 and (1 − x) BiO1.5 -(x/4) Ta2 Te2 O9 (x = 0.1, 0.2, 0.3, 0.6, and 0.9) have been synthesized by solid state reaction at 850 ◦C and characterized by powder X-ray diffraction. The Bi0.9 Sb0.05 Te0.05 O1.575 , Bi0.9 Ta0.05 Te0.05 O1.575 and Bi0.8 Ta0.1 Te0.1 O1.65 retain a cubic fluorite structure of δ-Bi2 O3 phase. The electric properties were studied by impedance spectroscopy. All samples were evaluated by calculating conductivities and activation energies. Various impedance model including constant phase element and the Warburg impedances have been used to interpret the Nyquist representations of electrical analyses. DOI: 10.12693/APhysPolA.130.862 PACS/topics: 81.05.Je, 82.47.Ed
1. Introduction Fluorite based materials with the type fcc structure (Fm¯ 3m) have been considered as potential materials for solid oxide fuel cell electrolyte. The delta phase of bismuth oxide, δ-Bi2 O3 has high conductivity due to high mobile oxygen vacancies in random distribution. The high oxygen mobility is attributed to the weak Bi– O bond and the high polarizability of Bi3+ with its lone pair 6s2 electrons [1]. It has a conductivity of 1 S cm−1 at 750 ◦C [2]. Therefore, this oxide has been explored for various potential applications in gas sensors [3], photovoltaic cells [4], supercapacitors [5] and photocatalysts [6]. Furthermore, it is an extremely promising solid electrolyte material and can be used as solid oxide fuel cells and oxygen sensors. However, it is stable only between 730 ◦C and its melting point of 825 ◦C. Therefore, it cannot be preserved at room temperature. By using doping method with some rare earth [7, 8] and transition metal (V, Nb, Ta and W) oxides [9, 10], the fluorite type can be preserved to ambient temperature. It is also possible to use combination of metal oxide, so-called double doping strategy. Examples include the ternary systems Bi2 O3 –Er2 O3 –WO3 [11], Bi2 O3 – Er2 O3 –PbO [12], Bi2 O3 –Er2 O3 –Nb2 O5 [13]. Mercurio et al. [14] investigated Bi2 O3 –Ln2 O3 –TeO2 (Ln = La, Sm, Gd, and Er) ternary system and announced that (Bi2 O3 )0.90 (La2 O3 )0.06 (TeO2 )0.04 had a higher ionic conductivity, of 5×10⁻³ S cm−1 at 350 ◦C. We have recently
∗ corresponding
author; e-mail:
[email protected]
reported the study of electrical properties of Bi2 O3 based on the fluorite type phase in the Bi2 O3 –TeO2 –Nb2 O5 system. The dopants have been chosen in accordance with several factors. The oxides TeO2 and Sb2 O3 (Sb2 O5 ) were selected because Te4+ and Sb3+ present a lone pair of electrons stereochemically active and promotes a very high polarizability like Bi3+ . Concerning Ta2 O5 , it has been introduced (5–10 mol.% Ta2 O5 ) into Bi2 O3 to stabilize δ phase [15]. The composition synthesized with 7.5 mol.% Ta2 O5 exhibits satisfying electrical results with a conductivity of 0.31 (or 10−0.5 ) S cm−1 at 650 ◦C. Also, the Sb2 O3 and Ta2 O5 enlarged the stability domain of the δ-Bi2 O3 phase [16]. This has encouraged us to use Ta2 O5 and Sb2 O3 (Sb2 O5 ) with TeO2 in the present study as dopants, with the aim to isolate Bi2 O3 δ-phase with best value of conductivity. The present research investigates the influence of selected ions (Ta5+ , Sb3+ /Sb5+ and Te4+ ), introduced as dopant in α-Bi2 O3 and its effect on the structure and electrical conductivity. 2. Experimental The method of solid-state chemical reaction was applied to synthesize the compositions of the type δ-Bi2 O3 using the appropriate quantities of high purity oxides powder α-Bi2 O3 (99.99%), α-TeO2 (99.99%), Sb2 O3 (99.99%) and Ta2 O5 (99.99%). The starting compounds were mixed in an agate mortar and then heated at successively higher temperatures (700, 800, and 850 ◦C for 24 h). After each heating treatment, the sample was cooled down to room temperature and re-ground to improve homogeneity.
(862)
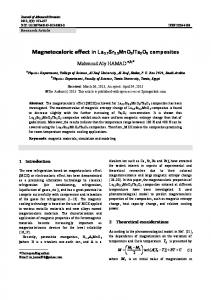
Comparative Study of Sb2 O3 (Sb2 O5 ). . . The electrical study was performed using an electrical impedance spectrometer SOLARTRON SI 1260 coupled to an electrical cell operating under air and in the temperature range from 200 ◦C to 700 ◦C. The samples were cylindrical pellets (diameter 12.8 ± 0.1 mm, thickness 3 ± 0.05 mm) initially compacted at 5 kbar under ambient conditions. The pellets were placed between two cylindrical platinum electrodes in a specific cell. A constant pressure was applied to the electrodes via rings. The cell was placed in a furnace operating at up to 700 ◦C. The electrical analyses were carried out in the frequency range (ω = 2πν)10−3 to 106 , with an alternating current associated with a maximum voltage of 0.1 V. Samples were stabilized for 15 min at a fixed temperature. The recording time for the frequency range was 15 min. To ensure thermal stabilization of pellets, all compositions were subjected to two successive measuring cycles (with one temperature rise and drop for two cycles). The final impedance data were measured during heating mode of the second cycle. The impedances Z = Z 0 + jZ 00 (Z 0 and Z 00 being respectively the real and imaginary components) were represented using Nyquist plots (X = Z 0 , Y = −Z 00 ). The software Zview [17] was used to fit the impedance of specific electrical circuit to the Nyquist experimental data (the Nyquist representations). The equivalent circuits associated with the all samples were generally based of parallel RC circuit. 3. Results and discussion 3.1. Structural characterization The results of XRD analyses show that all of ours samples are formed with a fluorite fcc structure. The Xray diffraction spectra of the compositions are shown in Fig. 1.
Fig. 1. Powder diffraction pattern Bi0.9 Sb0.05 Te0.05 O1.575 Bi0.9 Ta0.05 Te0.05 O1.575 Bi0.8 Ta0.1 Te0.1 O1.65 .
of and
The pattern refinement of the synthesized phases was carried out by means of the Rietveld method using the FULLPROF program [18]. The factors of reliability are Rf = 0.91%, 2.34% and 2.54%, RBragg =
863
1.25%, 2.88% and 2.15% for Bi0.9 Sb0.05 Te0.05 O1.575 , Bi0.9 Ta0.05 Te0.05 O1.575 and Bi0.8 Ta0.1 Te0.1 O1.65 , respectively. All the experimental details and crystallographic data are summarized in Table I. The Rietveld refinements of X-ray powder diffraction data indicate that the cations Bi, (Ta or Sb), and Te are localized in (4a). The oxygen occupied the sites 8c and 32f, respectively [19]. TABLE I Experimental details and crystallographic data of synthesized phases. Space group F m¯ 3m Bi0.9 Sb0.05 Te0.05 O1.575 5.523(4) a [Å] Bi0.9 Ta0.05 Te0.05 O1.575 5.485(4) Bi0.8 Ta0.1 Te0.1 O1.65 5.523(6) Wavelength [Å] 1.5406–1.54426 Angular range [◦ ] 20 < 2θ < 90 0.01 Step of measurement [◦ /min] Integration time [s] 100
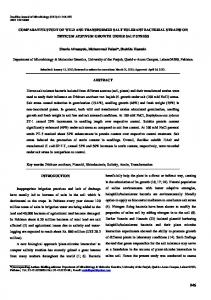
3.2. Electrical impedance spectroscopy The evolution of the conductivity was followed at different temperatures. The shapes of the curves are variable according to the composition of each material; it depends in particular on the grain size according on the compound. We present as an example the Nyquist plots for Bi0.9 Ta0.05 Te0.05 O1.575 and Bi0.9 Sb0.05 Te0.05 O1.575 at T = 300 ◦C (Fig. 2).
Fig. 2. Nyquist plot obtained at 300 ◦C for Bi0.9 Ta0.05 Te0.05 O1.575 and Bi0.9 Sb0.05 Te0.05 O1.575 .
For Bi0.9 Sb0.05 Te0.05 O1.575 , the Nyquist plot is constituted by two Nyquists circles; the first one is associated with grain core conduction while the second one is associated with grain boundary. The Nyquist diagram for Bi0.9 Ta0.05 Te0.05 O1.575 presents a broad and flattened semicircle which is associated with grain-core conduction.
864
L. Loubbidi et al.
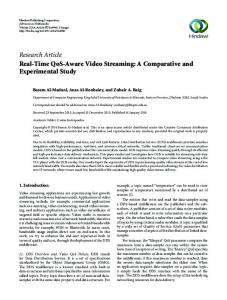
At high temperature (from 640 ◦C), we noticed the same behavior for both compositions. The Nyquist plot is formed by a vertical line which is observed within the range of high frequencies corresponding to negative values of Z 00 and a semicircle which is very flattened in the zone of lower frequencies. We have the presence of Warburg signal corresponding to ionic diffusion at the electrode interfaces (Fig. 3).
Fig. 3.
The electrical conductivity was determined to be 2.26×10⁻⁴ S cm−1 and 3.06×10⁻⁴ S cm−1 at 700 ◦C for Bi0.9 Sb0.05 Te0.05 O1.575 and Bi0.9 Ta0.05 Te0.05 O1.575 , respectively. The conductivity follows the Arrhenius law [20, 21]: σ = σ0 exp(−Ea /RT ), where σ0 , R and Ea denote the pre-exponential factor, the Boltzmann constant R = 8.314 J K−1 mol−1 and the activation energy, respectively. The activation energy values (Ea ) of the oxygen ion mobility were determined experimentally according to the equation and were calculated from the Arrhenius plots. It is 0.51 eV and 0.48 eV for Bi0.9 Sb0.05 Te0.05 O1.575 and Bi0.9 Ta0.05 Te0.05 O1.575 , respectively (Fig. 5). This weak value that the samples exhibit in conductivity at the same concentration of dopants (5%) is surprising. This phenomenon could be explained by the nature of dopants. The cations Sb3+ , Te4+ and Bi3+ occupied the same site and all of them possess a lone pair of electrons forming probably a sphere as a screen that prevents the mobility of oxygens and influences negatively on the electrical conductivity.
Nyquist plot obtained at high temperature.
The modeling of the experimental results was performed using the Zview software [17]. For each composition and each temperature, several types of equivalent circuits have been proposed and tested. We have kept the models that agree more with the experimental results for each sample. Figure 4 allows comparing the experimental results with simulation results obtained from the equivalent circuits used at different temperatures and for both studied compositions (Bi0.9 Ta0.05 Te0.05 O1.575 and Bi0.9 Sb0.05 Te0.05 O1.575 ).
Fig. 5. Arrhenius plots for (a) Bi0.9 Sb0.05 Te0.05 O1.575 and (b) Bi0.9 Ta0.05 Te0.05 O1.575 .
4. Conclusion
Fig. 4. Comparison between experimental results and obtained models for (a) Bi0.9 Sb0.05 Te0.05 O1.575 at 340 ◦C and Bi0.9 Ta0.05 Te0.05 O1.575 (b) at 700 ◦C.
The electrical conductivity σ (S cm−1 ) can be expressed by the formula: 1 t σ= , RS where R (Ω) is the electrical resistance, t/S is the geometrical factor of the pellet including the thickness t (cm) and the area S (cm2 ).
The investigation of Bi2 O3 –Ta2 O5 –TeO2 and Bi2 O3 – Sb2 O3 (Sb2 O5 )–TeO2 ternary systems enabled us to stabilize the delta phase of Bi2 O3 at room temperature by introducing Sb2 O3 (Sb2 O5 ) and TeO2 then Ta2 O5 and TeO2 into α-Bi2 O3 with formulae (1 − x)BiO1.5 -(x/4)Sb2 Te2 O9 (x = 0.1) and (1 − x)BiO1.5 (x/4)Ta2 Te2 O9 (x = 0.1, 0.2), respectively. As clarified previously, the property of lone pair contained in selected cations as well as their localization in the same site (4a) are probably the major factors that lead to obtain the unsatisfying values of conductivity. References [1] E.D. Wachsman, S. Boyapati, N. Jiang, Ionics 7, 1 (2001). [2] H.A. Harwig, Z. Anorg. Allg. Chem. 444, 151 (1978). [3] A. Cabot, A. Marsal, J. Arbiol, J.R. Morante, Sens. Actuat. B Chem. 99, 74 (2004).
Comparative Study of Sb2 O3 (Sb2 O5 ). . . [4] K. Sardar, T. Fang, T.W. Yang, J. Am. Ceram. Soc. 90, 4033 (2007). [5] T.P. Gujar, V.R. Shinde, C.D. Lokhande, S.H. Han, J. Power Sources 161, 1479 (2006). [6] L. Zhou, W. Wang, H. Xu, S. Sun, M. Shang, Chem. Eur. J. 15, 1776 (2009). [7] R. Punn, A.M. Feteira, D.C. Sinclair, C. Greaves, J. Am. Chem. Soc. 128, 15386 (2006). [8] M. Drache, P. Roussel, J.P. Wignacourt, Chem. Rev. 107, 80 (2007). [9] T. Takahashi, H. Iwahara, J. Appl. Electrochem. 3, 65 (1973). [10] T. Takahashi, H. Iwahara, T. Esaka, J. Electrochem. Soc. 124, 1563 (1977). [11] A. Watanabe, M. Sekita, Solid State Ion. 176, 2429 (2005). [12] N.A.S. Webster, C.D. Ling, C.L. Raston, F.J. Lincoln, Solid State Ion. 178, 1451 (2007). [13] Tung Chou, Li-Der Liu, Wen-Cheng J. Wei, J. Eur. Ceram. Soc. 31, 3087 (2011).
865
[14] D. Mercurio, M. El Farissi, B. Frit, Solid State Ion. 39, 297 (1990). [15] S.E. Lin, W.C.J. Wei, J. Eur. Ceram. Soc. 31, 3081 (2011). [16] V. Fruth, A. Ianculescu, D. Berger, S. Preda, G. Voicu, E. Tenea, M. Popa, J. Eur. Ceram. Soc. 26, 3011 (2006). [17] D. Johnson, Zview, Impedance software, Version 2.1a, Scribner Associates Inc., 1990. [18] FullProf.2k, Version 5.30, Mar 2012-ILL JRC. [19] L. Loubbidi, M. Naji, B. Orayech, A. Chagraoui, J.M. Igartua, A. Moussaoui, A. Tairi, Orient. J. Chem. 32, 47 (2016). [20] M. Mogensen, N.M. Sammes, G.A. Tompsett, J. Solid State Ion. 129, 63 (2000). [21] T. Suzuki, I. Kosacki, H.U. Anderson, J. Solid State Ion. 151, 111 (2002).