optical absorption ascribed to deep localized defect states. ...... thin film was tested with X-Ray diffraction and it was found to be a polycrystalline [35]. In [2014] ...
Suez University Faculty of Science Physics Department
Comparative Study on Structural and some Physical Properties of ZnO Thin Films Prepared by Pulsed Laser Deposition (PLD) Thesis Submitted By
Mohamed Abd El-Rahim Ali Abd El-Baky B. Sc. of Physics Faculty of Science – Cairo University (2009)
In partial Fulfillment of the Requirements for the Master Degree of Science in Physics
(Physics of Optics and Spectroscopy)
2014
Suez University Faculty of Science Physics Department
Supervision Title of study: Comparative Study on Structural and some Physical Properties of ZnO Thin Films Prepared by Pulsed Laser Deposition (PLD) Researcher name: Mohamed Abd El-Rahim Ali Abd El-Baky Supervised by: 1- Prof. Mohamed Mahmoud El-Desoky
Signature .…………...
Department of Physics - Faculty of Science - Suez University
2- Dr. Hisham Imam Mahmoud
….………...
National Institute of Laser Enhanced Science - Cairo University
3- Dr. Gamal El-Sayed Afifi
..................
National Institute of Laser Enhanced Science - Cairo University
Suez University Faculty of Science Physics Department
Referees Decision Title of study: Comparative Study on Structural and some Physical Properties of ZnO Thin Films Prepared by Pulsed Laser Deposition (PLD) Researcher name: Mohamed Abd El-Rahim Ali Abd El-Baky Refereed by:
Signature
1- Prof. Mohamed Yousry Hassaan
……………
Professor of Physics - Faculty of Science - Al azhar University
2- Prof. Mohamed Mahmoud El-Desoky
……………
Professor of Physics - Faculty of Science -Suez University
3- Prof. Faread Mahmoud Kamel Tantawy
……………
Professor of Physics - Faculty of Science – Suez Canal University
Acknowledgments I would like to acknowledge sincerely my supervisor Prof. Mohamed Mahmoud El-Desoky for his kindness, enlightening ideas, excellent explanations and patient guidance throughout my study. I would also like to express my sincere gratitude to Dr Hisham Imam and Dr Gamal El-Sayed for their technical support during the preparation of ZnO thin films using PLD system. Special thanks to Dr Hassan Mohamed and Mr Mohamed saad for their technical support during the preparation of ZnO nanoparticles. Many thanks are given to all staff in faculty of science – Suez University and specially to my department of physics for their help and support during my master studies. Finally, I would like to thank my family and friends for the valuable help and endless encouragement.
Abstract ZnO thin films were deposited on glass substrate at room temperature (RT) by using pulsed laser deposition (PLD) such that the target was ZnO nanoparticles prepared by microwave method. The fabricated ZnO thin films and ZnO nanoparticles were annealed for 2h at 300, 350, 400, 450 and 500 oC in air. The effects of annealing temperatures on the structural, optical and electrical properties of annealed ZnO thin films and ZnO nanoparticles were investigated by XRD, FTIR spectra, transmission electron microscope (TEM), scanning electron microscope (SEM), transmittance spectra, photoluminescence (PL), dc conductivity and ac conductivity. The XRD of the annealed films and nanoparticles reveal the presence of polycrystalline ZnO with hexagonal wurtzite structure. Using Scherrer equation, the average grain size of annealed films and nanoparticles were found to be 5.22–10.61nm and 25.7–36.4 nm, respectively. The presence of ZnO thin films and nanoparticles is confirmed from the FTIR spectra and the values of optical phonon frequency (υo) were found to be 1.26-1.58 x 10¹³ Hz and 1.26 - 1.3 x 10¹³ Hz, respectively. The TEM image of annealed ZnO thin film at 4000C shows ZnO nanobelts with average grain diameter 12nm but the TEM image of annealed nanoparticles at 4000C shows ZnO nanorods with average grain diameter 39nm and grain length 388nm. The SEM image of annealed ZnO thin film at 4000C shows rough surface and the crystalline grains in the spherical shape. On the other hand, The SEM image of annealed ZnO nanoparticles at 4000C shows a large quantity of flower-shaped structures. From the UV-Vis spectra, the optical band gap energy of ZnO thin films is found to be in the range 2.95-3.32 eV but the vacancy energy level of ZnO nanoparticles was found to be 2.25 - 2.37 eV. The PL spectra of ZnO thin films shows strong UV, violet, blue and green emissions however, the PL spectra of ZnO nanoparticles shows that all
the samples emits strong UV and very weak violet, blue and green emissions. The electrical conductivity shows that all samples are semiconductor. The calculated activation energy for the films was found to be 0.093-0.168 eV. On the other hand, the activation energy for the nanoparticles was found to be 0.35-0.791 eV. The ac conductivity studies of ZnO nanoparticles reveal that the ac conductivity increased with the annealing temperature because the average grain size and oxygen vacancies increased with the annealing temperature while these parameters improve with the increasing of temperature. The increase of ac conductivity with the temperature indicates that the mobility of charge carriers is increased. The annealed ZnO thin film at 4000C for 2h is the best film to be use it as transparent conductive electrodes for various applications, particularly, solar cells and organic light emitting diode (OLED). Where, the transmission of the film is about 90% in the visible range, the activation energy is about 0.093 eV and the electrical conductivity at room temperature is 382.7Ω-1m-1.
Contents
Contents Chapter One: Theoretical Background
Page
1.1 Fundamental Properties of Zinc Oxide (ZnO): 1.1.1
Introduction to ZnO.........................................................................................1
1.1.2
Transparent conducting oxides (TCOs)...........................................................2
1.1.3
Crystal structure of ZnO..................................................................................2
1.1.4
Electrical properties of ZnO.............................................................................3
1.1.5
Optical properties of ZnO................................................................................8
1.1.6
Photoluminescence properties of ZnO...........................................................12
1.2 Pulsed Laser Deposition (PLD): 1.2.1
Introduction to PLD………………...…………………………………........14
1.2.2
Laser ablation mechanisms……………………………………………........14
1.2.3
Laser – Target interaction……...…………..…………………..…………...14
1.2.4
Laser – plasma interaction…………………..……………….......................20
1.2.5
Plasma plume expansion………………………..…….……….....................20
1.2.6
Plume- Substrate Interaction………………………..………........................21
1.2.7
Pulse shaping……………………………………………..………………....21
1.2.8
Growth Kinetics during Pulsed Laser Deposition………….…………….....22
1.2.9
Film Growth Modes…………………………………….…..........................22
1.2.10 Growth Kinetics………………………………………….............................26 1.2.11 The advantages of PLD………………………………………......................29 1.2.12 The disadvantages of PLD……………………………….............................30
1.3 Other ZnO Thin Film Fabrication Methods: 1.3.1
RF magnetron sputtering……………………….……..……...……………..31
1.3.2
Molecular beam epitaxial.....…...……………………………………….…..33
1.3.3
Chemical vapor deposition……….…………………………........................35
1.4 Application of ZnO Thin Films…...…………….……..……………………....37 1.5 References………………………………….….....…………….............................39 Chapter Two: Literature Review and Aim of The work
Contents 2.1 Literature Review………………..…………...………….……………………...46 2.2 Aim of The work ……………………………….……….…................................56 2.3 References………………………………...…………….………………………...57 Chapter Three: Experimental Work 3.1
Experimental Procedures: 3.1.1 Preparation of ZnO nanoparticles using microwave irradiation……………...62
3.1.2 Preparation of ZnO thin films by using PLD system……………………....…62
3.2
Characterization Technique:
3.2.1 X-ray diffraction …………………………………………….........................63 3.2.2
Scanning Electron Microscope…………………………………...................68
3.2.3
Transmission Electron Microscope………....………………………………70
3.2.4
Fourier Transform Infrared spectroscopy…...………………........................73
3.2.5
Transmission measurement……………………….………….......................76
3.2.6
Photoluminescence spectroscopy……………………………………….…..76
3.2.7
Measurement of dc conductivity……………………………………………79
3.2.8
Measurement of ac conductivity………………………….…........................79
3.2.9 Thickness measurement…………………………………….……………….80
3.3 References……………………………………………………...……………..….83 Chapter Four: Results and Discussion 4.1 Annealed ZnO Thin Films: 4.1.1 Structural properties........................................................................................84 4.1.1.1 Grazing incident x-ray diffraction (GIXRD)……………………………….84 4.1.1.2 FTIR spectra…………………………………………...………………...87 4.1.1.3 TEM……………………………………………….……..…………..…87
4.1.2 SEM……………….………….......................................................................87 4.1.3 Optical properties………………………………………...............................90 4.1.4 Photoluminescence properties…..……………...………….. ……………....98 4.1.5 Electrical properties……………………………….….… ………………….98 4.1.5.1 dc conductivity……………………………….……..................................98
4.2 Annealed ZnO Nanoparticles:
Contents 4.2.1 Structural properties…………………………...…..………........................103 4.2.1.1 XRD………………………………………….…..................................103 4.2.1.2 FTIR spectra………….……………………………..............................105 4.2.1.3 TEM……………………………...………………………………........105
4.2.2 SEM............................................................................................….............105 4.2.3 Optical properties……………………………………..……..……....…….108 4.2.4 Photoluminescence properties…………………...……………..………....115 4.2.5 Electrical properties…………………………………………………….....115 4.2.5.1 dc conductivity……………………………………….….....................115 4.2.5.2 ac conductivity…………………………………….………..................119
4.3 Comparison study between ZnO thin films and ZnO nanoparticles …………………………………………………………………..120 4.4 References……………………………………………………..……………......124 Chapter Five: Conclusion and Future Work 5.1 Conclusion……………………………………………….……………………..126 5.2 Future Work……………………………………….….…….............................127
Chapter One
Theoretical Background
1.1 Fundamental Properties of Zinc Oxide (ZnO): 1.1.1 Introduction to ZnO: A large amount of the academic literature on transparent conductive oxides (TCO) films equipped by pulsed laser deposition (PLD) is targeted on Indium Tin Oxide (ITO) thin films. But in current years, due to the broad applications of ITO materials, the fee of ITO materials is increasing, which is forcing numerous scientists to try to discover new type of materials to substitute ITO. Over these new kind of materials, ZnO thin films have concerned the most interest, because different the more commonly used ITO, ZnO is a non‐toxic and cheap material due to rich ZnO resources. We can find clear evidence in the fact that more than 1500 papers have been published on ZnO thin films growth and properties of ZnO in this decade. ZnO is an n‐type semiconductor having a direct band gap of 3.3eV at room temperature, large exciton binding energy (60 meV) and high optical transparency [1, 2]. The properties of ZnO with a direct band gap and high exciton binding energy are much higher than those of other widely used wide‐band‐gap materials, for example, ZnSe (20 meV) and GaN (21 meV). In addition, the ZnO thin films can be deposited at a lower temperature than ZnSe and GaN. So, its wide‐band‐gap properties enable ZnO to become a potential material for short‐wavelength optoelectronic devices, such as UV lasers, light‐emitting diodes and UV detectors [3, 4], which can be applied to high density data storage systems, solid‐state lighting, secure communications and bio‐detection. The deposition technique of ZnO thin films has been considered by major techniques, such as magnetron sputtering [5, 6], chemical vapour deposition (CVD) [7,8], metal‐organic vapour phase epitaxy (MOVPE) [9], sol‐gel processing [10], spray pyrolysis [11] and pulsed laser deposition (PLD) [12]. Over these methods, the PLD technique is considered as a very efficient method to growth high‐quality films with complex composition. In addition, thin films deposited by PLD can result in better crystal structure at lower temperature than by other techniques, which is caused by the higher energy of the a belated -1-
Chapter One
Theoretical Background
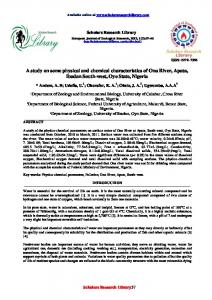
particles in the laser‐produced plasma plume [13]. Moreover, there are still other advantages of using the PLD technique making it so effective. For example, deposition processes in controllable oxygen ambient pressure result in high controllability of thin film chemical element composition and grain growth processes. 1.1.2 Transparent conducting oxides (TCOs): Transparent conducting oxide (TCO) films have been used widely in the optoelectronics manufacturing, such as the LCD manufacturing, due to their high electrical conductivity, high optical transmittance in the visible region, and high reflectance in the infrared (IR) region. After Badeker [14] reported the first research about TCO, TCO films have started to be widely utilized as an essential part of many optoelectronic applications such as, solar collectors, gas sensors and liquid crystal displays. Over these last few decades, a large number of TCO materials have been investigated such as In2O3, SnO2, ZnO and CdO as well as their doped oxides; most efforts has been concentrated on creating thin films to improve the electrical conductivity and optical transparency of the films. Additionally, it is well known that most of the TCO materials are n‐type semiconductors. So, there have also been some efforts on developing p‐type TCO films, such as N‐doped ZnO [15]. Over all the TCO films, ITO thin films are the most widely used in specific applications, such as flat panel displays, solar cells and LEDs, but due to the cost issue impurity‐doped ZnO films also began to attract much attention because they are non toxic and inexpensive and have comparable electrical and optical properties to ITO [16]. 1.1.3 Crystal structure of ZnO: ZnO belongs to the group of II‐VI binary compound semiconductors which crystallize in either a cubic zinc‐blende or hexagonal wurtzite structure where each anion is surrounded by four cations at the corners of a tetrahedron, and vice versa. The bonding of this tetrahedral coordination is characteristic of sp3 covalent bonding. Therefore, as shown in Figure1‐1, the crystal structures of -2-
Chapter One
Theoretical Background
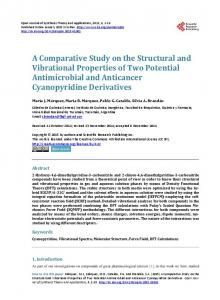
ZnO are wurtzite (B4), zinc blende (B3), and rock‐salt (B1). Under ambient conditions, the thermodynamically stable phase is wurtzite, while the zinc‐blende ZnO structure is only revealed by growth on cubic substrates; moreover, the rock‐salt structure probably grows at relatively high pressure. Therefore, the structure of ZnO thin films deposited by PLD and ZnO nanoparticles belongs to the wurtzite structure [17]. The wurtzite structure has a hexagonal unit cell with two lattice parameters, a=3.250 Å and c=5.206 Å, in the ratio of c/a= =1.633. The schematic structure is shown in Figure 1‐2, and this structure has two interpenetrating hexagonal‐close‐packed (hcp) sub‐lattices. Each sub‐lattice consists of one type of atom represented with respect to each other along the threefold c‐axis by the amount of u=3/8=0.375 (in an ideal wurtzite structure) in fractional coordinates (the u parameter is defined as the length of the bond parallel to the c axis, in units of c or nearest neighbor distance b divided c). The density ( ) of ZnO was calculated by using the following equation:
=
(1-1)
where n is the number of atoms per unit cell, M is the molecular weight in g/mol, V=
a2c is the cell volume in cm3, Na is Avogadro's number in mol-1
and Nt is the free charge-carrier concentration in cm-3. 1.1.4 Electrical properties of ZnO: The electrical resistivity ( ) of ZnO is determined by the carrier concentration (N) and carrier mobility (μ), which is also presented as =1/ (Ne μ) where e is the electron charge. It is known that e is a constant, so, for obtaining low resistivity, the carrier concentration (N) and carrier mobility (μ) should be simultaneously maximized, and most research papers have suggested that the method of achieving maximum carrier concentration is by oxygen vacancies and doping. Oxygen vacancies can be created by controlling the substrate temperature or ambient oxygen pressure. -3-
Chapter One
Theoretical Background
Fig 1‐1: Stick and ball representation of ZnO crystal structures: (a) cubic rocksalt (B1), (b) cubic zinc blend (B3), and (c) hexagonal wurztie (B4). The shaded gray and black spheres denote Zn and O atoms, respectively.
Fig 1‐2: Schematic representation of a wurtzitic ZnO structure having lattice constant a in the basel plane and c in the basel direction, u parameter is expressed as the bond length or the nearest‐neighbor distant b divided by c (0.375 in ideal crystal), and α and β (109.47o in ideal crystal) are the bond angles.
-4-
Chapter One
Theoretical Background
The literature [16] indicates “If an oxygen vacancy is created in a perfect crystal, two electrons are created in the crystal and contributed as ionized donors. But, if there is too much oxygen created in the thin films, sub-oxides will form, causing the resistivity to rise. In addition to the oxygen vacancies, doping also can change the electrical conduction of TCOs. As host cations are substituted by elements with a valence higher than that of the host, the extra electrons can become conduction electrons. To avoid the charge neutrality, substitution of a higher valence element creates extra electrons. It is well known that pure zinc oxide films usually have a characteristic high resistivity due to their low carrier concentration. Therefore, in order to decrease resistivity, we can increase either the carrier concentration or the carrier mobility in zinc oxide thin films. The former is probably obtained by oxygen and/or zinc non‐stoichiometry, or doping with an impurity. However, Hu et al. [18] pronounced that non‐stoichiometric films have excellent electrical and optical properties, but they become very unstable as the ambient temperature becomes higher. On the other hand, for obtaining stable low resistivity ZnO thin films, doped ZnO thin film is probably a good approach. In conclusion, the majority of research for achieving low resistivity ZnO thin films is focused on increasing the free carrier concentration in thin films through use of dopants and oxygen vacancies. But, Johson et al. [19] in 1947 stated that increasing the carrier density via doping or oxygen vacancies is self‐limiting because the increase of the number of free carriers decreases the mobility of carriers due to carrier‐carrier scattering. Therefore, there is a trade‐off relation between the carrier density and the carrier mobility for obtaining low resistivity. The electrical conductivity (σ) is the reciprocal of the electrical resistivity ( ) and also presented as σ = Ne μ. The electrical conductivity is classified as the following: i) dc conductivity: When a steady voltage (V) is applied across nonmetallic sample having cross sectional area (A) and length (L), the current (I) will pass through the sample. According to ohm's law the electrical resistance (R) is presented as R=V/I and the dc conductivity (σ dc) will be: -5-
Chapter One
Theoretical Background
σdc = 1/ = L/RA
(1-2)
ZnO is an n‐type semiconductor due to the oxygen vacancy defect, the oxygen vacancy defect is donor level which lies between the valence and conduction band as shown in Fig 1-3. The thermal energy required to excite the electron from the donor level (Ed) to the conduction band (Ec) is called the activation energy (ΔE), this means that as the temperature increases the dc conductivity will be increase. The relation between the dc conductivity (σ dc) and the temperature (T) in Kelvin of n-type semiconductor (ZnO) is defined as the following (Arrhenius equation): σ dc = σo e-ΔE/KT
(1-3)
Where σo is pre-exponential factor, K is Boltzmann constant. ii ) ac conductivity: A dielectric material is one that is electrically insulating (nonmetallic) and exhibits or may be made to exhibit an electric dipole structure. That is, there is a separation of positive and negative electrically charged entities on molecular or atomic level. As a result of dipole interactions with electric fields, dielectric materials are utilized in capacitors. When alternating voltage (Vac) with frequency (f) is applied across nonmetallic sample having cross sectional area (A) and length (L), the sample creates electric dipoles and it like as a capacitor with capacitance (C). So, the dielectric constant (ε') will be: ε' = C L/ ε o A
(1-4)
The ac conductivity (σ ac) will be: σ ac = 2 п f εoε'' = 2 п ε of ε' tan δ Where, ε
o
(1-5)
is the permittivity of free space, ε' is the dielectric constant which
related to the polarizability and the local field inside the material and measure the amount of energy stored in the dielectric due to an applied electric field, ε'' is the dielectric loss which responsible for attenuation of the local field inside the material and measure an amount of energy dissipated in the dielectric due to an applied electric field, tan δ = ε''/ ε' is the dielectric loss factor.
-6-
Chapter One
Theoretical Background
Fig 1-3: Donor level and activation energy in n-type semiconductor.
-7-
Chapter One
Theoretical Background
1.1.5 Optical properties of ZnO: When light proceeds from one medium into another, several phenomena occur. Some of the light radiation may be transmitted through the medium, some will be absorbed, and some will be reflected at the interface on the surface. Moreover, the intensity IO of the beam incident on the surface of the thin films must equal the sum of the intensities of the transmitted, absorbed, and reflected beams, which can be written as IO=IT+IA+IR. An alternate form of the above equation is T+A+R=1, where T, A, R, respectively, are the transmissivity (IT/IO), absorptivity (IA / IO), and reflectivity (IR / IO). Thus, materials that are capable of transmitting light with relatively little absorption and reflection are transparent. The optical phenomena that occur within solid materials, such as ZnO thin films, involve interactions between the electromagnetic radiation and atoms, ions and electrons. Of these interactions, electronic polarization and electron energy transitions are the most important. Nevertheless, absorption by electronic polarization is only explained for the light frequencies in the vicinity of the relaxation frequency of the constituent atoms [20]. Thus, for non‐metallic materials like ZnO films at short wavelength (λEg. Based on the above theory in which the absorption occurs by hυ>Eg, we extend our discussion to metallic materials. As shown in Figure 1‐5, since metallic materials not have a band gap, every photon has enough energy to excite the electron into a higher energy unoccupied state. In contrast, for semiconductors like ZnO thin films, the absorption phenomenon occurs when the energy of the photon in some range of -8-
Chapter One
Theoretical Background
Fig 1‐4: (a) Mechanism of photon absorption for non‐metallic materials in which an electron is excited across the band gap, leaving behind a hole in the valence band. The energy of the photon absorbed is E, which is necessarily greater than the band gap energy Eg. (b) Emission of a photon of light by a direct electron transition across the band gap.
Fig 1‐5: The relation between absorption and the energy band for Metal.
-9-
Chapter One
Theoretical Background
wavelength is greater than Eg while the transparency phenomenon occurs as that of photon under some range of wavelength is smaller than Eg. Hence, that is the reason why the ZnO thin films are only transparent in the visible range, visible light lies within a very narrow region of the spectrum with wavelengths raging between 400 nm to 700 nm [21]. The transmittance can be used to calculate absorption coefficients of ZnO at different wavelengths. The absorption coefficient (α) is given by the relation [22]:
α=
)
(1-6)
Where x is the film thickness, T is the transmittance. In general, the absorption coefficient spectrum of semiconductor can be divided into three regions: 1- A high-energy range where the data obey Tauc’s law [23]: αhυ = β (hυ - Eg) n
(1-7)
Where Eg is the band gap energy corresponding to a particular transition, β is a band edge constant, υ is the incident frequency and the exponent ''n'' characterizes the nature of band transition. n = 1/2 and 3/2 corresponds to direct allowed and direct forbidden transitions, n = 2 and 3 corresponds to indirect allowed and indirect forbidden transitions respectively. It is observed that for ZnO the best straight line is obtained for n =1/2 which is expected for direct allowed transition. The optical band gap Eg can then be obtained from the intercept of (αhυ)2 vs hυ for direct allowed transitions. 2- An intermediate region, where the absorption coefficient (α) follows an exponential behavior of the form, usually named as Urbach tail: α = α0 exp (hυ/ Ee)
(1-8)
This is related to tails of localized defect states at the band edges, E e is the band tail width in semiconductors and α0 is constant. 3- Below the exponential part of the absorption edge, its strength and shape were found to be dependent on the preparation, purity, and thermal history of the material even if the material is in the bulk form rather than as a film [23]. It is difficult to study this absorption in thin films because of the low absorption levels. A low-energy range appears where a flattens out, indicating additional optical absorption ascribed to deep localized defect states. - 10 -
Chapter One
Theoretical Background
The extinction coefficient (k) which responsible for attenuation of light is calculated using the following relation [23]: αλ
(1-9)
Where α is the absorption coefficient and λ is the wave length of light. The refractive index (n) can be calculated according to the following relation [23]: (1-10) If k
then (1-11)
Where R and k are reflectance and extinction coefficient of the films respectively. From the transmission and reflection spectra, the propagation, reflection and loss of light are observed by calculating the frequency dispersion of ε*. The ε* is very important because it will provide the electronic structure of the material and it will help the design of highly efficient optoelectronic devices. The complex dielectric constant (ε*) can be calculated by the following equation [23]:
ε*=ε1-iε2
(1-12)
Where ε1 = n2 - k2 is the real part of the dielectric constant which related to the electronic polarizability and the local field inside the material, ε2 = 2nk is the imaginary part of the dielectric constant which responsible for attenuation of the local field inside the material, The loss factor tan δ is the ratio of ε2 and ε1. The refractive index (n) can be further analyzed to obtain the high-frequency dielectric constant ε∞ according to the following procedure. This procedure describes the contribution of the free carriers and the lattice vibration modes of the dispersion. According to Pankove [23]:
ε
ε∞
ε
λ
(1-13)
- 11 -
Chapter One
Theoretical Background
Where ε1 is the real part of the dielectric constant as obtained from Eq (1-12), while ε∞ is the lattice dielectric constant, λ is the wavelength, e is the charge of the electron, Nt is the free charge-carrier concentration, εo is the permittivity of the free space, m* the effective mass of the charge carriers in units of kg, and c is the velocity of light. It is observed that the dependence of ε1 on λ2 is linear at longer wavelengths. Extrapolating the linear part of this dependence to zero wavelength gives the value of ε∞ and from the slopes of these lines we can calculate the values of Nt/m* for the investigated films. By using eq. (1-1) we can calculate the free charge-carrier concentration (Nt) then substitute the values of (N t) into the slope to get the effective mass (m*). The free charge carriers inter-atomic distance (R) is given by: (1-14) 1.1.6 Photoluminescence properties: Optical transitions in ZnO have been studied by a variety of experimental techniques such as optical absorption, transmission, reflection, photoreflection, spectroscopic
ellipsometry,
photoluminescence,
cathodoluminescence,
calorimetric spectroscopy, etc. It is well known that at room temperature the PL spectrum from ZnO typically consists of a UV emission band and a broad emission band, as shown in Figure 1-6. The UV emission band is dominated by the free exciton (FE) emission. The broad emission band literally between 420 and 700nm is called deep level emission band (DLE). The UV emission band is related to a near band-edge transition of ZnO, namely the recombination of the free excitons. The deep level emission band has been attributed to several defects in the crystal structure such as O-vacancy (VO) [24-25], Zn-vacancy (VZn)[26-27], O-interstitial (Oi) [28], Zn-interstitial (Zni) [29], and the oxygen antisite defect (OZn). zinc interstitials Zni and oxygen vacancies VO are donor levels, zinc vacancies VZn, oxygen interstitial Oi and oxygen antisite OZn are acceptor levels Recently, this deep level emission band had been identified and at least two different defect origins (VO and VZn) with different optical characteristics were claimed to contribute to this deep level emission band [30-31].
- 12 -
Chapter One
Theoretical Background
Fig 1-6: PL spectrum of ZnO nanorods from the sample grown on a 1.7 nm thick Au-layer deposited (001) Si substrate at 890 oC, measured at room temperature with excitation power of 5 mW, the excitation wavelength is 350 nm.
- 13 -
Chapter One
Theoretical Background
1.2 Pulsed Laser Deposition (PLD): 1.2.1 Introduction to PLD: Pulsed laser deposition (PLD) is a physical vapour deposition process, which involves a deposition process in a vacuum system. Functionally, it shares some process characteristics in common with molecular beam deposition and some with sputter deposition. As shown schematically in Figure 1‐7, a pulsed laser is directed on to a target of the material, such as pure ZnO nanoparticles target, to perform a deposition process. Each laser pulse ablates a small amount of the material creating a plasma plume. Then, the ablated material is ejected from the target in a highly forward‐directed plume. The ablated species condense on the substrate placed opposite to the target [32]. 1.2.2 Laser ablation mechanisms: In PLD a pulsed high-energetic laser beam is focused on a target resulting in ablation of material. At the early stage of the laser pulse a dense layer of vapor is formed in front of the target. Energy absorption during the remainder of the laser pulse causes, both, pressure and temperature of this vapor to increase, resulting in partial ionization. This layer expands from the target surface due to the high pressure and forms the so-called plasma plume [33]. During this expansion, internal thermal and ionization energies are converted into the kinetic energy of the ablated particles. Attenuation of the kinetic energy due to multiple collisions occurs during expansion into low- pressure background gas. Usually, the laser ablation process is divided in two stages, separated in time [34]: Target evaporation and plasma formation Plasma expansion. 1.2.3 Laser – Target Interaction: Ideally the plasma plume produced should have the same stoichiometry as the target if we hope to grow a film of the correct composition. If, for example, the - 14 -
Chapter One
Theoretical Background
Fig 1‐7: The Schematic description of a PLD experimental set‐up.
- 15 -
Chapter One
Theoretical Background
target surface were heated slowly, say by absorbing the light from laser source, and then this would allow a significant amount of the incident power to be conducted into the bulk of the target. The subsequent melting and evaporation of the surface would essentially be thermal i.e. the difference between the melting points and vapour pressures of the target constituents would cause them to evaporate at different rates so that the composition of the evaporated material would change with time and would not represent that of the target. This incongruent evaporation leads to films with very different stoichiometry from the target [35]. To achieve congruent evaporation the energy from the laser must be dumped into the target surface rapidly, to prevent a significant transport of heat into the subsurface material, so that the melting and vapor points of the target constituents are achieved near simultaneously. The high laser power density that this implies is most readily achieved with a pulsed or Q-switched source focused to a small spot on the target. If the energy density is below the ablation threshold for the material then no material will be removed at all, though some elements may segregate to the surface [36]. In general the interaction between the laser radiation and the solid material takes place through the absorption of photons by electrons of the atomic system. The absorbed energy causes electrons to be in excited states with high energy and as a result the material heats up to very high temperatures in a very short time. Then, the electron subsystem will transfer the energy to the lattice, by means of electron-phonon coupling [33, 35]. When the focused laser pulse arrives at the target surface the photons are absorbed by the surface and its temperature begins to rise. The rate of this surface heating, and therefore the actual peak temperature reached, depends on many factors: most importantly the actual volume of material being heated. This will depend not only upon how tightly the laser is focused but also on the optical penetration depth of the material. If this depth is small then the laser energy is absorbed within a much smaller volume. This implies that we require a wavelength for which the target is essentially opaque and it is in general true that the absorption depth increases with - 16 -
Chapter One
Theoretical Background
wavelength. The rate of heating is also determined by the thermal conductivity of the target and the laser pulse energy and duration. The actual sequence of events which occur when the laser pulse arrives at the target is illustrated in Figure1-8, and presented below: Firstly, a), the leading edge of the pulse causes the surface to melt. Then, b), the melt front proceeds further into the target as the molten material begins to evaporate. Then, c), dense plasma forms which are still opaque to the laser pulse causing its temperature to rise rapidly. Finally, d), this plasma expands rapidly, becoming more transparent as the plasma density decreases. As short pulse, high peak power, Q-switched lasers became available interest in PLD was rejuvenated. Laser-target interactions are notoriously difficult to model analytically due to there being at least three mechanisms operating in the process of absorption of radiation into the material. These mechanisms are commonly thought to be: Phonon and electron excitation within the lattice. Free carrier excitation. Excitation of the resulting plasma and subsequent transfer of energy to the material. A number of parameters like the absorption coefficient, reflectivity of the target material, the pulse duration (τ), wavelength (λ) and laser fluency (f) affect the interaction of the laser beam with the target. The ablation process is difficult to model. This is particularly the case if a background ambient gas is present. However, have developed a one dimensional model which treats the laser generated plasma as an ideal gas at high temperature and pressure, which is then solved numerically. In this model the temperature, T(x,t), at any point in the material during the laser pulse is determined using the following heat flow equation[37]:
- 17 -
Chapter One
Theoretical Background
Fig 1-8: Schematic representing the interaction between the laser pulses and the target material.
- 18 -
Chapter One i(T)
Theoretical Background α
Cpi(T)
, i =1,2
Where x is the direction perpendicular to the plane of the target, t is
(1-15)
time,
(T)and Cp(T) are the density and thermal heat capacity per unit mass, K is the thermal conductivity, and the subscript (i) refers to the solid and liquid phase respectively. R (T) and α (T) are the reflection and absorption coefficients of the target at the laser wavelength and Io(t) is the laser intensity. If the thermal conductivity is low over a nanosecond timescale then the first term on the right hand side of equation (1-15) can be ignored. Therefore the temperature of the target surface, x = 0, is given by [38]: (T) Cp(T)(T-To)=(1-R)Io α(T)τ
(1-16)
Where T0 is the initial temperature and τ is the pulse duration. Even this very simplified equation still retains the values
(T), Cp(T) and α(T) which are
functions of temperature and as such are not easily determined. For material with a wide band gap such as ZnO, ablation by nanosecond pulse duration lasers occurs essentially by thermal processes according to Kelly [39] and Miotello [40]. There are three regimes of thermal ablation, namely vaporization, heterogeneous boiling and explosive boiling, but only vaporization and explosive boiling are compatible with the time scale of nanosecond laser pulses. Since explosive boiling only occurs when the target reaches temperatures near the material's thermodynamic critical temperature [41,42], the flow of material vaporized from the surface of a body at temperature T can be calculated by the Hertz- Knudsen equation, leading to an ablation rate υ given by: υr(T) = (1-β)
(1-17)
Where Tb is the boiling temperature at pressure p0, kB the Boltzmann constant, β the back flux coefficient and LV, m,
are the latent heat of vaporization, mass
and the density of the material respectively. - 19 -
Chapter One
Theoretical Background
1.2.4 Laser – plasma interaction: In the description of the laser–plasma interaction, the laser pulse duration plays a crucial role. Where as in the case of nanosecond (ns) laser pulse, the forming plasma interacts with the laser beam, in the case of femtosecond (fs) laser pulse the previous mechanism doesn’t take place. Because of the formation of a plasma in front of the target, the laser beam will be partially absorbed before it reaches the target i.e. so called (plasma shielding effect)[43] and increases the plume ionization degree, complicating the plume expansion mechanism. Due to the plasma-laser interaction, the temperatures of the evaporated material increases therefore rapidly to extremely high values and the electrons are further accelerated. The excited particles will emit photons, leading to a bright plasma plume, which is characteristic for the laser ablation process. The main absorption processes are the Inverse Bermsstrahlung (IB) [44, 45], IB involves absorption of photons by free electrons which are accelerated during collision with neutral or ionized atoms. The cross section for IB via electronneutral collisions is much smaller than that via electron ion collisions. 1.2.5 Plasma plume expansion: Since the onset of the material removal described in the previous sections takes place within a very short time after the pulse (1-100 ps), on the time scale of the plasma expansion (μs), the laser–target event can be regarded as a momentary release of energy. The spatial structure of the vapor plasma at the early stage of its expansion is well known to be a cloud strongly forwarded in the direction normal to the ablated target. The reason of this characteristic plasma elliptic shape, called plume, is in the strong difference in pressure gradients in axial and radial directions, the plasma expands in the direction of maximum pressure gradient [46]. Another important characteristic of the ablation plume pertinent to PLD is the angular distribution of the ejected species in the plume or simply the plume angular distribution [47]. In case of vacuum the plume angular distribution is determined by the collisions of the plume particles among themselves in the initial stage. When plume is - 20 -
Chapter One
Theoretical Background
small however in the presence of the ambient gas the plume angular distribution is modified due to collision between the plume species and background gas atoms [48]. These collisions scatter the plume particles from their original trajectories and broaden
the angular distribution. It is generally expected that
for a given background gas these additional collisions will lead to wider angular distribution of lighter plume species and similarly a scattering ambient with high mass will more effectively disperse the plume species compared to a low mass scattering ambient [33]. Expansion the plume in vacuum is driven by the energy which is accumulated as thermal energy and energy which is stored as excitation and ionization in the initial layer. This energy is converted to kinetic energy of the atoms in the plume, and eventually all atoms will move with an asymptotic, constant velocity distribution. As soon as the laser pulse ends, there is little further transfer of energy and mass to the ablation plume, and the plume propagation can essentially be considered as an adiabatic expansion [49]. Laser ablation with ultra short pulses (τ s).
At the intermediate case, a transition from the Frank and Van der Merwe to the Volmer-Weber growth mode can be observed. Here a crucial role is played by the mismatch between film and substrate, inducing a strain on the growing film. A layer-by-layer growth takes place in the first stage. Then, the thicker become the film, the higher is the elastic energy due to the strain. Such large strain energy can be lowered by forming islands in which strain is relaxed. This mechanism results in a continuous film of one or two monolayers onto which successively discrete islands are formed. This way of growth is the so-called Stranski-Krastanov [33, 54]. In the Figure 1-10, the previous regimes are depicted. The previous approach doesn’t take into account the effect on the growth kinetic of the deposition parameters, such as the value of super saturation in the gas phase, the substrate vicinality and the crystallographic misfit between the film and substrate unit cells. For the effect of such parameters, different growth modes have been observed for the same film substrate system, thus clearly indicating that growth techniques and parameters are crucial to determine the final film morphology. A first difference should be done between homoepitaxy and heteroepitaxial growth. In the first case the film and substrate compounds are the same deposited and the substrate crystalline structure extends into the film during the growth. In case of heteroepitaxial, the materials of film and substrate are different, with different lattice parameters [53]. - 24 -
Chapter One
Theoretical Background
Fig 1-10: Film growth modes layer-by-layer: (a) Frank –Van der Merwe, (b) Volmer –Weber (c) Srtanski-Krastanov and (d) step flow.
- 25 -
Chapter One
Theoretical Background
1.2.10 Growth Kinetics: For the sake of simplicity, in the following discussion will calculated on the growth kinetics in the homoepitaxy case, where complicating effects as lattice parameter misfit and Thermal coefficient expansions do not play a role. Once adsorbed on the surface an atom, now called adatoms, may desorbs into the vapor or change adsorption site, in which case it can diffuse on the surface for several atomic length, before to be detached and incorporated in the crystal structure, as schematized in Figure 1-11. The molecule-surface interaction is described by a potential that is a periodic function of the two coordinates parallel to the surface and a decreasing function of a third coordinate normal to it. Assuming lT is the terrace length, we define lD as the average distance an atom can travel on a flat surface before being trapped. It is given by [36]:
lD=
(1-19)
Where Ds is the surface diffusion coefficient of the adatoms, and τ is the residence time before re-evaporation. The surface diffusion coefficient Ds (typical values for metal oxide lie between 10 -4 and 10-8cm2s-1) is generally expressed as:
Ds=a2υ exp(-EA/KBT)
(1-20)
Where EA is the activation energy for diffusion, a is the characteristic jump distance and υ is the sticking coefficient. From equation (1-20) it became evident the importance of the deposition temperature in the PLD technique, since it controls, among others, the diffusivity of the adatoms. However, it is important to recall here that the adatoms mobility on the surface is determined not only by the deposition temperature but an important contributes in the nucleation process come from the redistribution of the kinetic energy of the incoming flux of impinging atoms. The diffusion process is a crucial phenomenon that determines how the deposited materials rearrange itself on the surface and by a careful control of these parameters it is possible to obtain 2D growth modes not only on singular, but also on vicinal substrates. - 26 -
Chapter One
Theoretical Background
Fig 1-11: Adatoms kinetics schematization.
- 27 -
Chapter One
Theoretical Background
To understand this, two diffusion process have been considered, both determined by kinetic parameters [55]: The interlayer mass transport: the diffusion of atoms on terrace. The interlayer mass transport: the diffusion of atoms to a lower step. In the case of fast interlayer mass transport, the mobility of the adatoms is high enough to enable atoms to reach the edges of the substrate steps i.e. the diffusion length lD is larger than the average terrace width l T. In this case the nucleation on the terraces is prevented and the step-flow growth takes place. Even on a vicinal substrate, a 2D growth will occur, until lD > lT . Otherwise, if for some reason the distribution in lT of the surface broadens, nucleation on the terraces will occur. When this happens, nuclei will form until a saturation density is reached. After that, the probability for atoms to attach to an existing nucleus exceeds the probability to form a new nucleus and so islands will start to grow. In this case the interlayer mass transport plays a big role to determine the growth mode. In fact, to obtain a layer-by-layer growth mode in this situation, a steady interlayer mass transport should be present so that atoms deposited on top of a growing island must reach the island edge and then diffuse to a lower layer. In the ideal case, the nucleation's start after completion of a layer, but if there is no interlayer mass transport, nucleation will occur on top of islands before these have coalesced and this is the case of the so called second layer nucleation. The probability for second layer nucleation is related to the mean island radius at the time of stable clusters nucleation on top of the islands, RC. The value of RC is, in turn, related to the parameter ES, that is the energy barrier for an atom to descend. Across the step edge to a lower terrace, larger is the value of E S, smaller will be the value of RC, since the additional energy barrier lead to accumulation of the adatoms on top of the islands, with subsequently increase of second layer nucleation rate [54]. In the real system the growth mode is in between these growth modes described here. In some cases, even a transition from a layer-by-layer to a step-flow
- 28 -
Chapter One
Theoretical Background
growth on vicinal substrate can happen when the diffusion length of adatoms becomes comparable to the terrace width, i.e. when lD ≈ lT. 1.2.11 The advantages of PLD: Many techniques such as magnetron sputtering [5, 6], chemical vapour deposition (CVD)[56], metal-organic vapour phase epitaxy (MOVPE)[9], sol‐gel[10], spray pyrolysis[11], and pulsed laser deposition (PLD) have been used to deposit ZnO films. Among these techniques, the PLD technique has been proved to be a very effective method to deposit high quality films. That is because of the following reasons: Films grown by PLD can be realized at low temperature. The most important characteristics in PLD is the ability to implement stoichiometric transfer of ablated material from targets to substrate for many materials. This comes from the non‐equilibrium nature of the ablation process itself due to absorption of high laser density by a small volume of material. However, if the laser fluency is too low, the laser pulse simply heats the target. In this case, the evaporative flux from a target would be determined by the vapour pressures of the constituents. In contrast, as the laser fluency is increased, the ablation threshold is reached where the laser energy ablation is higher than that needed for evaporation. Consequently, absorption by the ablated species occurs, resulting in the formation of plasma at the target surface. Therefore, with appropriate choice of ablation wavelength and absorbing target, high‐energy densities are absorbed by a small volume of material, resulting in vaporization that is not dependent on the target temperature [15]. High controllability of composition of thin films and growth process with controllable gas partial pressure, such as ambient oxygen pressure. The purpose of ambient gas introduced into PLD chamber can be explained by two reasons. First, the formation of thin film materials often requires a reactive species, such as molecular oxygen for oxides, as a component of the flux. Interaction of ablated species with the background gas often produces molecular species in the ablation plume, and these species can cause phase - 29 -
Chapter One
Theoretical Background
formation. Secondly, the background gas can also be used to reduce the kinetic energies of the ablated species, which can moderate the plume energies to much than less 1eV [57]. Consequently, interaction with ambient gas slows the ablation plume expansion. The complex material films can be deposited by PLD, PLD can provide stoichiometric transfer of material from the target, generation of energetic species, hyper thermal reaction between the ablated cations and the backgroup gas in the ablation plasma. Moreover, its backgroup pressure can decrease up to ultrahigh vacuum. So, films could be deposited by PLD from single, stoichiometric targets of materials or multiple targets for each element. Uniform thin films can be produced by PLD. The thickness distribution of the thin films is determined by the highly forward‐directed nature of the ablation plume which is quite non‐uniform, and that is because the distribution of material deposited from the ablation plume is symmetric with the target surface normal. However, using faster scanning of the ablation beam over the target and rotating the substrate, PLD can produce uniform coverage over large areas [16]. The biggest advantage is that it is versatile. A very wide range of materials, including oxides, metals, semiconductors and even polymers, can be grown by PLD. All that is required is a target of the desired composition. It is unlike Molecular Beam Epitaxy (MBE) and Chemical Vapour Deposition (CVD), where a different source of precursors is required for each element of the compound [58]. It has the ability to maintain target composition in the deposited thin films[16]. Other advantages are that PLD is clean, low cost relative to CVD, and capable of producing multi‐layers simply by switching between several different targets [59]. 1.2.12 The disadvantages of PLD: - 30 -
Chapter One
Theoretical Background
Although PLD has been successfully applied to many research areas, it still has some disadvantages that include [60]: The ablation plume cross section is generally small (in the order of cm2) due to a limited laser spot size. This, in turn, limits the sample size that can be prepared by PLD. In addition, this also creates difficulty in controlling thickness uniformity across the sample, this problem can be overcome, to some extent, by scanning the laser beam on a larger size target. The plume of ablated material is highly forward directed, which causes poor conformal step coverage. It also makes thickness monitoring difficult. Finally, there is an intrinsic “splashing” associated with laser ablation itself, which produces droplets or big particles of the target material on the substrate surface. From an industrial perspective, this is particularly serious as it will result in device failure. 1.3 Other ZnO Thin Film Fabrication Methods: 1.3.1 Radio frequency (RF) magnetron sputtering: Sputtering is a technique used to deposit thin films of a material on to a substrate. First, it will create gaseous plasma and then accelerating the ions from this plasma on to the target. The target material is eroded by the arriving ions via energy transfer and molecules. (See Figure 1‐12) When these natural particles are ejected they will travel in a straight line unless they come into contact with something, such as other material particles. At this moment, the substrate placed in the path of these ejected particles will be coated by a thin film of the source material (See Figure 1‐13). Although sputtering is proven to be a useful technique in the deposition of thin films, it has two major problems, the deposition rate is slow and the electron bombardment of the substrate is extensive, causing overheating and structural damage. So, the development of magnetron sputtering deals with both of these issues simultaneously. It uses
- 31 -
Chapter One
Theoretical Background
Fig 1‐12: The process of sputter (1).
Fig 1‐13: The process of sputter (2).
- 32 -
Chapter One
Theoretical Background
magnets behind the cathode to trap the free electrons in a magnetic field above the target surface (See Figure 1‐14). These electrons are not free to bombard the substrate, but in traditional sputtering they do. The trapped electrons form curved circuitous paths in the magnetic field, enhancing their probability of ionizing a neutral gas molecule by several orders of magnitude. This increase in available ions significantly increases the rate at which target material is eroded and subsequently deposited on to the substrate. In early ZnO research, RF magnetron sputtering was one of the most used growth techniques. Due to its low cost and low operation temperature [8], magnetron sputtering was a preferred method, when compared to sol gel and chemical‐vapour deposition [7]. The growth usually took place in the chamber ambient with O2/Ar+ O2 ratios ranging from 0 to 1 at a pressure of 10‐3‐10‐2 Torr (0.13Pa‐1.3Pa), O2 was used as the reactive gas and Ar acting as the sputtering enhancing gas. 1.3.2 Molecular beam epitaxial: Molecular beam epitaxy (MBE) was developed in the early 1970s as a means of growing high‐purity epitaxial layers of compound semiconductors [61]. MBE can produce high‐quality layers with a very abrupt interface and good control of thickness, doping and composition due to the high degree of control possible with MBE. So, MBE is a valuable tool in the development of sophisticated electronic and optoelectronic devices. Molecular beam epitaxy implements deposition in high vacuum or ultra high vacuum (10‐8Pa). The most important characteristic of MBE is the slow deposition rate (probably less than 1000 nm per hour), which allows the films to grow epitaxially. In MBE, the molecular beams are typically from thermally evaporated elemental sources, and the gaseous elements then condense on the substrates. This means that evaporated atoms do not interact with each other or the vacuum chamber gases until they reach the substrate due to the long mean free paths of the atoms. During deposition, RHEED (Reflection High Energy Electron Diffraction) is used to monitor the growth of the crystal layers (see Figure1‐15). The computer controls shutters in front of each source, allowing precise control of the thickness of each layer, down to a single layer of atoms. - 33 -
Chapter One
Theoretical Background
Fig 1‐14: The magnet sputter.
Fig 1‐15: The Schematic description of MBE.
- 34 -
Chapter One
Theoretical Background
For ZnO thin films deposited by molecular‐beam expitaxy (MBE), Zn metal and O2 are usually used as the source material. High purity Zn metal is evaporated from an effusion cell, where the cell temperature can be varied to examine the effect of Zn flux on the growth rate and material properties. The oxygen radical beam, which can be generated by ECR or a RF plasma source, is directed on the film surface to obtain high oxidation efficiency. When the oxygen plasma is used, the chamber pressure is around 10‐5 Torr during deposition. 1.3.3 Chemical vapor deposition: Chemical vapour deposition (CVD) is the process of chemically reacting a volatile compound of a material to be deposited, with other gases, to produce a non‐volatile solid that deposits atomistic ally on a suitable placed substrate. It differs from physical vapour deposition (PVD), which relies on material transfer from condensed‐phase evaporant or sputter target sources. Because CVD processes do not require vacuum or unusual levels of power, they were practiced commercially prior to PVD [7]. The fundamental sequential steps that occur in every CVD process are sketched in Figure 1‐16 and include: Convective and diffusive transport of reactants from the gas inlets to the reaction zone. Chemical reactions in the gas phase to produce new reactive species and byproducts. Transport of the initial reactants and their products to the substrate surface. Adsorption and diffusion of these species on the substrate surface. Heterogeneous reactions catalyzed by the surface leading to film Formation. Desorption of the volatile by-products of surface reactions. Convective and diffusive transport. In the CVD method, ZnO deposition occurs as a result of chemical reactions of the vapour‐phase precursor on the substrate (shown in Figure 1‐17), which are delivered into the growth zone by the carrier gas, which is hydrogen (H 2). The reactions occur in a reactor in which a necessary temperature profile is created
- 35 -
Chapter One
Theoretical Background
Fig 1‐16: Sequence of gas transportation and reaction process contributing to CVD film growth.
Fig 1‐17: The Schematic of CVD.
- 36 -
Chapter One
Theoretical Background
in the gas flow direction. The typical pressure is
133Pa and the flow rate is
about 40ml/min. Targets made from Zn powder are placed in the evaporation zone where the temperature is about 770oC. The following chemical reaction between the Zn target and H2 carrier gas takes place in the evaporation zone: ZnO + H2
Zn+ H2O
(1-21) o
On the substrate, where the temperature was kept in the range of 590‐610 C, the reverse reaction occurs: Zn + H2O
ZnO + H2
(1-22)
The ZnO films grown by this method show quite high crystal, electrical and luminescence properties [62]. 1.4 Application of ZnO Thin Films: Having the property of wide band‐gap causes ZnO to not only be a material transparent in the visible and near UV‐visible regions, but also be electrical conductive (n‐type). Moreover, the cost of ZnO compared to ITO is relatively lower. ZnO has been used therefore for transparent conducting electrodes instead of expensive ITO for flat‐panel display and solar cells [63]. In addition to pure ZnO thin films, doping with various elements (Al, Ga, In) is an efficient way to increase the electrical conductivity [64, 65]. Among these doped ZnO thin films, Al‐doped zinc oxide (AZO) thin films have been used as an anode contact for organic light‐emitting diodes (see Fig 1-18). As shown in Figure 1‐19, ITO has been used as an active channel layer in a transparent thin‐film transistor (TFT) that can be operated in the presence of visible light in a LCD display for a while. But due to the improvement of ZnO optical and electrical properties, ZnO thin films also have been used as an active channel layer in a TFT [66]. Another interesting point of ZnO thin film application is to grow (0001) oriented ZnO thin films by PLD on an amorphous substrate. Such textured film on a GaAs substrate has acted as an alignment layer for the growth of c‐axis‐oriented GaN films [67]. Although the textured ZnO films do not exhibit outstanding crystalline quality, very strong emission features associated with exciton transitions were observed, which further lead ZnO thin films on GaAs to become a plausible system for short‐wavelength visible or UV‐light emitting diodes (LEDs). - 37 -
Chapter One
Theoretical Background
Fig 1‐18: The structure of organic light emitting diodes.
Fig 1‐19: The structure of transparent thin-film transistor.
- 38 -
Chapter One
Theoretical Background
1.5 References: 1) S.H. Bae, S.Y. Lee, H.Y. Kim, S. Im, Effects of post‐annealing treatment on the light emission properties of ZnO thin films on Si. Optical Materials, 17(2001) 327. 2) Eun Sub Shim, Hong Seong Kang, Jeong Seok Kang, Jong Hoon Kim, Sang Yeol Lee, Effect of the variation of film thickness on the structural and optical properties of ZnO thin films deposited on sapphire substrate using PLD. Applied Surface Science,186 (2002) 474. 3) D. M. Bagnall, Y. F. Chen, Z. Zhu, T. Yao, S. Koyama, M. Y. Shen and T. Goto, Optically pumped lasing of ZnO at room temperature. Applied Physics Letters, 70(1997) 2230. 4) Service, R.F., Materials Science: Will UV Lasers Beat the Blues? Science. 276(1997)895. 5) R. Ondo-Ndong, G. Ferblantier, M. Al Kalfioui, A. Boyer, A. Foucaran, Properties of RF magnetron sputtered zinc oxide thin films. Journal of Crystal Growth, 255(2003)130. 6) Shusuke Ono, Osamu Yamazaki, Kenzo Ohji, Kiyotaka Wasa and Shigeru Hayakawa, SAW resonators using rf‐sputtered ZnO films on glass substrates. Applied Physics Letters, 33(1978) 217. 7) S.K. Tiku, C.K. Lau, and K.M. Lakin, Chemical vapor deposition of ZnO epitaxial films on sapphire. Applied Physics Letters, 36(1980) 318. 8) J.L. Vossen, G. Hass, M.H. Francombe and R.W. Hoffmann (eds.), Physics of Thin Films, Academic Press, New York, (1977)1. 9) Y. Ma, G. T. Du, S. R. Yang, Z. T. Li, B. J. Zhao, X. T. Yang, T. P. Yang, Y. T. Zhang and D. L. Liu, Control of conductivity type in undoped ZnO thin films grown by metal organic vapor phase epitaxy. Journal of Applied Physics, 95(2004)6268.
- 39 -
Chapter One
Theoretical Background
10) Kumar, Manoj, Mehra.R.M.,Wakahara,A.,Ishida,M., Epitaxial growth of high quality ZnO:Al film on silicon with a thin gamma‐Al2O3 buffer layer. Journal of Applied Physics, 93(2003)3837. 11) J. M. Bian, X. M. Li, X. D. Gao, W. D. Yu and L. D. Chen, Deposition and electrical properties of N‐In codoped p‐type ZnO films by ultrasonic spray pyrolysis. Applied Physics Letters, 84(2004)541. 12) Seong Jun Kang, Yang Hee Joung,Hyun Ho Shin, Yung Sup Yoon, Effect of substrate temperature on structural, optical and electrical properties of ZnO thin films deposited by pulsed laser deposition. Journal of Materials Science: Materials in Electronics, 19(2008)1073. 13) W. S. HU, Z. G. LIU, J. SUN, S. N. ZHU, Q. Q. XU, D. FENG, Z. M. JI, optical properties of pulsed laser deposition ZnO thin films. Journal of Physics and Chemistry of Solids, 58(1997)853. 14) Badeker, Electrical Conductivity and Thermo‐Electromotive Force of Some Metallic Compounds, Ann. Phys.(Leipzig), 22(1907)749. 15) E. Kaminska, A. Piotrowska, J. Kossut, A. Barcz, R. Butkute, W. Dobrowolski, E. Dynowska, R. Jakiela, Transparent p‐type ZnO films obtained
by
oxidation
of
sputter‐deposited
Zn3N2.
Solid
State
Communications, 135(2005)11. 16) R. Eason, pulsed laser deposition of thin films. 2007: wiley- interscience, New York. 17) B.J. Jin, S. Im, and S.Y. Lee, Violet and UV luminescence emitted from ZnO thin films grown on sapphire by pulsed laser deposition. Thin Solid Films, 366(2000)107. 18) J. Hu, and R.G. Gordon, Textured aluminum‐doped zinc oxide thin films from atmospheric pressure chemical‐vapor deposition. Journal of Applied Physics, 71(1992)880.
- 40 -
Chapter One
Theoretical Background
19) V.A. Johnson and K. Lark‐Horovitz, Theory of Thermoelectric Power in Semiconductors with Applications to Germanium. Physical Review, 92(1953)226. 20) William D. Callister, J., Fundamentals of materials science and engineering. Fifth edition ed. 2000: John Wiley & Sons, Inc, New York. 21) V. Srikant and D.R. Clarke, The optical band gap of zinc oxide. Journal of Applied Physics, 83(1998)5447. 22) K.L.Chopra, S. Major, and D.K. Pandya, Transparent conductors‐A status review. Thin Solid Films, 102(1983)1. 23) Pankove I. Optical processes in semiconductors. New Jersey: Prentice-Hall Inc 1971. 24) P. H. Kasai,electron spin resonance studies of donors and acceptors in ZnO, Physical Review.130(1963)989. 25) S. Yamauchi, Y. Goto, and T. Hariu, Photoluminescence studies of undoped and nitrogen-doped ZnO layers grown by plasma-assisted epitaxy, Journal of Crystal Growth 260(2004)1. 26) M. Liu, A. H. Kitai, and P. Mascher, point defects and luminescence centers in zinc oxide and zinc oxide doped with manganese, Journal of Luminescence. 54(1992)35. 27) X. Yang, G. Du, X. Wang, J. Wang, B. Liu, Y. Zhang, D. Liu, D. Liu,H. C. Ong, and S. Yang, Effect of post-thermal annealing on properties of ZnO thin film grown on c-Al2O3 by metal-organic chemical vapor deposition, Journal of Crystal Growth 252(2003) 275. 28) J. Zhong, A. H. Kitai, P. Mascher, and W. Puff, The Influence of Processing Conditions on Point Defects and Luminescence Centers in ZnO, Journal of Electrochemical Society. 140(1993)3644.
- 41 -
Chapter One
Theoretical Background
29) K. Johnston, M. O. Henry, D. M. Cabe, T. Agne, and T. Wichert, Proceedings of the Second Workshop on “SOXESS European Network on ZnO, 27-30 October 2004, Caernarfon, Wales, UK. 30) Q. X. Zhao, P. Klason, M. Willander, Deep-level emissions influenced by O and Zn implantations in ZnO Applied Physics Letters. 87(2005) 211912. 31) P. Klason, T. M. Børseth, Q. X. Zhao, Temperature dependence and decay times of zinc and oxygen vacancy related photoluminescence bands in zinc oxide, Solid State Communication 145(2008)321. 32) B.J. Jin, S.H. Bae, S.Y. Lee, S. Im, Effects of native defects on optical and electrical properties of ZnO prepared by pulsed laser deposition. Materials Science and Engineering B, 71(2000)301. 33) R. Eason, Pulsed laser Deposition of thin films Applications-led growth of functional materials, John Wiley & Sons, 2007. 34) C. Phipps, Laser Ablation and its Application, New Maxico Springer 2007. 35) M. N. R. Ashfold, F. Claeyssens, G. M. Fuge and S. J. Henley, Pulsed Laser Ablation and Deposition of Thin Films, School of Chemistry, University of Bristol 2004. 36) J. Shen, Z. Gai, J. Kirschner, Growth and Magnetism of Metallic Thin Films and Multilayer’s by Pulsed-Laser Deposition, Surface Science. 52(2004)163. 37) B. Annemie, Ch. Zhaoyang, G. Renaat, V. Akos, Laser Ablation for Analytical Sampling: What can we learn from Modeling? Spectrochimica Acta Part B. 58 (2003)1867. 38) R. K. Singh and J. Narayan, A Novel Method for Simulating Laser Solid Interactions in Semiconductors and Layered Structures, Materials Science and Engineering B. 3(1989)217. 39) R. Kelly and A. Miotello, Contribution of Vaporization and Boiling to Thermal-Spike Sputtering by Ions or Laser Pulses, Physical Review 3(1999)2616.
- 42 -
Chapter One
Theoretical Background
40) A. Miotello and R. Kelly, Critical Assessment of Thermal Models for Laser Sputtering at High Fluence, Applied Physics Letters. 11(1995)3535. 41) V. Oliveira, R. Cola¸ R. Vilar, Simulation of KrF Laser Ablation of Al2o3– TiC, Applied Surface Science, 253 (2007)7585. 42) V. Oliveira, R. Vilar, Finite Element Simulation of Pulsed Laser Ablation of Titanium Carbide, Applied Surface Science 253 (2007)7810. 43) S. S. Harilal, C. V. Bindhu, V. P. N. Nampoori, and C. P. G. Vallabhan, Influence of ambient gas on the temperature and density of laser produced carbon plasma, Applied Physics Letters. 72(1998)167. 44) G. Ferrante, M. Zarcone, Inverse Bremsstrahlung in Plasma with Electron Temperature Anisotropy, Physics of Plasmas 11 (2001) 4745. 45) M. Guillermin, C. Liebig, F. Garrelie, R. Stoian, A.S. Loir, E. Audouard, Adaptive Control of Femtosecond Laser Ablation Plasma Emission, Applied Surface Science. 255 (2009)5163. 46) K. S. Rajiv and J. Narayan, Pulsed-Laser Evaporation Technique for Deposition of Thin Films Physics and Theoretical Model, Physical Review. 13(1999)8843. 47) J. R. Ho and C. P. Grigoropoulos, J. A. C. Humphrey, Gas Dynamics and Radiation Heat Transfer in the Vapor Plume Produced by Pulsed Laser Irradiation of Aluminum, Journal of Applied Physics, 9 (1996)7205. 48) J. C. S. Kook, T. S. Bailer, S. T. De Zwart, and J. Dielemana, Gas Flow Dynamics in Laser Ablation Deposition, Journal of Applied Physics. 9 (1992)4547. 49) S.I. Anismov, D.Bauerle, B.S. Luk’yanchuk, Gas Dynamics and Film Profiles in Pulsed–Laser Deposition of Materials, Physical Review. 16(1993)12076. 50) G. Ausanio, A. C. Barone, V. Iannotti, and L. Lanotte, S. Amoruso, R. Bruzzese, and M. Vitiello, Magnetic and Morphological Characteristics of
- 43 -
Chapter One
Theoretical Background
Nickel Nano Particles Films Produced by Femtosecond Laser Ablation, Applied Physics Letters. 18(2004)4103. 51) M. D. Fred, C.H. Scott, L. S. David, Laser Beam Shaping Applications, Taylor and Francis 2006. 52) G. Koster, Guus J. H. M. Rijnders, Dave H. A. Blank, and Horst Rogalla, Imposed Layer-by-Layer Growth by Pulsed Laser Interval Deposition, Applied Physics Letters. 24(1999)3729. 53) T. Birgitte, Deposition of ITO and AZO Thin Films by Laser Ablation at 355 nm in a Background Atmosphere, PhD Thesis Risø National Laboratory, oskilde, 2000. 54) M. Conor, Padraig Hough, C. John, P. M. Jean, Particle Diagnostics of A ZnO Laser Ablation Plume for Nanostructured Material Deposition, Applied Surface Science.255(2009)5338. 55) S. Alessia, Pulsed Laser Deposition of Complex Transition Metal Oxides Plume Expansion and Film Growth, PhD Thesis (2008). 56) B. S. Li, Y. C. Liu, Z. S. Chu, D. Z. Shen, Y. M. Lu, J. Y. Zhang and X. W. Fan, High quality ZnO thin films grown by plasma enhanced chemical vapor deposition. Journal of Applied Physics, 91(2002)501. 57) K.T. Chen, Mechanisms affecting kinetic energies of laser‐ablated materials. In The 42nd national symposium of the American Vacuum Society. 1996. Mineapolis, Minnesota (USA): AVS. 58) OHRING, M., Materials scinece of thin films. 1991. 59) C. Belouet, Thin film growth by the pulsed laser assisted deposition technique. Applied Surface Science, 96(1996)630. 60) T.J. Jackson and S.B. Palmer, Oxide superconductor and magnetic metal thin film deposition by pulsed laser ablation. Journal of Physics D: Applied Physics,27(1994)1581. 61) A.Y. Cho, Film Deposition by Molecular‐Beam Techniques. Journal of Vacuum Science and Technology, 8(1971)31. - 44 -
Chapter One
Theoretical Background
62) Y. Alivov, M. Chukichev, and V. Nikitenko, Green luminescence band of zinc oxide films copper‐doped by thermal diffusion. Semiconductors, 38(2004)31. 63) Y.Z.
Yoo, Y.
Osaka, T.
Fukumura, Zhengwu
Jin, M.
Kawasaki, H.
Koinuma, T. Chikyow, P. Ahmet, A. Setoguchi and S. F. Chichibu, High temperature growth of ZnS films on bare Si and transformation of ZnS to ZnO by thermal oxidation. Applied Physics Letters, 78(2001)616. 64) J.H. Lee and B.O. Park, Transparent conducting ZnO:Al, In and Sn thin films deposited by the sol‐gel method. Thin Solid Films, 426(2003)94. 65) SatoshiMasuda, KenKitamura, YoshihiroOkumura, ShigehiroMiyatake,Hito shi Tabata and Tomoji Kawai, Transparent thin film transistors using ZnO as an active channel layer and their electrical properties. Journal of Applied Physics, 93(2003)1624. 66) Xiao. RF ,Liao. HB ,Cue. N ,Sun. XW ,Kwok. HS, Growth of c‐axis oriented gallium nitride thin films on an amorphous substrate by the liquid‐target pulsed laser deposition technique. Journal of Applied Physics, 80(1996) 4226. 67) Huang, Y.Cue, Characterizations of gallium‐doped ZnO films on glass substrate prepared by atmospheric pressure metal‐organic chemical vapor deposition. Thin Solid Films, 517(2009)5537.
- 45 -
Chapter Tw0
Literature Review and Aim of The work
2.1 Literature Review: The efforts toward using Lasers in depositing thin films started soon after the invention of reliable high power lasers. Early observations of the ease with which the material could be vaporized by the intense interaction of high power laser pulses with material surface demonstrated that the intense laser radiation could be successfully used to deposit thin films of that material. Despite an early successful demonstration of efficacy of the PLD, initial development was rather slow and even stagnant until 1980s. During this period, the deposition of semiconductor thin films was carried out using PLD only with limited success. The PLD of III-V semiconductors were mostly unsuccessful due to nonstoichiometric deposition probably owing to the high vapor pressure of constituents which resulted in the deficiency of group V elements in the grown structures. The year 1990s brought rapid development of laser technology, which made PLD more competitive. Then PLD was extensively used to fabricate crystalline films of superconducting, ferroelectric, ferromagnetic oxides with epitaxial quality and their multilayer structures. In [1995], Craciun, et. al, studied the transparent, electrically conductive and c-axis oriented ZnO thin films on silicon and glass substrates employing either a KrF Excimer laser (λ= 248 nm) or a frequency doubled Nd:YAG laser (λ= 532 nm). The quality of the ZnO layers grown by the shorter wavelength laser was always better than that of the layers grown by the longer wavelength [1]. In [1997], epitaxial thin films of ZnO were being grown by Bagnall, et. al. using plasma-assisted MBE at Room temperature optically pumped lasing. The lasing threshold was reported to be 240 kW/cm2 for 300 nm films, pumped by a Q-switched Nd: YAG laser (10 Hz, 6 ns FWHM) [2]. In [2000], Jin, et. al, deposited ZnO thin films on sapphire by using Nd: YAG pulsed laser (λ=355nm, 5 Hz) with the laser energy density of 2.5 J/cm2 at a substrate temperature of 400°C. It was concluded that the UV luminescence - 46 -
Chapter Tw0
Literature Review and Aim of The work
intensity depends strongly on the stoichiometry in the ZnO film rather than the micro-structural quality of the crystal [3]. In [2000], ZnO films were grown on (0001) sapphire substrate by Bae, et.al. The laser energy density was 2.5 J/cm2. Pulsed Nd: YAG laser with a wavelength of 355 nm and a repetition rate of 5 Hz was used. Strong UV luminescence was obtained by increasing the substrate temperatures of ZnO films. This study suggests the possibility of using ZnO thin films in light emission device applications [4]. In [2001], ZnO films were deposited by Jin, et. al, on sapphire substrates by using an Nd: YAG pulsed laser (λ=355 nm, 5 Hz) with the laser energy density of 2.5 J/cm2, at substrate temperatures of 4000C.The PL intensity of ultra-violet (UV) luminescence and the electrical resistivity generally increase as the oxygen pressure for the PLD of ZnO increases. The best quality with the minimum intensity ratio (defect related/ UV) is obtained from the ZnO sample [5]. In [2002] a series of ZnO films with various thicknesses were prepared by Park, et. al. on (0001) sapphire substrate by pulsed laser deposition (PLD) and Using a Nd: YAG pulsed laser with a wavelength of 355 nm. The laser repetition rate and energy density were maintained at 5 Hz and 2.5 J/cm2, respectively. It is found that the crystalline quality, electrical and optical properties of the films strongly depend on the film thickness. It was believed that the films thicker than 400 nm were almost strain-free and exhibit the near-bulk ZnO properties [6]. Kaidashev, et.al. [2003], studied the high electron mobility of A multistep pulsed-laser deposition (PLD). Process was presented for epitaxial, ZnO thin films on c-plane sapphire substrates. They obtained high electron motilities in a narrow carrier concentration range. The samples showed flat surface structure with grain size of about (0.5–1) μm, whereas the surfaces of low-mobility films consist of clearly resolved hexagonally faceted columnar grains of only (200nm) size [7]. In [2003], Barik, et.al, deposited ZnO QDs embedded in Al2O3 matrix at room temperature. Third harmonic of Q-Switched Nd:YAG laser (355 nm, 6 ns, and - 47 -
Chapter Tw0
Literature Review and Aim of The work
10 Hz) with a fluence of 4 J/cm2 have successfully grown a multilayer of alumina capped ZnO QDs using PLD and observed conspicuous size dependent blue shift in the band gap of such a QD matrix [8]. In [2004], Shan, et. al, prepared ZnO films on different substrate at different temperatures by using KrF Excimer laser (λ =248nm, =25ns) at about 1 J/cm2 laser density. They found that all films showed (002) orientation at the optimized conditions. Photoluminescence (PL) results indicate that the thin films fabricated at the optimized conditions show the intense near band PL emissions [9]. In [2004], Sans, et. al. reported on the structural features and optical properties of wurtzite ZnO films epitaxial grown on sapphire, fluorite and mica substrates by means of pulsed laser deposition (PLD). Low cost mica substrates have been shown to be suitable to obtain ZnO thin films with optical and structural qualities suitable for optoelectronic applications [10]. Suchea, et. al. [2005], prepared Zinc oxide transparent thin films (ZnO) with different thickness by dc magnetron sputtering and pulsed laser deposition (PLD) techniques using metallic and ceramic targets onto silicon and Corning glass substrates using XeCl Excimer Laser 308 nm wavelength. This work indicated that the film surface characteristics were strongly influenced by the deposition technique and conditions applied, thus providing a tool for the enhancement of the film sensing capabilities [11]. In [2005], Lorenz, et. al. studied the effect of N2, N2O and O2 background gas on ZnO thin films grown by pulsed laser deposition (PLD) on α-plane sapphire. Films with rough surface showed a broadening and splitting of the roomtemperature PL peak into maxima at 3.21 and 3.26 eV, which could be due to either grain morphology or spatial variation of the electronic defect structure [12]. In [2006], S. Cho, observed the effect of substrate temperature on the structure and the exciton life time of ZnO films. The surface roughness generally increases as the substrate temperature increases. The lifetime for the ZnO film deposited at 400oC is found to be 168 ps [13]. - 48 -
Chapter Tw0
Literature Review and Aim of The work
In [2006], Zhao, et.al. studied ZnO thin films with c-axis (002) orientation growth on quartz glass substrate. High-quality ZnO films was obtained at such low temperature (100–250)°C. The ZnO films obtained at different substrate temperatures have nano-crystalline structure with grain size in the range of about 30-45 nm. The as-deposited films showed ultraviolet emission and accompanied deep-level emission in PL spectra. However, the ZnO film deposited at substrate temperature 200oC exhibited strong UV emission with no deep- level emission due to its low intrinsic defects [14]. In [2007], Yamaguchi, et.al. fabricated ZnO films by PLD method with bias voltage to decrease defects in ZnO. The bias voltages of (-500 and +500)V were applied between the grid over substrate and the target to control the potential difference between the plume and the target. ZnO films were grown on Al2O3 substrates at substrate temperatures 20 and 700oC. However, applying bias voltage of -500V deteriorated the film surface condition and increased the density of defects [15]. In [2007], Novotny, et. al. found that the resistivity and carrier concentrations of ZnO thin films grown by pulsed laser deposition in the presence of active ionic or neutral nitrogen species, generated in an electron cyclotron resonance N2 plasma source, were measured as a function of the source microwave power and substrate temperature. Most of the thin films were n-type, although in conditions leading to increased activation of the ionic nitrogen species, p-type behavior was observed [16]. In [2008], ZnO thin films were deposited on sapphire (001) and Si (100) substrates at 5000C by pulsed laser deposition. The ZnO film grown on sapphire had a smoother surface and smaller grain size, and exhibited a sharper X-ray diffraction peak with a smaller full width at half maximum compared to those on Si [17]. In [2008], Sui, et. al, deposited ZnO films on c-plane (0001) sapphire substrate at 250 °C. It is observed that the band gap energy red shifts nonlinearly from - 49 -
Chapter Tw0
Literature Review and Aim of The work
3.345 to 3.153 eV with increasing temperature. These properties are highly advantageous for the design and fabrication of ZnO based fiber-optic temperature sensors, especially in the biological measurement [18]. In [2008], Kang, et. al. studied the relationship between the ultraviolet emission and electron concentration of ZnO thin films were deposited on (0001) Al2O3 substrates. And they found that the variation of electron concentration of pure ZnO is more related to that of UV emission intensity than that of visible emission intensity. It is because that free-electron-neutral acceptor transition as origin of UV emission at room temperature is related to impurity concentration of pure ZnO [19]. In [2009], Wei and Zhang, obtained Zinc oxide thin films in O2 ambient at a pressure of 1.3 Pa by pulsed laser deposition (PLD) using ZnO powder target and ceramic target. The effect of temperature on structural and optical properties of ZnO thin films was investigated systematically by XRD, SEM, FTIR and PL spectra .The results show that the best structural and optical properties can be achieved for ZnO thin film fabricated at 7000C using powder target and at 400oC using ceramic target, respectively. The PL spectrum reveals that the efficiency of UV emission of ZnO thin film fabricated by using powder target is low, and the defect emission of ZnO thin film derived from Zni and Oi is high [20]. In [2009], Zhaoyang, and Lizhong studied the effect of oxygen pressure on the structural and optical properties of ZnO thin films deposited on Si (111) by using KrF Excimer laser was operated at wavelength of 248 nm and repetition rate 5Hz. The laser energy density was about 2.5 J/cm2. They found that the increasing of oxygen pressure from 1 Pa to 50 Pa contributed to the size of ZnO grains and then promote the UV emission of the films [21]. In [2009], Premkumar, et. al. deposited ZnO films on GaN and Sapphire substrate by PLD by using three different laser wavelengths Nd:YAG (1064nm, 532nm) and KrF(248nm). They found that the films grown at λ=532nm revealed
- 50 -
Chapter Tw0
Literature Review and Aim of The work
the presence of ZnO nanorods and microrods. With diameter various from 250nm to 2μm and the length various between the 9 and 22μm [22]. In [2009], Yu, et. al. studied the relationship between the photoluminescence and conductivity of undoped ZnO films grown on glass substrate with various oxygen pressures. The intensity of the deep-level-emission (DLE) and conductivity generally increased as the oxygen pressure decreased. The intensity of DLE peak was generally proportional to the conductivity. The band gap energy values, determined from transmittance spectra, were around 3.30–3.34 eV, and decreased when the oxygen pressure increased [23]. In [2010], S. Venkatachalam, et. al. studied the effect of the laser energy density on the structure and optical properties of ZnO films deposited on glass substrate by using PLD system, they found that the particle size and the optical band gap increases with an increase in laser energy density [24]. In [2011], M.G. Tsoutsouvab, et. al. studied the influence of the laser energy density on the structure, electrical and optical properties of ZnO films deposited on soda lime glass substrate by using PLD system, they found that the particle size, resistivity and the optical band gap increases with an increase in laser energy density [25]. In [2012], D. Padilla-Rueda, et. al, fabricated ZnO films deposited on glass substrate by using PLD system at room temperature, they found that the Films exhibit excellent morphological and optical properties and have been evaluated as fluorescence sensors for NO2 in the concentration range between 26 and 200 ppm [26]. In [2013], Arun Aravind, et. al. prepared highly c-axis oriented ZnO thin films by pulsed laser deposition (PLD) technique on quartz, silicon (1 0 0) and Al2O3 substrates using KrF excimer laser (λ=248 nm) and Q-switched fourth harmonic Nd:YAG laser (λ=266 nm).They observed that, the band gap of ZnO thin films varies with increase of substrate temperature despite of the
- 51 -
Chapter Tw0
Literature Review and Aim of The work
ablation wavelength, Strong UV-PL emission without any deep level emissions confirms the growth of stoichiometric and crystalline ZnO thin films [27]. In [2013], K. Siraj, et. al. they dealed with the formation of nanostructures and tuning of optical band gap of ZnO thin films by high energy electron bombardment. In first step, ZnO thin films were deposited on silicon (1 0 0) substrates by pulsed laser deposition (PLD) technique using KrF Excimer laser. In second step, ZnO thin films were irradiated by electron beam of energy 6, 9, 12 and 15 MeV at constant dose. The surface morphology was studied by Atomic Force Microscope (AFM), whereas the optical properties were determined by Spectroscopic Ellipsometry (SE). Atomic force micrographs showed the formation of nanoscale structures on the surface of ZnO thin film. The nanostructures grew in size and reached its maximum size at 12 MeV electron energy. SE analysis revealed the increase in refractive index, appearance of broad absorption peak in visible region, and increase in optical band gap energy of ZnO thin film by 12 MeV electron bombardment. From the results, it can be concluded that the size of nanostructures and the optical band gap energy of ZnO thin films can be tuned by electron irradiation at various energies [28]. In [2013], O. Melikhova, et. al. fabricated ZnO films with thickness of 80 nm that grown by pulsed laser deposition (PLD) on MgO (1 0 0) single crystal and amorphous fused silica (FS) substrates. Structural studies of ZnO films and a high quality reference ZnO single crystal were performed by slow positron implantation spectroscopy (SPIS). They were found that ZnO films exhibit significantly higher density of defects than the reference ZnO crystal. Moreover, the ZnO film deposited on MgO substrate exhibits higher concentration of defects than the film deposited on amorphous FS substrate most probably due to a dense network of misfit dislocations. The ZnO films and the reference
ZnO
crystal
were
subsequently
loaded
with
hydrogen
by
electrochemical cathodic charging. SPIS characterizations revealed that absorbed hydrogen introduces new defects into ZnO [29]. - 52 -
Chapter Tw0
Literature Review and Aim of The work
In [2013], H. Xiong, et. al. prepared ZnO films with high crystal quality were grown by pulsed laser deposition (PLD) on different c-plane AlN/c-sapphire template thereby the thicknesses of AlN buffer layers varied from 150 to 300 nm. The comparative investigation results show that inserting an AlN buffer layer is an effective way to improve the crystal quality of ZnO films. Furthermore, the thickness of the AlN buffer layer plays an important role on the quality of ZnO films [30]. In [2013], S.H. Huang, et. al. compared the crystalline structures, optical properties, and surface morphologies of ZnO thin films deposited on silicon and glass substrates by conventional pulsed laser deposition (PLD) and radiofrequency (RF) plasma-enhanced PLD (RF-PEPLD). The depositions were performed at room temperature under 30-100 mTorr pressure conditions. The RF-PEPLD process was found to have deposited a ZnO structure with preferred (0 0 2) c-axis orientation at a higher deposition rate. However, the RFPEPLD process generated more defects in the thin films [31]. In [2013], M. Mosca, et. al, fabricated ZnO epitaxial growth by pulsed laser deposition (PLD) on different substrates, such as quartz, sapphire, and GaN template. Approximately 1 μm-thick films were grown under different substrate temperatures and background oxygen conditions. X-ray diffraction analysis indicated preferential growth along the c-axis direction with a full-width at half maximum (FWHM) of the rocking curve as narrow as 230 arcs in the case of the GaN template. Low temperature photoluminescence showed A-excitonic emission near 3.36 eV and a FWHM of D0XA emission as small as 2.89 meV at 9 K. Atomic force microscope measurements showed that roughness as low as 18 nm could be obtained [32]. In [2013], S.S. Xiao, et. al. fabricated nanocrystalline ZnO films by pulse laser deposition. As the film's grain size decreases to small nanosize (20 nm), the film exhibits unique optical properties. The photoluminescence spectrum has three broad emissions located across ultraviolet-violet, yellow-green-orange and red - 53 -
Chapter Tw0
Literature Review and Aim of The work
regions. The results indicate that the nanocrystalline ZnO film with small nanosize has degenerated crystalline quality and various structured defects. These abnormal optical properties were attributed to the abundant structural defects and the quantum confinement effect of the nanocrystalline ZnO films [33]. In [2014], R. Vinodkumar, studied the influence of the substrate temperature on the structure, electrical and optical properties of ZnO films deposited on quartz substrate by using PLD system, they found that the dc electrical resistivity and the optical band gap decreases with an increase in the substrate temperature [34]. In [2014], Raied K. Jamal, et. al, prepared Zinc oxide thin film of 2 μm thickness glass substrate by a pulsed laser deposition technique at substrate temperature of 500 °C under the vacuum pressure of 8×10⁻² mbar. The optical properties concerning the absorption and transmission spectra were studied for the prepared thin film. From the transmission spectra, the optical gap and linear refractive index of the ZnO thin film were determined. The structure of the ZnO thin film was tested with X-Ray diffraction and it was found to be a polycrystalline [35]. In [2014], Vijayalakshmy and Subramanian, fabricated Zinc Oxide (ZnO) block layers of 300 and 600 nm thicknesses by Pulsed Laser Deposition (PLD) onto FTO coated glass substrates at substrate temperature of 400 °C. X-ray diffraction (XRD) analysis indicates that they are polycrystalline in nature and have hexagonal structure. The surface morphological studies by FESEM, reveal the uniform surface coverage of the grains on the surface of the films. Optical transmittance of 90% in the visible light region with the band gap value of 3.35 eV is measured. Mesoporous ZnO layers with thickness of about 9.8 μm prepared by a chemical method are applied onto the laser ablated ZnO blocking layer and this stack is used as the photoanode of dye sensitized solar cells (DSSCs). The formation of ZnO nanorods is observed in TEM image. Platinum thin films of 100 nm are electron beam evaporated on FTO coated glass substrates which are used as counter electrodes. The performance of the cell with a V oc of - 54 -
Chapter Tw0
Literature Review and Aim of The work
0.551 V, a Jsc of 6.96 mA cm−2, a fill factor of 0.76 and an efficiency of 3.02% is obtained. It is noticed that the conversion efficiency of the DSSCs is affected by the thickness of the passivating layer [36]. In [2014], El Zein, et. al. investigated the successful synthesis of catalyst free zinc oxide (ZnO) Nanowall networks with honeycomb like structure by Pulsed Laser Deposition (PLD). The synthesis was conducted directly on Silicon (Si) (1 0 0) and Glass–ITO substrates without the intermediate of metal catalyst, template or chemical etching. Kinetic of growth and effects of gas pressure and substrate temperature were studied by depositing ZnO films on P-type Si (1 0 0) substrates with different deposition parameters. The optimized growth parameters were found as: 10 mTorr oxygen pressure, 600 °C substrate temperature, and deposition duration equal or higher than 10 min. X-Ray Diffraction (XRD), Scanning
Electron
Microscopy
(SEM)
and
Photoluminescence
(PL)
measurements were used to investigate structural, microstructural and optical properties of ZnO Nanowall networks produced. They exhibit a non-uniform size high quality honeycomb structure with low deep level defects [37]. In [2014], Rafik Serhane, et. al. Investigated the piezoelectric properties of ZnO thin films for micro-electro-mechanical systems (MEMS). Wurtzite ZnO structure was prepared on different substrates (Si (1 0 0), Pt (1 1 1)/Ti/SiO2/Si and Al (1 1 1)/SiO2/Si) at different substrate temperatures (from 100 to 500 °C) by a pulsed
laser
deposition
(PLD)
technique.
X-ray
diffraction
(XRD)
characterization showed that the ZnO films were highly c-axis (0 0 2) oriented, which is of interest for various piezoelectric applications. Scanning electron microscopy (SEM) showed evidence of honeycomb-like structure on the surface and columnar structure on the cross-section. In the case of ZnO on Al, ZnO exhibited an amorphous phase at the ZnO/Al interface. The XRD measurements indicated that the substrate temperature of 300 °C was the optimum condition to obtain high quality (strongest (0 0 2) peak with the biggest associated grain size) of crystalline ZnO on Pt and on Al and that 400 °C was the optimum one on Si. - 55 -
Chapter Tw0
Literature Review and Aim of The work
ZnO on Al exhibits smallest rocking curve width than on Pt, leading to better crystalline quality. The ZnO films were used in bulk acoustic wave (BAW) transducer. Electrical measurements of the input impedance and S -Parameters showed evidence of piezoelectric response. The electromechanical coupling coefficient was evaluated as K2eff =5.09% with a quality factor Qr = 1001.4 [38]. In [2014], Y.M. Lu, et. al. investigated the photoluminescence(PL) of ZnO thin films prepared on c-Al2O3 substrates by the pulsed laser deposition (PLD) method at different O2 partial pressures. For all samples, a narrow ultraviolet (UV) emission and abroad visible emission can be observed at room-temperature (RT). With increasing O2 partial pressures from 0.2 to 5 Pa, the intensity ratio of the UV to visible emissions increases, and the energy positions of the UV emission band shift to the high energy side. It is noted that the visible part includes two emission bands of green luminescence (GL) and yellow luminescence (YL), in which the GL emission is strong at low oxygen pressure and the YL emission becomes dominant at high O2 partial pressures [39]. 2.2 Aim of The work: The aim of this work was to design and construct pulsed laser deposition (PLD) system then study some physical properties of ZnO nanocrystalline films that were prepared by this technique using ZnO nanoparticles as a target that prepared by microwave method. Initially, the series of samples have been prepared by PLD technique at room temperature on glass substrates and then the deposited ZnO thin films and ZnO nanoparticles were annealed in air at different temperatures 300, 350, 400, 450 and 5000C for 2h. The annealing process supposed to result in the different structural of the nanostructures to be obtained. Also the optical and electrical properties of ZnO thin films and ZnO nanoparticles are known to be sensitive for its structural quality. The main objectives in this work are: - 56 -
Chapter Tw0
Literature Review and Aim of The work
Characterization of structural, electrical and optical properties of obtained annealed ZnO thin films and ZnO nanoparticles. Correlation between structural, electrical and optical properties of obtained annealed ZnO thin films and ZnO nanoparticles. 2.3 References: 1) V. Craciun, S. Amirhaghi, D. Craciun, J. Elders, J.G. E. Gradeniers, Ian. W. Boyd, Effect of laser wavelength and fluence on the growth of ZnO thin films by Pulsed laser deposition, Applied Surface Science. 86(1995)99. 2) Bagnall DM, Chen YF, Zhu Z, Yao T, Koyama S, Shen MY, and T. Goto, Optically Pumped Lasing of ZnO at Room Temperature, Applied Physics Letters. 17(1997)2230. 3) B. J. Jin, S. H. Bae, S. Y. Lee, S. Im, Effect of Native Defects on Optical and Electrical Properties of ZnO Prepared by Pulsed Laser Deposition, Material Science and Engineering B, 71(2000)301. 4) S. H. Bae, S. Y. Lee, B. J. Jin and S. Im, Pulsed Laser Deposition of ZnO Thin Films for Applications of Light Emission, Applied Surface Science. 154(2000)458. 5) B. J. Jin, H. S. Woo, S. Im, S. H. Bae, S. Y. Lee, Relationship Between Photoluminescence and Electrical Properties of ZnO Thin Films Grown by Pulsed Laser Deposition, Applied Surface Science. 169(2001)521. 6) M. C. Park, W. H. Yoon, D. H. Lee, J. M. Myoung, S. H. Bae, S. Y.Lee and I. Yun, Effect of Misfit Strain on Properties of ZnO Films Grown by Pulsed Laser Deposition, Material Research Society. 696(2002)1. 7) E. M. Kaidashev, M. Lorenz, H. Von Wenckstern, A. Rahm, H. C. Semmelhack, High Electron Mobility of Epitaxial ZnO Thin Films on cPlane Sapphire Grown by Multistep Pulsed – Laser Deposition, Applied Physics Letters. 22 (2003)3901.
- 57 -
Chapter Tw0
Literature Review and Aim of The work
8) S. Barik, A. K. Srivastava, P. Misra, R. V. Nandedkar, L. M. Kukreja, Alumina Capped ZnO Quantum Dots Multilayer Grown by Pulsed Laser Deposition, Solid State Communication. 127 (2003)463. 9) F. K. Shan, B. C. Shin, S.W. Jang, Y. S. Yu, Substrate Effect of ZnO Thin Films Prepared by PLD Technique, Journal of the European Ceramic Society 24 (2004)1015. 10) J. A. Sans, A. Segura, M. Mollar, B. Mari, Optical Properties of Thin Films of ZnO Prepared by Pulsed Laser Deposition, Thin Solid Films, 453(2004)251. 11) M. Suchea, S. Christoulakis, M. Katharakis, N. Katsarakis and G. Kiriakidis, Surface Characterization of ZnO Transparent Thin Films, Journal of Physics Conference Series, 10 (2005)147. 12) M. Lorenz, H. Hochmuth, J. Lenzner, T. Nobis, G. Zimmermenn, M. Diaconu, H. Schmidt, H. V. Wenckstern, M. Grundmann, Room Temperature Cathodoluminescence of n-Type ZnO Thin Films Grown by Pulsed Laser Deposition In N2, N2O and O2 Background Gas, Thin Solid Films 486(2005)205. 13) S. Cho, Structural and Optical Properties of ZnO Films Grown on Sapphire Substrates Subjected to Substrate Temperature, Journal of the Korean Physics Society, 3 (2006)985. 14) L. Zhao, J. Lian, Y. Liu, Q. Jian, Structural and Optical Properties of ZnO Thin Films Deposited on Quartz Glass by Pulsed Laser Deposition, Applied Surface Science. 252 (2006)8451. 15) H. Yamaguchi, T. Komiyama, M. Yamada, K. Sato, T. Aoyama, Fabricated of ZnO Films by PLD Method with Bias Voltage, Physica B 401(2007)391. 16) M. Novotny, J. R. Duclere, E. McGlynn, M. O. Henry, R. O’Haire and J. P. Mosnier, Nitrogen Doping of ZnO Thin Films Grown by Plasma- Assisted Pulsed Laser Deposition, Journal of Physics Conference series 59(2007)505.
- 58 -
Chapter Tw0
Literature Review and Aim of The work
17) L. Han, F. Mei, C. Liu, C. Pedro, E. Alves, Comparison of ZnO Thin Films Grown by Pulsed Laser Deposition on Sapphire and Si Substrate, Physica E 40(2008)699. 18) C. Sui, N. Chen, X. Xu, G. Wei, P. Cai, H. Zhou, High–TemperatureDependent Optical Properties of ZnO Film on Sapphire Substrate, Thin Solid Films, 516 (2008)1137 19) H. S. Kang, G. H. Kim, S. H. Lim, H. W. Chang, J. H. Kim, S. Y. Lee, Relation Between Ultraviolet Emission and Electron Concentration of ZnO Thin Films, Thin Solid Films, 516 (2008)3147. 20) X. Q. Wei, Z. Zhang, Y. X. Yu, B. Y. Man, Comparative Study on Structural and Optical Properties of ZnO Thin Films Prepared by PLD Using ZnO Powder Target and Ceramic Target, Optics & Laser Technology, 41(2009)530. 21) W. Zhaoyang, H. Lizhong, Effect of Oxygen Pressure on the Structural and Optical Properties of ZnO Thin Films on Si (111) by PLD, Vacuum, 83(2009)906. 22) T. Premkumar, P. Manoravi, B. K. Panigrahi, K. Baskar, Particulate assisted growth of ZnO nanorods and microrods by Pulsed laser deposition. Applied Surface Science. 255 (2009) 6819. 23) C.F. Yu, C.W. Sung, S. Hann, Chen, S.J. Sun, Relationship between the photoluminescence and conductivity of undoped ZnOthin films grown with various oxygen pressures, Applied Surface Science. 256(2009)792. 24) S. Venkatachalam, Yoshinori Kanno, S. Velumani, Characterization on pulsed
laser
deposited
nanocrystalline
ZnO
thin
films,
Vacuum,
84(2010)1199. 25) M.G. Tsoutsouva,C.N. Panagopoulos,M. Kompitsas, Laser energy density, structure and properties of pulsed-laser deposited zinc oxide films, Applied Surface Science 257(2011)6314.
- 59 -
Chapter Tw0
Literature Review and Aim of The work
26) D. Padilla-Rueda, J.M. Vadillo, J.J. Laserna, Room temperature pulsed laser deposited ZnO thin films as photoluminescence gas sensors, Applied Surface Science 259 (2012) 806. 27) Arun Aravind,, M.K. Jayaraj, Mukesh Kumar, Ramesh Chandra, The dependence of structural and optical properties of PLD grown ZnO films on ablation parameters, Applied Surface Science 286( 2013) 54. 28) K. Siraj ,Kashif Javaid, J.D. Pedarnig, M.A. Bodea, S. Naseem, Electron beam induced nanostructures and band gap tuning of ZnO thin films, Journal of Alloys and Compounds, 563( 2013)280. 29) O. Melikhova, J. Čížek, F. Lukáč,M. Vlček, M. Novotný, J. Bulíř, W. Anwand,G. Brauer, J. Connolly, E. McCarthy, J.P. Mosnier, Hydrogen absorption in thin ZnO films prepared by pulsed laser deposition, Journal of Alloys and Compounds 580(2013)40. 30) H. Xiong,J.N. Dai , Xiong Hui,Y.Y. Fang, W. Tian,D.X. Fu,C.Q.Chen, Mingkai Li,Yunbin He , Effects of the AlN buffer layer thickness on the properties of ZnO films grown on c-sapphire substrate by pulsed laser deposition, Journal of Alloys and Compounds, 554(2013) 104. 31) S.H. Huang,Y.C. Chou,C.M. Chou,V.K.S. Hsiao , Room temperature radiofrequency plasma-enhanced pulsed laser deposition of ZnO thin films, Applied Surface Science, 266(2013)194. 32) M. Mosca, R. Macaluso, C. Calì, R. Butté, S. Nicolay,E.Feltin,D.maltin, N. Grandjean, Optical, structural, and morphological characterisation of epitaxial ZnO films grown by pulsed-laser deposition, Thin Solid Films, 539(2013) 55. 33) S.S. Xiao,L. Zhao, Y.H. Liu, J.S. Lian, Nanocrystalline ZnO films prepared by pulsed laser deposition and their abnormal optical properties, Applied Surface Science,283(2013) 781. 34) R. Vinodkumar , I. Navas , K. Porsezian , V. Ganesan , N.V. Unnikrishnan , V.P. Mahadevan Pillai , Structural, spectroscopic and electrical studies of nanostructured porous ZnO thin films prepared by pulsed laser deposition, - 60 -
Chapter Tw0
Literature Review and Aim of The work
Spectrochimica Acta Part A: Molecular and Biomolecular Spectroscopy, 118 (2014) 724. 35) Raied K. Jamal, Mohammed A. Hameed,Kadhim A. Adem, Optical properties of nanostructured ZnO prepared by a pulsed laser deposition technique, Materials Letters, 132(2014)31. 36) S. Vijayalakshmy, B. Subramanian, Effect of ZnO block layers fabricated by Pulsed Laser Deposition and mesoporous layers by chemical method on the performance of dye sensitized solar cells, Electrochimica Acta,137(2014) 131. 37) B. El Zein,S. Boulfrad,G.E. Jabbour, E. Dogheche, Parametric study of selfforming ZnO Nanowall network with honeycomb structure by Pulsed Laser Deposition, Applied Surface Science, 292(2014) 598. 38) Rafik Serhane, SamiraAbdelli-Messaci, Slimane Lafane, Hammouche Khales, Walid Aouimeur, Abdelkadder Hassein-Bey, Tarek Boutkedjirt, Pulsed laser deposition of piezoelectric ZnO thin films for bulk acoustic wave devices, Applied Surface Science, 288(2014) 572. 39) Y.M.Lu, X.P.Li, S.C.Su, P.J.Cao, F.Jia, S.Han, Y.X.Zeng, W.J.Liu, D.L.Zhu, The effect of O2 partial pressure on the photoluminescence of ZnO thin films grown by pulsed laser deposition, Journal of Luminescence, 152(2014)254.
- 61 -
Chapter Three
Experimental Work
3.1 Experimental Procedures: 3.1.1 Preparation of ZnO nanoparticles using microwave irradiation: All chemicals were purchased from Sigma Aldrich. In a typical procedure, 5gm zinc nitrate hexahydrate (Zn (NO3)2·6H2O) (99.99%) was dissolved into 30mL distillated water. After stirring for several minutes using magnetic stirrer, aqueous solution of 5 mole sodium hydroxide (NaOH) was slowly added to the reaction mixture. It was then stirred for 20 minutes. Finally, the mixture was put in microwave device (see Fig 3-1) for 3 minutes. The white solid product was washed with distilled water and dried in air at 80oC using programmable muffle furance (see Fig 3-2). Stirring
Zn (NO3)2+H2O+NaOH =====> Zn(OH)2+NaNO3+H2O
(3-1)
Microwave
Zn (OH)2+NaNO3+H2O ======>ZnO +H2O+ NaNO3
(3-2)
3.1.2 Preparation of ZnO thin films by using PLD system: ZnO thin films were deposited on glass substrates in a PLD system. The target was sintered high purity ZnO nanoparticles disk as mentioned above with 10 mm in diameter and 3 mm in thickness. Glass sheets which were used as the substrate for ZnO thin films deposition were cleaned in an ultrasonic bath with ethanol for 5 min before being loaded into the chamber. As shown in Fig 3-3 the substrates were placed parallel to the target surface with 3 cm distance. As shown in Fig 3-4, A Q-switched Nd:YAG laser (Surelite-SL-10) second harmonic generation with wavelength 532nm was used and operated at pulsed width of 6 ns and repetition rate of 10 Hz. The laser beam was focused through a 20 cm focal lens onto the target at a 450 angle of incidence to give high energy density. The energy density at target surface is given by the following relation: Energy density =
(3-3)
- 62 -
Chapter Three
Experimental Work
where E=18.2 mJ/pulse is the energy of laser beam, d is the diameter of focused laser beam by the convex lens. The diameter of focused laser beam by the convex lens is given by the following relation (as shown in Fig 3-5): d=2.44f λ/D
(3-4)
Where: f=0.2m is the focal lens of the convex lens. λ=532x10-9m is the wavelength of laser beam. D=2x10⁻³m is the diameter of unfocused beam. So, d=129.808 μm and yielding an energy density at target surface of approximately 137.6J/cm2. The deposition chamber was initially evacuated to 8x10⁻⁴ Pa using turbomolecular pump (EDWARDS-EXC120) and rotary pumps (EDWARDS-RV8) as shown in Fig 3-6. The deposition of ZnO thin films is done under vacuum for deposition time of 5 min and at RT. During the deposition as shown in Fig 3-7, the target is rotated clockwise at a uniform speed to avoid drilling of the target for ensuring uniform deposition of the films, the substrate is rotated anticlockwise to give good distribution in the film thickness. The prepared ZnO thin films and ZnO nanoparticles at RT were subjected inside the muffle furance to heated in air for 2 h at temperatures of 300, 350, 400 ,450 and 500 0C that denoted by Zn300, Zn350, Zn400, Zn450 and Zn500, respectively. The deposited films and the prepared nanoparticles at room temperature were denoted by ZnRT. 3.2 Characterization Techniques: 3.2.1 X-ray diffraction (XRD): Electrical and optical properties of the thin films grown are influenced by the crystallographic nature of the films. X-ray diffraction (XRD) studies were carried out to study the crystallographic properties of the thin films prepared. A given substance always produces a characteristic x-ray diffraction pattern whether that substance is present in the pure state or as one constituent of a mixture of substances. - 63 -
Chapter Three
Experimental Work
Fig 3-1: The image of microwave instrument.
Fig 3-2: The image of the programmable muffle furance.
- 64 -
Chapter Three
Experimental Work
Fig 3-3: The stainless steel chamber that used in PLD system.
Fig 3-4: The setup of PLD system.
Fig 3-5: The focusing of laser beam using convex lens.
- 65 -
Chapter Three
Experimental Work
Fig 3-6: The image of turbo- molecular pump and rotary pump.
Fig 3-7: The plume expansion of ZnO thin films.
- 66 -
Chapter Three
Experimental Work
The particular advantage of x-ray diffraction analysis is that it discloses the presence of a substance and not in terms of its constituent chemical elements. Diffraction analysis is useful whenever it is necessary to know the state of chemical combination of the elements involved or the particular phase in which they are present. Compared with ordinary chemical analysis the diffraction method has the advantage that it is much faster, requires only very small sample and is non destructive [1]. The basic law involved in the diffraction method of structural analysis is the Bragg’s law. When monochromatic x-rays impinge upon the atoms in a crystal lattice, each atom acts as a source of scattering. The crystal lattice acts as series of parallel reflecting planes. The intensity of the reflected beam at certain angles will be maximum when the path difference between two reflected waves from two different planes is an integral multiple of λ as shown in Fig 3-8. This condition is called Bragg’s law and is given by the relation: 2dSinθ = nλ
(3-5)
where n is the order of diffraction, λ is the wavelength of the x-rays, d is the spacing between consecutive parallel planes and θ is the diffraction angle [2]. From X-ray diffraction pattern we can obtain the following information: To judge formation of a particular material system. Unit cell structure, lattice parameters and miller indices. Types of phases present in the material. Estimation of crystalline/amorphous content in the sample. Evaluation of the average crystalline size from the width of the peak in a particular phase pattern. Large crystal size gives rise to sharp peaks, while the peak width increases with decreasing crystal size. An analysis of structural distortion arising as a result of variation in d-spacing caused by the strain. The average grain size (D) of the film can be calculated using the Scherer's formula [1]: (3-6) - 67 -
Chapter Three
Experimental Work
Where, λ is the wavelength of the x-ray and β is the full width at half maximum intensity in radians, θ is the diffraction angle. The lattice parameter values for different crystallographic systems can be calculated from the following equations using the (h k l) parameters and the interplanar spacing (d). Cubic system, (3-7) Tetragonal system, (3-8) Hexagonal system, (3-9) An X-ray diffraction apparatus (XPERT-PRO-PANAlytical-Nertherland) with Cu-Kα1 incident radiation at 1.54060A wavelength was used for recording the diffraction pattern of ZnO nanoparticles and Grazing incident X-ray diffraction (GIXRD) apparatus for ZnO thin films as shown in Fig 3-9. The diffraction data were recorded for 2θ between 20o and 80o with a resolution of 0.02o. 3.2.2 Scanning Electron Microscope (SEM): The scanning electron microscope (SEM) is a type of electron microscope that images the sample surface by scanning it with a high-energy beam of electrons in a raster scan pattern. The electrons interact with the atoms to make the sample producing signals that contain information about the sample's surface topography, composition and other properties such as electrical conductivity. The types of signals produced by an SEM include secondary electrons, back scattered electrons (BSE), characteristic x-rays, light (cathodoluminescence), specimen current and transmitted electrons. These types of signal all require specialized detectors for their detection that are not usually all present on a single machine. - 68 -
Chapter Three
Experimental Work
Fig 3‐8: Diffraction of X-rays by plans of atoms.
Fig 3-9: The image of X-ray diffraction instrument.
- 69 -
Chapter Three
Experimental Work
The schematic image of SEM is illustrated in Figure 3-10 in order to show how it works. The SEM uses electrons instead of light to form an image. A beam of electrons is produced at the top of the microscope by heating of a metallic filament. The electron beam follows a vertical path through the column of the microscope. It makes its way through electromagnetic lenses which focus and direct the beam down towards the sample. Once it hits the sample, other electrons such as backscattered or secondary are ejected from the sample. Detectors collect the secondary or backscattered electrons, and convert them to a signal that is sent to a viewing screen similar to the one in an ordinary television, producing an image. The SEM gives information on the morphology of the surface of the sample, which implies that is possible to determine if any growth has taken place. However, the images from the SEM are not a definitive proof that obtained nanostructures actually consists of ZnO. Even though the SEM produces 3D images they give no information regarding the exact atomic structure of the sample. The 3D images are easy to interpret and they reveal topographic features of the sample. The SEM images allow us to examine the diameter, length, shape and density of the ZnO nanostructures. To characterize the annealed ZnO thin films and ZnO nanoparticles, a Quanta 250 FEG (Field Emission Gun), FEI company, Netherlands scanning electron microscope was used in our experiments as shown in Fig 3-11. The gun voltage is 30kV. A max resolution of about 1nm can be achieved. 3.2.3 Transmission Electron Microscope: Transmission Electron Microscopy (TEM) has become a mainstay in the repertoire of characterization techniques for materials scientists. TEM’s strong cards are its high lateral spatial resolution (better than 0.2 nm “point-to-point’’ on some instruments) and its capability to provide both image and diffraction information from a single sample. In addition, the highly energetic beam of electrons used in TEM interacts with sample matter to produce characteristic radiation and particles, these signals often are measured to provide materials characterization using electronic data system(EDS), backscattered and secondary electron imaging, to name a few possible techniques. - 70 -
Chapter Three
Experimental Work
Fig 3-10: Schematic image of SEM.
Fig 3-11: The image of Scanning Electron Microscope (SEM) instrument.
- 71 -
Chapter Three
Experimental Work
In TEM (as shown in Fig 3-12), a focused electron beam is incident on a thin (less than 200 nm) sample. The signal in TEM is obtained from both undeflected and deflected electrons that penetrate the sample thickness. A series of magnetic lenses at and below the sample position are responsible for delivering the signal to a detector, usually a fluorescent screen, photographic film, or a video camera. Accompanying this signal transmission is a magnification of the spatial information in the signal by as little as 50 times to as much as a factor of 106. This remarkable magnification range is facilitated by the small wavelength of the incident electrons, and is the key to the unique capabilities associated with TEM analysis. TEM offers two methods of specimen observation, diffraction mode and image mode. In diffraction mode, an electron diffraction pattern is obtained on the fluorescent screen, originating from the sample area illuminated by the electron beam. The diffraction pattern is entirely equivalent to an X-ray diffraction pattern: a single crystal will produce a spot pattern on the screen, a poly-crystal will produce a powder or ring pattern (assuming the illuminated area includes a sufficient quantity of crystallites), and a glassy or amorphous material will produce a series of diffuse halos. The image mode produces an image of the illuminated sample area. The image can contain contrast brought about by several mechanisms: mass contrast, due to spatial separations between distinct atomic constituents, thickness contrast, due to non uniformity in sample thickness and diffraction contrast, which in the case of crystalline materials results from scattering of the incident electron wave by structural defects. Alternating between image and diffraction mode on a TEM involves nothing more than the flick of a switch. The reasons for this simplicity are buried in the intricate electron optics technology that makes the practice of TEM possible. There are a number of drawbacks to the TEM technique. Many materials require extensive sample preparation to produce a sample thin enough to be electron transparent, which makes TEM analysis a relatively time consuming process with a low throughput of samples. The structure of the sample may also be changed - 72 -
Chapter Three
Experimental Work
during the preparation process. Also the field of view is relatively small, raising the possibility that the region analyzed may not be characteristic of the whole sample. There is potential that the sample may be damaged by the electron beam, particularly in the case of biological materials. To characterize the prepared samples, Tecnai G20,FEI, Nertherland transmission electron microscope was used in our experiments as shown in Fig 3-13. The gun voltage is 200kV and the gun type is LaB6. 3.2.4 Fourier Transform Infrared spectroscopy (FTIR): Fourier Transform Infrared Spectroscopy (FTIR) much like the XRD is a useful tool in identifying a material. This technique measures the infrared intensity that passes through the substance compared to wavelength. The IR light that passes through the material interacts with the materials atomic bonds at a specific wavelength. As the light interacts with the bonds it causes then to stretch and vibrate, this interaction is what absorbs the IR light. The frequencies of vibration are determined by the molecules shape, and mass of the atoms bonded. This is why different materials interact differently with the IR light, when the IR absorption spectrum is analyzed it can show what kind of material is being looked at. The absorbance of the material is proportional to its concentration and the absorption occurs only if the type of bond between the material atoms is covalent bond. This method measures all wavelengths simultaneously by guiding the light through an interferometer. By performing the Fourier transform on the data, the results get mathematically adjusted to be identical to those of a conventional infrared spectroscopy. FTIR instruments are cheaper and faster to use than the conventional spectrometers. An FTIR is based on a Michelson interferometer, which consists of a beam splitter, a fixed mirror and a moving mirror (scanning mirror). As shown in Fig. 3-14, light from the source is separated into two parts and then recombines at the beam splitter after reflection by the two mirrors. Due to the path difference between the two beams, an interference pattern is generated. To characterize the annealed ZnO thin films and ZnO nanoparticles, Jasco-FT/IR4100typeA in the range of 400 cm−1 to 4000 cm−1 was used in our experiments as shown in Fig 3-15. - 73 -
Chapter Three
Experimental Work
Fig 3-12: Schematic image of TEM.
Fig 3-13: The image of Transmission Electron Microscope (TEM) instrument.
- 74 -
Chapter Three
Experimental Work
Fig 3-14: Schematic diagram of an FTIR.
Fig 3-15: The image of Fourier Transform Infrared spectroscopy (FTIR) instrument.
- 75 -
Chapter Three
Experimental Work
3.2.5 Transmission measurement: In optics theory [3], the transmittance is the fraction of incident light at specific wavelength that passes through a sample. As shown in Fig 3‐16, the transmittance (T) depends on the sample thickness, the absorption coefficient and the crystalline state of the sample and can be expressed as the following equation: T= I/Io
(3-10)
Where Io is the intensity of the incident light and I is the intensity of the light coming out of the sample. Ultraviolet-visible spectroscopy (UV/ VIS) involves the spectroscopy of photons in the UV-visible region. It uses light in the visible and adjacent near ultraviolet (UV) and near infrared (NIR) ranges. In this region of the electromagnetic spectrum, molecules undergo electronic transitions. The schematic image of a double–beam UV/vis spectrometer is illustrated in Figure 3-17 in order to show how it works. The light beams from tungsten lamp (UV, visible and IR) falls into a monochromator, then reach a sample, part of the beam is reflected and part of the beam is transmitted through the medium which is measured by the photomultiplier detector and recorded by the computer, and the rest of the beam will be absorbed. A double–beam PG instruments Ltd-T80+UV/vis spectrometer was used to measure the transmittance and absorption of the samples within the wavelength range (200-850nm) as shown in Fig 3-18.The background correction was taken for each scan. 3.2.6 Photoluminescence Spectroscopy: Photoluminescence (PL) is the spontaneous emission of light from a material under optical excitation. The excitation energy and intensity can be chosen to probe different excitation types and also different parts of the sample. PL analysis is nondestructive. The technique requires very little sample manipulation or environmental control. When light of sufficient energy is illuminated a material, photons are absorbed and (electronic) excitations are created. These excitations relax and emit a photon. - 76 -
Chapter Three
Experimental Work
Fig 3-16: The Schematic diagram of transmittance.
Fig 3-17: Schematic diagram of UV/Vis spectrometer.
Fig 3-18: The image of a double–beam spectrometer instrument.
- 77 -
Chapter Three
Experimental Work
The PL can be collected and analyzed to provide information about the photoexcited states. The PL spectrum reveals transition energies and the PL intensity gives a measure of the relative rates of radiative and non-radiative recombination. Variation of the PL intensity upon change of external parameters, e.g., temperature, excitation energy, power of excitation and can be used to further characterize electronic states and bands. PL investigations can be used to characterize a variety of materials parameters, which will be introduced respectively as follows: 1- Band gap determination: The most common radiative transition in semiconductors is between
states in
the conduction and valence bands and band gap of a semiconductor. Band gap determination is particularly useful when working with new compound semiconductors. 2- Impurity levels and defect detection: Radiative transitions in semiconductors also involve localized defect levels. The PL energy associated with these levels can be used to identify specific defects, and the PL intensity can be used to determine their concentration. 3- Recombination mechanisms: As discussed above, the return to equilibrium, also known as "recombination" can involve both radiative and nonradiative processes. The PL intensity and its dependence on the level of photo-excitation and temperature are directly related to the dominant recombination process. Analysis of PL helps to understand the underlying physics of the recombination mechanism. 4- Material quality: In general, nonradiative processes are associated with localized defect
levels,
whose presence is detrimental to material quality and subsequent device performance. Thus, material quality can be measured by quantifying the amount of radiative recombination. The typical PL experimental set-up is illustrated in Figure 3-19. The samples were excited using a continuous-wave (cw) laser operating, a tunable Optical - 78 -
Chapter Three
Experimental Work
Parametric Oscillator (OPO) laser system or producing pulses excitation. The luminescence was resolved with a monochromator and detected by a high sensitivity germanium detector (Edinburgh Instruments) or a Hamamatsu R550972 InP/InGaAs nitrogen-cooled photomultiplier tube. The photoluminescence (PL) measurements were performed using PerkinElmerLs55 Fluorescence spectrometer with Xenon lamp as the excitation source as shown in Fig 3-20. 3.2.7 Measurement of dc conductivity: There are two commonly used methods by which the dc electrical conductivity of solid is measured. They are i) two probe method and ii) four probe method. In the two probe method a steady potential (V) is applied across the sample in the form of a thin disk or pellet using two electrodes, the current (I) flowing through the sample is measured and the resistance (R) is given by: R = V/I
(3-11)
The dc conductivity (σdc) is then: σdc = 1/ρ= L/RA
(3-12)
Where ρ is the resistivity of the sample, L is the thickness and A is the electrode area on the sample. A ISO-TECHIDM 303 multimeter was used for the measurement of the sample resistance (see Fig 3-21). The samples in the form of pellets and a thin film were coated with conducting colloidal silver and held between the electrodes of a conductive stainless steel cell. The conductivity measurements were performed over a temperature range 30 to 200oC. 3.2.8 Measurement of ac conductivity: The ac conductivity measurements were carried out using Microtest LCR meter (6377) as shown in Fig 3-22. It is an impedance meter which uses GPIB, RS-232 interfaces. This interactive GPIB, RS-232 interfaces enables extremely easy operation. The test frequency can be set from 20Hz to 1MHz at high resolution with accuracy
0.005% or less. The instrument can directly measure 14
impedance parameters (Z, Y, C s, C p,
D, L s, L p, Q, R s, R p, G, X and B). Out - 79 -
Chapter Three
Experimental Work
of these 14 parameters 3 parameters can be displayed simultaneously. The voltage level of the signal can be varied from0.01 to 2V rms. The instrument can be used either in constant voltage mode or in constant current mode. The residual impedance and stray capacitance inherent to the test fixture and cable can be nullified by performing the short and open compensation. The ac conductivity was calculated from the measurements of the capacitance (C p) and the dielectric loss factor (D=tanδ). The dielectric constant (ε') is calculated from the measured capacitance using the relation: ε' = Cp L/ ε o A Where ε
o
(3-13)
is the permittivity of free space, L is the thickness and A is the
electrode area on the sample. The ac conductivity (σ ac) is given by the relation: σ ac = 2 п f εoε'' = 2 п f ε' tan δ
(3-14)
The measurements were carried out for different frequencies within the interval 100Hz to 1MHz and over the temperature range 30 to 200oC. For each measurement, the measuring temperature was kept constant with an accuracy of 0.5oC. The maximum temperature of measurement was intentionally limited to 200oC to avoid grain growth and to make sure that all measurements were done on samples having the same mean grain size. 3.2.9 Thickness measurement: The thickness of ZnO thin films measured by using Beer-Lambert law[3]: I=I0exp-αx
(3-15)
where I and Io are the transmitted and the incident power through the film respectively, x is the film thickness, α is the linear absorption coefficient. So, the film thickness will be: x=(α)-1ln(I0/I)
(3-16)
By using red helium neon laser with wavelength λ=632.8nm, α=0.4x10 5cm-1 at λ=632.8nm [4], Io=1mW, and measuring the transmitted power of laser beam (I) using photometer then the film thickness can be calculated. - 80 -
Chapter Three
Experimental Work
Fig 3-19: Typical experimental set-up for PL measurements.
Fig 3-20: The image of Photoluminescence Spectroscopy instrument.
- 81 -
Chapter Three
Experimental Work
Fig 3-21: Set up circuit of dc conductivity.
Fig 3-22: Set up circuit of ac conductivity.
- 82 -
Chapter Three
Experimental Work
By measuring the transmitted power of laser beam (I) at different points (8 points) for the film, the average film thickness xav will be: xav =
(3-17)
xi=(α)-1ln(I0/Ii)
(3-18)
Then, xav=25Ln(
(3-19)
The units of xav and Ii are nanometer and watt, respectively. As shown in Table 3-1, the average thickness of the annealed films at 300, 350, 400, 450 and 500 oC are 95, 73, 105, 133 and 100 nm, respectively. Table 3-1: The average thickness of annealed films. Sample.
Annealing
No
I1(mw)
I2(mw)
I3(mw)
I4(mw)
I5(mw)
I6(mw)
I7(mw)
I8(mw)
Xav(nm)
temperature(oC)
1
0.85
0.8
0.7
0.68
0.68
0.62
0.66
0.62
95
RT-300
2
0.8
0.7
0.85
0.75
0.74
0.64
0.72
0.72
73
350
3
0.9
0.72
0.62
0.5
0.58
0.64
0.8
0.7
105
400
4
0.64
0.6
0.5
0.7
0.66
0.6
0.5
0.52
133
450
5
0.72
0.9
0.5
0.62
0.78
0.64
0.6
0.5
100
500
3.3 References: 1) B.D. Cullity and S.R. Stock, Elements of X ray diffraction, Third edition, Prentice Hall, New Jersey, 2001. 2) Charles Kittel, Introduction to Solid State Physics, Seventh edn, Wiley Eastern Limited, New Delhi, 1996. 3) William D. Callister, J., Fundamentals of materials science and
engineering.
Fifth edition ed. 2000: John Wiley & Sons, Inc, New York. 4) F. YAKUPHANOGLU, S. ILICAN, M. CAGLAR, Y. CAGLAR, The determination of the optical band and optical constants of non-crystalline and crystalline ZnO thin films deposited by spray pyrolysis, Journal of optoelectronics and advanced materials, 9(2007)2180.
- 83 -
Chapter Four
Results and Discussion
4.1 Annealed ZnO Thin Films: 4.1.1 Structural properties: 4.1.1.1 Grazing incident x-ray diffraction (GIXRD): Fig 4-1 Shows the GIXRD pattern of deposited ZnO thin films at RT and annealed at different temperatures 300, 350, 400, 450 and 5000C for 2h. The diffraction peaks indicate the nanocrystalline nature (JCPDS card no.04-0150825).The XRD patterns shows that the deposited film at RT is amorphous and the annealed ZnO thin films have (002) preferred orientation peak. In addition, more peaks (100), (101),(102),(110),(103) and (112) are observed. This indicates that annealed ZnO thin films were crystallized in hexagonal phase and show preferred c-axis orientation perpendicular to the substrate surface. The average grain sizes (D) of annealed ZnO thin films were calculated according to Sherrer’s formula [1]: (4-1) Where k
1, λ=0.15406 nm is the wavelength of Cu(Kα) radiation,
is the
Bragg angle of the X-ray diffraction peak and β represents the corrected experimental full-width at half-maximum of the diffraction peak in units of radians. The average grain sizes (D) of annealed ZnO thin films are plotted as a function of the annealing temperature in Fig 4-2 and listed in Table 4-1. As the annealing temperature increases from 3000C to 4000C the grain size increases from 5.22nm to 10.61nm then decreases from 10.61nm to 6nm as the annealing temperature increases from 4000C to 5000C, this result can be explained by the two reasons: At first, annealing increases atomic mobility, enhancing the ability of atoms to find the most energetically favored sites. At second, with the increase of the annealing temperature, the densities of the crystallographic defects including dislocations, interstitials and vacancies ZnO thin films decrease rapidly. These two reasons can lead to yield the best structural property of ZnO thin films is the film annealed at 400oC [2].
- 84 -
Chapter Four
Results and Discussion
It is well known that ZnO has hexagonal unit cell with two lattice parameters (a) and (c) that can be calculated from the XRD pattern by using the following equations [3]: (4-2)
and Where
100
and
002
(4-3) are the diffraction angles of the peaks (100) and (002)
respectively and "d" is the interplanar spacing. The values of "c" and "a" parameters of annealed ZnO thin films are listed in Table 4-1. The density ( ) of annealed ZnO thin films were calculated by using the following equation: (4-4) Where n=6 is the number of atoms per unit cell, M=81.408 g/mol is the molecular weight, V=
a2c is the cell volume in cm3, Na =0.60225 x1024 mol-1 is
Avogadro's number. The density values of annealed ZnO thin films ( ) in g/cm3 are listed in Table 4-1. The position of (002) diffraction peak for annealed ZnO thin films at 300, 350, 400,450 and 5000C appear at 34.10, 34.26, 34.11,34.45 and 35.24, respectively as listed in Table 4-1. Compared with the (002) peak position of ZnO powder (2 = 34.432), the diffraction angle of films annealed at 300,350,4000C decrease in comparison with bulk ZnO, which results in the increase of interplanar spacing and c-axis values, and the decrease of the density of annealed films. This indicates that ZnO films annealed at 300,350,4000C suffer compressive stress along the interfaces between the annealed films and glass substrate. The diffraction angles of films annealed at 450 and 5000C increase in comparison with bulk ZnO, which results in the decrease of interplanar spacing and c-axis values, and the increase of the density of annealed films, thus the stress in these ZnO films becomes tensile along the interfaces between the annealed films and glass substrate [4]. This means that the stress in ZnO thin films transformed from compressive to tensile as the annealing temperature increased. - 85 -
Chapter Four
Results and Discussion
002 101 100 102
103
110
112
Zn500
Intensity(a.u)
Zn450 Zn400 Zn350 Zn300 ZnRT
20
30
40
50 2degree)
60
70
80
Fig 4-1: XRD pattern of deposited ZnO thin films at RT and annealed at different temperatures. 11
Average grain size(nm)
10 9 8 7 6 5 250
300
350 400 450 o Annealing temperature( C)
500
550
Fig 4-2: The average grain size of ZnO thin films as a function of annealing temperature. Table 4-1: Lattice parameters, Grain size and Density at different annealing temperatures. Annealing temperature (oC)
2θ002
2θ100
C(oA)
a(oA)
Density(g/cm3)
Grain size(nm)
300 350 400 450 500
34.10 34.26 34.11 34.45 35.24
31.57 31.95 31.65 31.82 31.74
5.252 5.228 5.250 5.200 5.086
3.268 3.230 3.260 3.243 3.251
5.563 5.720 5.592 5.705 5.805
5.22 7.73 10.61 6.49 6
- 86 -
Chapter Four
Results and Discussion
4.1.1.2 FTIR spectra: Fig 4-3 Shows the FTIR spectrum of deposited ZnO thin films at RT and annealed at different temperatures. The spectra contain two intense absorption bands are attributed to bending and a stretching vibrations absorption of Zn–O bond for all films. The observed absorbed band are listed in Table 4-2.The bands sited at 420, 459, 438, 421, 432 and440 cm-1 corresponds to different annealing temperatures are a typical ZnO absorption attributed to bending vibration absorption of Zn–O bond [5]. The bands observed at 471, 527, 491, 474, 466 and 475 cm-1 corresponding to different annealing temperatures are a typical ZnO absorption attributed to asymmetric stretching vibration absorption of Zn–O bond [6]. The optical phonon frequency (o) could be calculated from IR spectra by using the observed band which assigned to vibrations of the Zn–O bonds. By using the equation c o
o where c =31010 (cm/s), o is the optical phonon `
frequency (Hz), ` is the wave number (cm-1) and is the wavelength (cm).The Debye temperature
D could be calculated according to the relation
ho kBD where (h) is the Plank’s constant and (k B) is Boltzmann constant. The values of optical phonon frequency and Debye temperature D are presented in the Table 4-2. Thus, these estimated values proved to be physically reasonable. 4.1.1.3 TEM: Fig 4-4 shows the TEM image of annealed ZnO thin film at 4000C for 2h. The TEM images of ZnO film confirm that the thin films annealed at 400◦C was typical wurtzite polycrystalline nanobelts with average grain diameter about 12nm. The average grain diameter that obtained from TEM image is agree well with the estimated value from GIXRD (D=10.61nm). 4.1.2 SEM: Fig 4-5 shows the SEM image of ZnO thin film annealed at 4000C for 2h. It is observed that the surface of ZnO thin film fabricated using ZnO nanoparticles target is rough and the compact crystalline grains can be observed with different size in spherical shape.
- 87 -
Chapter Four
Results and Discussion
Transmittance(a.u)
Zn500 Zn450 Zn400 Zn350 Zn300 ZnRT
400
500
600 700 800 -1 Wavenumber(cm )
900
1000
Fig 4-3: FTIR spectrum of deposited ZnO thin films at RT and annealed at different temperatures.
Table 4-2: Absorption bands, optical phonon frequency and Debye temperature at different annealing temperatures. Annealing temperature (oC) RT 300 350 400 450 500
bending wavenumber (cm-1) 420 459 438 421 432 440
Bending optical phonon o (Hz)x1013
1.26 1.38 1.31 1.26 1.3 1.32
Bending debye temperature
D ( K) o
604.43 660.56 630.33 605.87 621.70 633.21
- 88 -
stretching wavenumber (cm-1) 471 527 491 474 466 475
stretching optical phonon o (Hz)x1013 1.41 1.58 1.47 1.42 1.4 1.43
stretching debye temperature
D ( C) o
677.83 758.42 706.61 682.14 670.63 683.58
Chapter Four
Results and Discussion
Fig 4-4: TEM image of deposited ZnO thin film annealed at 4000C for 2h.
Fig 4-5: SEM image of deposited ZnO thin film annealed at 4000C for 2h.
- 89 -
Chapter Four
Results and Discussion
4.1.3 Optical properties: Fig 4-6 shows the transmittance spectrum of deposited ZnO thin films at RT and annealed at different temperatures. The average transmittance for all the films for the wavelength range 400–800 nm is over 70% and the variation of the annealed film transmittance is due to the variation of the film thickness. The average transmittances of annealed films (crystalline films) are higher than the average transmittances of deposited film at RT (amorphous film).The absorption edge in transmittance spectra of annealed films shifts towards the higher wavelength region of the absorption edge of deposited film at RT. The blue shift in the transmittance spectra confirms that the optical band gap values of annealed films (crystalline films) are higher than the optical band gap value of deposited film at RT (amorphous film). The sharp fall of the annealed films transmittance at the absorption edge shows the crystalline of the film. The optical band gap Eg can then be obtained from the intercept of (αhυ)n vs. hυ, n=2, 3, 1/2 and 3/2. It is observed that for all the films the best straight line is obtained for n =1/2 which is expected for direct allowed transition as shown in Fig 4-7. The optical band gap increases from 2.95 eV to 3.32 eV as the deposited film at RT annealed at 500oC, and the values Eg are listed in Table 4-3. Fig 4-8 shows the optical band gap and the average grain size as a function of annealing temperature. According to quantum confinement theory, the band gap energy of a material increases with decrease in size of the quantum dot [7]. So, as the annealing temperature increases from 300oC to 400oC the average grain size increases from 5.22nm to 10.61nm and the optical band gap decreases from 3.275 eV to 3.258 eV, respectively, then the average grain size decreases from 10.61nm to 6nm and the optical band gap increases from 3.258 eV to 3.32 eV as the annealing temperature increases from 400oC to 500oC respectively. The absorption in intermediate region of absorption coefficient spectrum is due to transitions between extended states in one band and localized states in the exponential tail of the other band. By plotting ln α as a function of hυ as shown in Fig 4-9, we can calculate the band tail width Ee which is interpreted as the width of the tails of localized states in the band gap. The values of E e as a function of annealing temperature are calculated and given in Table 4-3. - 90 -
Chapter Four
Results and Discussion
100
Zn500
Transmittance(%)
Zn350
Zn400 Zn300
Zn450
80 ZnRT
60
40 400
500
600
700
800
Wavelength(nm)
Fig 4-6: Transmittance spectra of deposited ZnO thin films at RT and annealed at different temperatures.
8 Zn450
2
(hv ) (eV/cm) x10
10
7 6
ZnRT
5 Zn350
4
Zn300
3
Zn500
2
Zn400
1 0 1.5
2.0
2.5
3.0
3.5
4.0
E(eV)
Fig 4-7: Plot of (αhυ)2 vs. hυ of deposited ZnO thin films at RT and annealed at different temperatures.
- 91 -
Chapter Four
Results and Discussion
3.330
11
3.315
9
3.300
8
Eg(eV)
Average grain size(nm)
10
3.285 7 3.270 6 3.255 5 250
300
350 400 450 o Annealing temperature ( C)
500
550
Fig 4-8: The optical band gap (Eg) and the average grain size of ZnO thin films as a function of annealing temperature.
- 92 -
Chapter Four
Results and Discussion
11.5 11.0 ZnRT
10.5
Zn300
ln()
10.0
Zn450 Zn350
9.5
Zn400
9.0 Zn500
8.5 8.0 7.5 1.5
2.0
2.5
3.0
3.5
4.0
E(eV)
Fig 4-9: Urbach tail of ZnO thin films at different annealing temperatures.
Table 4-3: Optical band gap and band tail width at different annealing temperatures. Annealing temperature (oC)
Optical band gap Eg (eV)
Band tail width Ee (eV)
RT 300 350 400 450 500
2.95 3.275 3.27 3.258 3.31 3.32
2.76 0.350 0.316 0.297 0.185 0.229
- 93 -
Chapter Four
Results and Discussion
As the photon energy increased the absorption inside all films are increased till reach to maximum value, this is due to the electronic transition from valence band to the conduction band or to the localized states between valence and conduction bands. So, As the photon energy increases both the extinction coefficient (k) which related to the attenuation of light intensity inside the films as shown in Fig 4-10 ,refractive index (n) which related to the velocity of light inside the films as shown in Fig 4-11, dielectric constant ( ε1 ) which related to electronic polarizability and the local field inside the material by an applied electric field as shown in Fig 4-12 and the dielectric loss ( ε2 ) which responsible for attenuation of the local field inside the material, causing dielectric loss inside the material as shown in Fig 4-13 are increased till reach to maximum value. As shown in figures 4-10, 4-11, 4-12 and 4-13. The values of k, n, ε1 and ε2 for the film at RT(amorphous film) is greater than the annealed films (crystalline films) in the visible and near infrared region because the annealed films more crystalline than the film at RT and the free charge carrier concentration of the film at RT is larger than the annealed films[8],[9]. The variation of k, n, ε1 and ε2 values for the annealed films is due to the variation of the crystallinity degree and the free charge carrier concentration [9]. It is observed that the dependence of ε1 on λ2 is linear at longer wavelengths as shown in Fig 4-14. Extrapolating the linear part of this dependence to zero wavelength gives the value of ε∞ and from the slopes of these lines we can calculate the values of Nt/m* for the investigated films. By using equation (4-4) we can calculate the free charge-carrier concentration (Nt) then substitute the values of (N t) into the slope to get the effective mass (m*). We can calculate the free charge carriers inter-atomic distance (R) from the following equation: (4-5) The values of
∞,
N/m*, N t, m*/me, R and are listed in Table 4-4. - 94 -
Chapter Four
Results and Discussion
0.200 Zn450
Extinction coeffecient (K)
0.175
ZnRT
0.150
Zn350 Zn300 Zn500
0.125
Zn400
0.100 0.075 0.050 0.025 0.000 1.5
2.0
2.5
3.0
3.5
4.0
E(eV)
Fig4-10: The extinction coefficient of deposited ZnO thin films at RT and annealed at different temperatures.
8
Refractive index (n)
7 6 5 ZnRT
4 Zn450
3
Zn400 Zn350
Zn300
2 Zn500
1 1.5
2.0
2.5
3.0
3.5
4.0
E(eV)
Fig 4-11: The refractive index of deposited ZnO thin films at RT and annealed at different temperatures.
- 95 -
Chapter Four
Results and Discussion
60 Zn450
50
2
1=n - k
2
40 30
ZnRT
20
Zn500
Zn300
Zn400 Zn350
10 0 1.5
2.0
2.5 E(eV)
3.0
3.5
4.0
Fig 4-12: The real part of complex dielectric constant of deposited ZnO thin films at RT and annealed at different temperatures.
3.0 Zn450
2.5
2=2nK
2.0 ZnRT
1.5 Zn300 Zn 350 Zn500 Zn400
1.0 0.5 0.0 1.5
2.0
2.5
3.0
3.5
4.0
E(eV)
Fig 4-13: The imaginary part of complex dielectric constant of deposited ZnO thin films at RT and annealed at different temperatures.
- 96 -
Chapter Four
Results and Discussion
8 7 Zn450
6
ZnRT
5 2
1=n - k
2
Zn300
4
Zn350
Zn400
3 Zn500
2 1 0 4.5
5.0
5.5
6.0 5 (nm) x10 2
6.5
7.0
2
Fig 4-14: The real part of complex dielectric constant as a function of λ2 for deposited ZnO thin films at RT and annealed at different temperatures.
Table 4-4: Dielectric constant (ε∞), Nt/m*, free charge–carrier concentration (Nt), effective mass of charge carriers (m*) relative to free electron mass (me) and the inter-atomic distance (R) of ZnO thin films at different annealing temperatures. Annealing temperature (oC)
ε∞
Nt/m* X1056
Nt (m-3) x1028
m*/me
R(nm)
RT 300 350 400 450 500
10.07 4.59 3.78 3.80 7.23 2.46
8.38 1.35 0.97 1.18 2.62 0.88
4.13 4.25 4.15 4.24 4.31
335.13 479.98 385.76 177.03 534.65
0.289 0.286 0.288 0.286 0.285
- 97 -
Chapter Four
Results and Discussion
4.1.4 Photoluminescence properties: Fig 4-15 shows PL spectrum of deposited ZnO thin films at RT and annealed at different temperatures that excited at 330 and 308nm, respectively. As shown in Fig 4-15, UV, violet, blue and green emissions are observed and the emission peak positions are listed in Table 4-5. a UV emission peaks at 390, 363, 378, 380, 393and 373 nm, corresponding to different annealing temperatures RT, 300, 350, 400, 450 and 500oC respectively are resulted from the transfer of electron from conduction band to valence band [5]. The violet emission peaks at 415, 423, 426 and 420 nm corresponding to different annealing temperatures 300, 350, 400 and 450oC, respectively are attributed to the transition of electron from conduction band to zinc vacancies (V Zn)[10]. The blue emission peaks at 446, 480, 488 , 486 and 481 nm corresponding to different annealing temperatures 300, 350, 400, 450 and 500oC, respectively are attributed to the transition of electron from zinc interstitial (Zn i) to zinc vacancies (V Zn)[5]. The green emission peaks at 531, 527 and 532 nm corresponding to different annealing temperatures 350, 400 and 500oC, respectively are attributed to the transition of electron from conduction band to the oxygen vacancy defect (Vo) [13]. The annealed films (crystalline films) emits UV, violet, blue, and green emissions but the deposited film at RT (amorphous film) emit UV emission only this indicates that the density of point defect in the annealed film is higher than the film deposited at RT. 4.1.5 Electrical properties: 4.1.5.1 dc conductivity: Fig 4-16 shows a semiconducting temperature dependence of the electrical conductivity σ(T), for deposited ZnO thin films at RT and annealed at different temperatures, which is the best being described by Arrhenius equation [11]:
- 98 -
Chapter Four
Results and Discussion
Zn500
Intensity(a.u)
Zn450 Zn400 Zn350 Zn300
ZnRT
360
400
440
480
520
560
Wavelength(nm)
Fig 4-15: PL spectrum of deposited ZnO thin films at RT and annealed at different temperatures.
Table 4-5: Emission peak positions of deposited ZnO thin films at RT and annealed at different temperatures. Annealing temperature (oC)
UV
Violet
Blue
Green
RT 300 350 400
390 363 378 380
-
-
-
415 423 426
446 480 488
531 527
450
393
420
486
-
500
373
-
481
532
- 99 -
Chapter Four
Results and Discussion
σ dc(T) = σo e-W/KT
(4-6)
Where σo is a pre-exponential factor. The activation energy (W) and preexponential factor (σo) were obtained from the least square straight line fits of the data. The straight line nature of the Arrhenius plot indicates that the conduction is thermally activated as often found in semiconductors. The activation energy of conduction for oxide semiconductors, which is the thermal energy required to hop the charges from one site to another. The calculated activation energy for the films is found to be 0.093–0.168 eV. The values of σ at 333 K, σo and W are listed in Table 4-6. Fig 4-17 shows annealing temperature effects on the conductivity (σ) at 333 K and the activation energy (W). A general trend observed in this figure is that the magnitude of the conductivity at fixed temperature tends to be highest in those films having smallest activation energy, which is consistent with equation (4-6). Fig 4-18 shows the activation energy and the average grain size as a function of annealing temperatures. According to quantum confinement theory, the activation energy of a material increases with decrease in size of the quantum dot [7]. So, as the annealing temperature increases from 300 oC to 400oC the average grain size increases from 5.22nm to 10.61nm and the activation energy decreases from 0.129 eV to 0.093 eV, respectively, then the average grain size decreases from 10.61nm to 6nm and the activation energy increases from 0.093 eV to 0.168 eV as the annealing temperature increases from 400oC to 500oC, respectively. Table 4-6: Electrical conductivity, pri-exponential factor and activation energy at different annealing temperatures. Annealing temperature (oC) RT 300 350 400 450 500
lnσ at 333K 5.22 5.34 5.96 6.05 -2.06 -2.33
- 100 -
Lnσ0 8.61 9.74 10.42 9.37 1.66 3.05
W(eV) 0.096 0.129 0.127 0.093 0.108 0.168
Chapter Four
8
Zn350 Zn400
Zn300
ZnRT
4
-1
-1
Ln ( ) ( m )
6
Results and Discussion
2 0 -2
Zn450 Zn500
2.4
2.6
2.8
3.0
3.2
3.4
-1
1000/T (K )
Fig 4-16: Temperature dependence of dc conductivity (σ) of ZnO thin films at different annealing temperature.
0.18
8
W (eV)
0.14 2
0.12 0
0.10
0.08 250
-1
4
ln ( ) (-1m )
6
0.16
-2 -4 300
350
400
450
500
550
0
Annealing temperature ( C)
Fig 4-17: Effect of annealing temperature on dc conductivity (σ) at T = 333 K and activation energy (W) for ZnO thin films.
- 101 -
Chapter Four
Results and Discussion
0.18
10
0.16
W(eV)
9 0.14
8 0.12 7
0.10
0.08 250
Average grain size (nm)
11
6 5 300
350 400 450 0 Annealing temperature( C)
500
550
Fig 4-18: Effect of annealing temperature on average grain size and activation energy (W) for ZnO thin films.
- 102 -
Chapter Four
Results and Discussion
4.2 Annealed ZnO Nanoparticles: 4.2.1 Structural properties: 4.2.1.1 XRD: Fig 4-19 shows the XRD pattern of ZnO nanoparticles annealed at different temperatures RT, 300, 350, 400, 450 and 5000C for 2h. The diffraction peaks indicate the nanocrystalline nature which gives good agreement with the JCPDS card no.04-015-0825. The XRD patterns shows that all the annealed ZnO nanoparticles have (100),(002),(101),(102),(110),(103),(200), (112), (201), (004) and (202) peaks. This indicates that annealed ZnO nanoparticles are identical to the hexagonal phase with Wurtzite structure. The average grain sizes (D) of annealed ZnO nanoparticles that calculated by using Sherrer’s formula are plotted as a function of the annealing temperature in Fig 4-20 and listed in Table 4-7. The grain size increases from 25.7nm to 36.4nm as the annealing temperature increases from RT to 4500C then decreases from 36.4nm to 33nm, this result can be explained by the two reasons: At first, atomic mobility increases with annealing temperature, enhancing the ability of atoms to find the most energetically favored sites. At second, the densities of the crystallographic defects including dislocations, interstitials and vacancies ZnO nanoparticles decrease rapidly with increasing the annealing temperature [2]. The lattice parameters (a) and (c) of ZnO unit cell with hexagonal structure can be calculated from the XRD pattern by using equation (4-3), then we can calculate the density of annealed ZnO nanoparticles using equation 4-4. The values of "c" and "a" parameters and the density of annealed ZnO nanoparticles are listed in Table 4-7. The position of (002) diffraction peak for annealed ZnO nanoparticles at RT, 300, 350, 400,450 and 5000C appear at 34.389, 34.429, 34.431,34.423,34.425 and 34.429, respectively as listed in Table 4-7. Compared with the (002) peak position of ZnO powder (2 = 34.432), the diffraction angle of all annealed ZnO nanoparticles decrease in comparison with bulk ZnO, which results in the increase of interplanar spacing and c-axis values, and the decrease of the density of annealed ZnO nanoparticles[4]. - 103 -
Chapter Four
Results and Discussion
100
Zn500
101 002
112 103 200 201 004
110
102
202
Intensity(a.u)
Zn450 Zn400 Zn350 Zn300 ZnRT
20
30
40
50 2(degree)
60
70
80
Fig 4-19: XRD pattern of ZnO nanoparticles annealed at different temperatures.
38
Average grain size(nm)
36 34 32 30 28 26 0
100
200 300 400 o Annealing temperature( C)
500
Fig 4-20: The average grain size of ZnO nanoparticles as a function of annealing temperature. Table 4-7: Lattice parameters, Grain size and Density at different annealing temperatures. Grain size(nm) Annealing temperature (oC) RT 300 350 400 450 500
2θ002
2θ100
C(oA)
a(oA)
Density (g/cm3)
34.389 34.429 34.431 34.423 34.425 34.429
31.719 31.758 31.760 31.744 31.760 31.759
5.209 5.203 5.203 5.204 5.204 5.203
3.253 3.249 3.249 3.251 3.249 3.249
5.661 5.680 5.681 5.675 5.681 5.681
- 104 -
25.7 34.1 34.2 34.6 36.4 33
Chapter Four
Results and Discussion
4.2.1.2 FTIR spectra: Fig 4-21 shows the FTIR spectrum of ZnO nanoparticles annealed at different temperatures. The spectra contain one intense absorption bands are attributed to bending vibrations absorption of Zn–O bond for all films. The observed absorbed bands are listed in Table 4-8. The bands sited at 431, 429, 422, 420, 434 and 434 cm-1 corresponds to different annealing temperatures are a typical ZnO absorption attributed to bending vibration absorption of Zn–O bond [5]. The bands sited at 3434, 1632 cm-1 are due to a stretching and bending vibrations absorption of OH bond of water [6]. The bands sited at 1055 ,1061 and 1026 cm-1 corresponds to annealing temperatures RT, 300 and 350oC respectively are a typical vibration absorption of Zn–OH bond[12]. On the other hand, the intensity of the absorption band of Zn–OH bond decreases as the annealing temperature increases from RT to350oC and disappeared at the annealing temperatures 400, 450 and 500oC because the OH bond will be evaporated as the samples annealed at temperature higher than 4000C. The optical phonon frequency (o) and Debye temperature D could be calculated from IR spectra by using the observed absorption band which assigned to vibrations of the Zn–O bonds as discussed in the part of FTIR spectra of ZnO thin film. The values of optical phonon frequency and Debye temperature are presented in the Table 4-8. 4.2.1.3 TEM: Fig 4-22 shows the TEM image of annealed ZnO nanoparticles at 4000C for 2h. The TEM images confirm that the ZnO nanoparticles annealed at 400◦C was typical wurtzite polycrystalline nanorods with average grain diameter 39nm and grain length 388nm which is in good agreement with that estimated by Scherer formula based on the XRD pattern(D=34.6nm). 4.2.2 SEM: Fig 4-23 shows the SEM image of ZnO nanoparticles annealed at 4000C for 2h. It shows that the as-prepared products consist of a large quantity of flower-shaped structures. The flower-shaped structure always made up of many nanorods that is can be observed from TEM image. - 105 -
Chapter Four
Results and Discussion
100 Zn450
Trasmittance(%)
95
Zn400
Zn500
ZnRT
90
Zn350
Zn300
85 80 75 70 65 500
1000
1500 2000 2500 -1 Wavenumber(cm )
3000
3500
4000
Fig 4-21: FTIR spectrum of deposited ZnO thin films at RT and annealed at different temperatures.
Table 4-8: Absorption bands, optical phonon frequency and Debye temperature at different annealing temperatures. Annealing temperature (oC) RT 300 350 400 450 500
Bending wavenumber (cm-1) 431 429 422 420 434 434
Bending optical phonon o (Hz) x1013
1.29 1.28 1.26 1.26 1.3 1.3
- 106 -
Bending debye temperature
D ( K)
620 617 607 605 624 624
o
Chapter Four
Results and Discussion
Fig 4-22: TEM image of ZnO nanoparticles annealed at 4000C for 2h.
Fig 4-23: SEM image of ZnO nanoparticles annealed at 4000C for 2h.
- 107 -
Chapter Four
Results and Discussion
4.2.3 Optical properties: Fig 4-24 shows the Transmittance spectrum of ZnO nanoparticles annealed at different temperatures. It is observed that all the annealed ZnO nanoparticles have the same absorption band at wavelength 377nm. The optical band gap Eg of ZnO nanoparticles annealed at different temperature can be obtained from the intercept of (αhυ)2 vs. hυ as shown in Figure 4-25. The optical band gap decreases from 2.37 eV to 2.29 eV as the annealing temperature increase from RT to 500oC, and the values Eg are listed in Table 4-9. It is known that the bulk ZnO has an optical band gap at 3.30 eV. The values of the optical band gap Eg of annealed ZnO nanoparticles are too low to be an indication of the band gap energies but rather an indication of the vacancy energy levels (E v). This shows that an increase in the annealing temperature decreased the vacancy energy level. The decrease in the vacancy energy levels of annealed ZnO nanoparticles as annealing temperature increases may be attributed to the defects that are in the ZnO nanoparticles. Fig 4-26 shows the vacancy energy levels and the average grain size as a function of annealing temperature. According to quantum confinement theory, the band gap energy of a material decreases with increase in size of the quantum dot [7]. So, as the annealing temperature increases from RT to 450 oC the average grain size increases from 25.7nm to 36.4nm and the vacancy energy levels decreases from 2.37 eV to 2.25 eV respectively, then the average grain size decreases from 36.4nm to 33nm and the vacancy energy levels increases from 2.25 eV to 2.29 eV as the annealing temperature increases from 400oC to 500oC, respectively. As the photon energy increased the absorption inside all ZnO nanoparticles are increased till reach to maximum value then decreased, this is due to the electronic transition from valence band to the conduction band or to the localized states between valence and conduction bands. - 108 -
Chapter Four
Results and Discussion
50 ZnRT
Transmittance(%)
40 Zn300
30
Zn350 Zn500 Zn450
20
Zn400
10 300
400
500
600
700
800
Wavelength(nm)
Fig 4-24: Transmittance spectra of ZnO nanoparticles annealed at different temperatures.
45 Zn400
40
2
(h ) (eV cm )
-1 2
35
Zn450
30
Zn500
25
Zn350
20
Zn300
15
ZnRT
10 5 0 1.5
2.0
2.5
3.0
3.5
E(eV)
Fig 4-25: Plot of (αhυ)2 vs. hυ of deposited ZnO nanoparticles annealed at different temperatures.
- 109 -
Chapter Four
Results and Discussion
2.40
34
2.36
32 2.32
30 28
Ev (eV)
Average grain size (nm)
36
2.28
26 0
100
200 300 400 0 Annealing temperature ( C)
500
2.24
Fig 4-26: The vacancy energy levels (Ev) and the average grain size of ZnO nanoparticles as a function of annealing temperature.
Table 4-9: Vacancy energy levels at different annealing temperatures. Annealing temperature (oC)
vacancy energy levels Ev (e V)
RT 300 350 400 450 500
2.37 2.32 2.29 2.27 2.25 2.29
- 110 -
Chapter Four
Results and Discussion
So, As the photon energy increases both the extinction coefficient (k) which related to the attenuation of light intensity as shown in Fig 4-27 ,refractive index(n) which related to the velocity of light as shown in Fig 4-28, dielectric constant( ε1 ) which related to electronic polarizability and the local field inside the material by an applied electric field as shown in Fig 4-29 and the dielectric loss( ε2 ) which responsible for attenuation of the local field inside the material, causing dielectric loss inside the material as shown in Fig 4-30 are increased till reach to maximum value then decreased. As shown in figures 4-27, 4-28, 4-29 and 4-30. The values of k, n, ε1 and ε2 for the annealed ZnO nanoparticles increase with increasing the average grain size and the carrier concentration [9]. It is observed that the dependence of ε1 on λ2 is linear at longer wavelengths as shown in Fig 4-31. Extrapolating the linear part of this dependence to zero wavelength gives the value of ε∞ and from the slopes of these lines we can calculate the values of Nt/m* for the investigated films. By using equation (4-4) we can calculate the free charge-carrier concentration (Nt) then substitute the values of (N t) into the slope to get the effective mass (m*) and from equation (4-5) we can calculate the free charge carriers inter-atomic distance (R). The values of
∞,
N/m*, N t, m*/me, R and listed in Table 4-10.
Table 4-10: Dielectric constant (ε∞), Nt/m*, free charge–carrier concentration (Nt), effective mass of charge carriers (m*) relative to free electron mass (me) and the inter-atomic distance (R) of ZnO nanoparticles at different annealing temperatures.
Annealing temperature (oC)
RT 300 350 400 450 500
ε∞
Nt/m* X1057
Nt (m-3) x1028
m*/me
R(nm)
56 117 175 355 269 191
2.45 6.62 9.7 15.47 16.2 9.27
4.206 4.221 4.222 4.217 4.221 4.222
18.8 6.9 4.7 2.9 2.8 4.9
0.2875 0.2871 0.2871 0.2872 0.2871 0.2871
- 111 -
Chapter Four
Results and Discussion
8
Extinction coefficient (K) x 10
-6
7 6
Zn400
5
Zn Zn500 450
Zn300
Zn350
4 ZnRT
3 2 1 2.0
2.5
3.0
3.5
4.0
4.5
5.0
E(eV)
Fig4-27: The extinction coefficient of ZnO nanoparticles annealed at different temperatures.
25
Refractive index (n)
20
Zn400 Zn450
15
Zn500 Zn350 Zn300
10
ZnRT
5 2.0
2.5
3.0
3.5 E(eV)
4.0
4.5
5.0
Fig 4-28: The refractive index of ZnO nanoparticles annealed at different temperatures.
- 112 -
Chapter Four
Results and Discussion
600
400
Zn450
2
1=n - k
2
Zn400
Zn500
200
Zn350
Zn300 ZnRT
0 2.0
2.5
3.0
3.5 E(eV)
4.0
4.5
5.0
Fig 4-29: The real part of complex dielectric constant of ZnO nanoparticles annealed at different temperatures. 3 Zn400
2 = 2 n k x 10-4
2
Zn450 Zn500 Zn350
1
Zn300 ZnRT
0 2.5
3.0
3.5
4.0
4.5
5.0
E(eV)
Fig 4-30: The imaginary part of complex dielectric constant of ZnO nanoparticles annealed at different temperatures.
- 113 -
Chapter Four
Results and Discussion
300 Zn400
Zn450
1=n2- k2
200
Zn500 Zn350 Zn300
100
ZnRT
0
4.6
4.8
2
5.0 2
5
5.2
5.4
(nm) x 10
Fig 4-31: The real part of complex dielectric constant as a function of λ2 for ZnO nanoparticles annealed at different temperatures.
- 114 -
Chapter Four
Results and Discussion
4.2.4 Photoluminescence properties: Fig 4-32 shows PL spectrum of ZnO nanoparticles annealed at different temperatures that excited at 377nm. It is observed that, a strong UV and very weak violet, blue and green emissions are emitted. All the annealed ZnO nanoparticles emit UV, violet, blue and green emissions sited at 392, 420, 484 and 528nm, respectively. The strong UV emission peaks at 392nm are resulted from the transfer of electron from conduction band to valence band [5]. The violet emission peaks at 420 nm are attributed to the transition of electron from conduction band to zinc vacancies (V Zn)[10]. The blue emission peaks at 484 nm are attributed to the transition of electron from zinc interstitial (Zn i) to zinc vacancies (VZn)[5]. The green emission peaks at 528 nm are attributed to the transition of electron from conduction band to the oxygen vacancy defect (Vo) [13]. The annealed ZnO nanoparticles emit strong UV and very weak violet, blue and green emissions this refers to the high crystal quality of annealed ZnO nanoparticles. . 4.2.5 Electrical properties: 4.2.5.1 dc conductivity: Fig 4-33 shows the temperature dependence of the electrical conductivity σ (T), for ZnO nanoparticles annealed at different temperatures. It is observed that, the samples that annealed at RT, 300 and 3500C behave as metallic behavior at temperatures lower than 385, 345 and 331K and behave as semiconductor behavior at temperatures higher than 385, 345 and 331K respectively, this is due to the presence of Zn-OH bond in the structure of the samples that annealed at RT, 300 and 3500C this confirmed from FTIR spectra. On the other hand, the transition temperature decreases from 385 to 331K as the annealing temperature increases from RT to 3500C because the intensity of the absorption band of Zn–OH bond decreases as the annealing temperature increases from RT to350 oC - 115 -
Chapter Four
Results and Discussion
(as shown in FTIR spectra). The samples annealed at 400, 450 and 5000C shows semiconductor behavior over all the temperature range because the OH bond will be evaporated as the samples annealed at temperature higher than 4000C. The calculated activation energy for the samples is found to be 0.35–0.791 eV. The values of σ at 455 K, σo and W are listed in Table 4-11. Fig 4-34 shows annealing temperature effects on the conductivity (σ) at 455 K and the activation energy (W). A general trend observed in this figure is that the magnitude of the conductivity at fixed temperature tends to be highest in those nanoparticles having smallest activation energy, which is consistent with Eq4-5. Fig 4-35 shows the effects of annealing temperature on the conductivity (σ) at 455 K and the average grain size. According to quantum confinement theory, the activation energy of a material decreases with increase in size of the quantum dot [7]. The magnitude of the conductivity at fixed temperature tends to be highest in those nanoparticles having smallest activation energy. So, as the annealing temperature increases from RT to 450oC the average grain size increases from 25.7nm to 36.4nm and the conductivity increases from -9.41to -4.42 ohm-1m-1respectively. However, as the annealing temperature increases from 450oC to 500oC the average grain size decreases from 36.4nm to 33nm and the conductivity increases from -4.42 to -3.57 ohm-1m-1. The increase of the conductivity can be attributed to the decrease in grain boundary scattering due to the reduction in grain size [11]. Table 4-11: Electrical conductivity, pri-exponential factor and activation energy at different annealing temperatures. Annealing temperature (oC) RT 300 350 400 450 500
Lnσ at 455 K -9.41 -8.05 -7.77 -6.69 -4.42 -3.57
- 116 -
Lnσ0 10.64 5.93 6.31 5.92 5.99 4.68
W(eV) 0.791 0.545 0.554 0.515 0. 462 0.350
Results and Discussion
Intensity(a.u)
Chapter Four
Zn500 Zn450 Zn400 Zn350 Zn300 ZnRT
400
450
500
550
600
650
700
Wavelength(nm)
Fig 4-32: PL spectrum of ZnO nanoparticles annealed at different temperatures.
0
-1
-1
Ln ( ) ( m )
-3
-6
Zn500
Zn350
Zn450
Zn400
-9 ZnRT Zn300
-12
-15 2.0
2.2
2.4
2.6
2.8
3.0
3.2
3.4
-1
1000/T (K )
Fig 4-33: Temperature dependence of dc conductivity (σ) of ZnO nanoparticles annealed at different temperature.
- 117 -
Chapter Four
Results and Discussion
-3
0.9
-4
0.8
0.7
-6 0.6 -7
W (eV)
-1
-1
ln ( ) ( m )
-5
0.5
-8
-9
0.4 0.3
-10 0
100
200
300
400
500
0
Annealing temperature ( C)
-3
38
-4
36
-5
34
-6
32
-7
30
-8
28
Average grain size (nm)
-1
-1
ln ( ) ( m )
Fig 4-34: Effect of annealing temperature on dc conductivity (σ) at T = 455 K and activation energy (W) for ZnO nanoparticles.
-9 26 -10 0
100
200
300
400
500
0
Annealing temperature ( C)
Fig 4-35: Effect of annealing temperature on average grain size and dc conductivity (σ) at T = 455 K for ZnO nanoparticles.
- 118 -
Chapter Four
Results and Discussion
4.2.5.2 ac conductivity: Fig 4-36 shows the variation of ac conductivity with the temperature at f=100 kHz for annealed ZnO nanoparticles. Results reveal that the increase of σ ac with the temperature indicates that the mobility of charge carriers is increased [14]. The increase of ac conductivity with annealing temperature is due to the increase of oxygen vacancies and the mobility of charge carriers with increasing the annealing temperature. The inset graph shows three minima at 331, 329, 339K for the samples annealed at RT, 300, 350oC, respectively. These minima are due to the presence of Zn-OH bond in the structure of annealed samples. The samples annealed at 400, 450 and 5000C shows semiconductor behavior over all the temperature range because the OH bond will be evaporated as the samples annealed at temperatures higher than 4000C. Fig 4-37 shows the values of σ ac at f=100 kHz and T=350K and the average grain size for ZnO nanoparticles as a function of annealing temperature. It is observed that the values of σ ac increases from -9.6 to -7.1, as the annealing temperature increases from RT to 450oC. This is due to the increase of average grain size, oxygen vacancies and the mobility of charge carriers with increasing the annealing temperature [14]. As the annealing temperature increases from 450oC to 500oC the average grain size decreases from 36.4nm to 33nm and the ac conductivity increases from -7.1 to -4.3. The increase of the ac conductivity can be attributed to the decrease in grain boundary scattering due to the reduction in grain size [11]. The frequency-dependent conductivity (total conductivity) measured under an ac field for many amorphous and nanomaterials solids have been found to obey the general relationship [16]:
σ ac (ω) = σ(ω) - σ dc = ω εoε'' = ω ε o ε' tan δ
(4-7)
Where ω is the angular frequency, ε o is the permittivity of free space, ε' is the dielectric constant, ε'' is the dielectric loss, tan δ = ε''/ ε' is the dielectric loss factor and σdc is the dc conductivity. - 119 -
Chapter Four
0.20
0.0008
Zn450
0.12
0.0004
Zn 350
Zn 400
Zn 300 Zn RT
-1
-1
ac( m )
-1
-1
ac( m )
0.16
Results and Discussion
0.0000
0.08
320
360
Temperature (K)
400
440
Zn500
0.04
Zn450
0.00 320
360
400
440
Temperature (K)
38
-5
36
-6
34
32
-7
30
-8
28
-9
Average grain size ( nm )
-4
Ln ( m
Fig 4-36: The variation of ac conductivity with the temperature at f=100 kHz for annealed ZnO nanoparticles.
26 -10 0
100
200
300
400
500
o
Annealing temperature ( C)
Fig 4-37: Effect of annealing temperature on the average grain size and σ ac at f = 100 kHz and T=350K for ZnO nanoparticles.
- 120 -
Chapter Four
Results and Discussion
The dc and ac conductivity at different frequencies as a function of reciprocal temperature for the sample that annealed at 3500C is shown in Fig 4-38. At lower temperatures, σ
ac
is greater than σ
dc,
with smaller temperature
dependence but a larger frequency dependence. At higher temperatures, σac becomes temperature dependent and approaches σdc. The temperature at which
σdc equals the measured total conductivity, σ (ω) increases with increasing frequency. The observed low value of ac conductivity at 331K is due to the presence of Zn-OH bond in the structure of the sample. 4.3 Comparison study between ZnO thin films and ZnO nanoparticles: The structural, optical and electrical properties of ZnO thin films and ZnO nanoparticles strongly depend on the annealing temperatures. When the ZnO nanoparticles transformed into annealed ZnO thin films using pulsed laser deposition technique, we can conclude the following:
Improvement in the films crystallinity with increasing heat treatment temperature up to 400 oC. This means that the annealing treatment can improve the crystal quality of ZnO thin films. The average grain size was found to be 5.22–10.61nm. The stress in annealed ZnO thin films transformed from compressive to tensile as the annealing temperature increased.
The X-ray diffraction measurements of the annealed ZnO nanoparticles showed hexagonal close-packed structure of ZnO with average grain size 25.7–36.4 nm.
The FTIR spectra of the annealed films reveal the presence of ZnO by the appearing of two absorption bands which related to the bending and stretching vibrations of ZnO and the values of optical phonon frequency (υ o) were found to be 1.26-1.58 x 10¹³ Hz.
The presence of ZnO nanoparticles was confirmed by the observing of one absorption bands which related to the bending vibrations of ZnO in FTIR spectra. The values of optical phonon frequency (υo) were found to be 1.26 – 1.3 x 10¹³ Hz. - 121 -
Chapter Four
Results and Discussion
-5 -6 900kHz
-7
700kHz 500kHz 300kHz
-1
-1
ln ( ) ( m )
-8 100kHz
-9 -10
1kHz 100Hz
-11 -12
dc
(a)
-13 -14 2.5
3.0
3.5
-1
1000/T (K )
Fig 4-38: Temperature dependence of dc and ac conductivities at different frequency for ZnO nanoparticles annealed at 3500C.
- 122 -
Chapter Four
Results and Discussion
The TEM image of annealed ZnO thin films shows that the ZnO crystals are nanobelts with average grain diameter 12nm. However, The TEM image of annealed ZnO nanoparticles reveals that the ZnO crystals are nanorods.
The SEM image of annealed films shows that the shape of ZnO grains is spherical shape and the film surface is rough. On the other hand, The SEM image of annealed nanoparticles shows that the ZnO grains are flower-shaped.
From the transmission spectra, the optical band gap energy of ZnO thin films is found to be in the range 2.95-3.32 eV. But, The vacancy energy level of ZnO nanoparticles was found to be 2.25 - 2.37 eV.
The values of k, n, ε1 and ε2 for the film at RT is greater than the annealed films in the visible and near infrared region because the annealed films more crystalline than the film at RT (amorphous film) and the free charge carrier concentration of the film at RT is larger than the annealed films. The variation of k, n, ε1 and ε2 values for the annealed films is due to the variation of the crystallinity degree and the free charge carrier concentration.
The values of k, n, ε1 and ε2 for the annealed ZnO nanoparticles increase with increasing the annealing temperature. This is due to the increase of average grain size, oxygen vacancies and the carrier concentration with the annealing temperature.
The PL spectra of ZnO thin films show strong UV, violet, blue and green emissions. However, The PL spectrum of ZnO nanoparticles shows that all the samples emits strong UV and very weak violet, blue and green emissions.
The activation energy of ZnO thin films was found to be 0.093–0.168 eV. But,the activation energy of ZnO nanoparticles was found to be0.35–0.791eV.
Finally, It is concluded that the optical and electrical properties of ZnO thin films fabricated by pulsed laser deposition is better than the ZnO nanoparticles prepared by microwave irradiation for optical and electrical component applications. Specially, the annealed thin film at 4000C. Where, the transmission
- 123 -
Chapter Four
Results and Discussion
is about 90% in the visible range, the activation energy is about 0.093 eV and the electrical conductivity at room temperature is 382.7Ω-1m-1. So, it is the best film to use it as transparent conductive electrodes for solar cells and organic light emitting diode (OLED). 4.4 References: 1) C.C. Hsu, N.L. Wu, J. Photocatalytic activity of ZnO/ZnO2 composite, Photochemistry and Photobiology A: Chem. 172 (2005) 269. 2) Lin Cui, Gui-GenWang, Hua-YuZhang, RuiSun, Xu-PingKuang, Jie-CaiHan. Effect of film thickness and annealing temperature on the structural and optical properties of ZnO thin films deposited on sapphire (0001) substrates by sol–gel, Ceramics International 39 (2013) 3261. 3) M. Tiemann, F. Marlow, J. Hartikainen,O. Weiss, M. Linder, Ripening effects in ZnS nanoparticle growth, Journal of Physical Chemistry. 112 (2008) 1463. 4) Zhu BL, Sun XH, Zhao XZ, Su FH, Li GH, Wu XG, et al. The
effects of
substrate temperature on the structure and properties of ZnO films prepared by pulsed laser deposition. Vacuum 82(2008)495. 5) X.Q. Wei, Z. Zhang, Y.X. Yu , B.Y. Man. Comparative study on structural and optical properties of ZnO thin films prepared by PLD using ZnO powder target and ceramic target. Optics, Laser Technology 41(2009) 530. 6) N. Faal Hamedani, F. Farzaneh. Synthesis of ZnO Nanocrystals with Hexagonal (Wurtzite) Structure in Water Using Microwave Irradiation. Journal of Sciences, Islamic Republic of Iran 17(2006)231. 7) Y.G. Wang, S.P. Lau, H.W. Lee, S.F. Yu, S.K. Tay, X.Z. Zang, H.H. Hing, Photoluminescence study of ZnO films prepared by thermal oxidation of Zn metallic films in air. Journal of Applied Physics. 94 (2003) 354. 8) Soaram Kim , Hyunsik Yoon , Do Yeob Kim, Sung-O Kim, Jae-Young Leem, Optical properties and electrical resistivity of boron-doped ZnO thin films grown by sol–gel dip-coating method, Optical Materials 35 (2013) 2418. - 124 -
Chapter Four
Results and Discussion
9) A.I. Ali , A.H. Ammar, A. Abdel Moez, Influence of substrate temperature on structural, optical properties and dielectric results of nano- ZnO thin films prepared by Radio Frequency technique, Superlattices and Microstructures 65 (2014) 285. 10) Tapas Kumar Kundu, Nantu Karak , Puspendu Barik , Satyajit Saha. Optical Properties of Zno Nanoparticles Prepared by Chemical Method Using Poly (VinylAlcohol ) (PVA) as Capping Agent. International Journal of Soft Computing and Engineering 1(2011)2231. 11) M.S. Al-Assiri, M.M. Mostafa, M.A. Ali, M.M. El Desoky. Synthesis, structural and electrical properties of annealed ZnO thin films deposited by pulsed laser deposition (PLD), Superlattices and Microstructures 75 (2014) 127. 12) Agnieszka Kołodziejczak-Radzimska, EwaMarkiewicz, Teofil Jesionowski, Structural Characterisation of ZnO Particles Obtained by the Emulsion Precipitation Method, Journal of Nanomaterials. 24 (2012)9. 13) Jinghai Yang, Xiaoyan Liu, Lili Yang, Yaxin Wang, Yongjun Zhang, Jihui Lang, Ming Gao, Maobin Wei, Effect of different annealing atmospheres on the structure and optical propertiesof ZnO nanoparticles, Journal of Alloys and Compounds 485 (2009) 743. 14) Amrut S. Lanje, Satish J. Sharma, Raghumani S. Ningthoujam , J.S. Ahn, Ramchandra B. Pode, Low temperature dielectric studies of zinc oxide (ZnO) nanoparticles
prepared
by
precipitation
method,
Advanced
Powder
Technology 24 (2013) 331. 15) V. Kapustianyk, Yu. Eliyashevskyya, B. Turkoa, Z. Czaplab, S. Dackob, B. Barwinski, Influence of technological factors on conductivity and dielectric dispersion in ZnO nanocrystalline thin films, Journal of Alloys and Compounds 531 (2012) 64. 16) M. M. El-Desoky and I. Kashif, Electrical Conductivity in Mixed Calcium and Barium Iron Phosphate Glasses, physica status solidi.194 (2002) 89. - 125 -
Chapter Five
Conclusion and Future Work
5.1 Conclusion: The effects of annealing temperature on the structural, optical and electrical properties of ZnO thin films fabricated by pulsed laser deposition and ZnO nanoparticles prepared by microwave irradiation were investigated and we can observe the following: Improvement in the films crystallinity with increasing heat treatment temperature up to 400 oC. This means that the annealing treatment can improve the crystal quality of ZnO thin films. The average grain size was found to be 5.22–10.61nm. The stress in annealed ZnO thin films transformed from compressive to tensile as the annealing temperature increased.
The X-ray diffraction measurements of the annealed ZnO nanoparticles showed hexagonal close-packed structure of ZnO with average grain size 25.7–36.4 nm.
The FTIR spectra of the annealed films reveal the presence of ZnO by the appearing of two absorption bands which related to the bending and stretching vibrations of ZnO and the values of optical phonon frequency (υo) were found to be 1.26-1.58 x 10¹³ Hz. The presence of ZnO nanoparticles was confirmed by the observing of one absorption bands which related to the bending vibrations of ZnO in FTIR spectra. The values of optical phonon frequency (υo) were found to be 1.26 – 1.3 x 10¹³ Hz. The TEM image of annealed ZnO thin films shows that the ZnO crystals are nanobelts with average grain diameter 12nm. However, The TEM image of annealed ZnO nanoparticles reveals that the ZnO crystals are nanorods. The SEM image of annealed films shows that the shape of ZnO grains is spherical shape and the film surface is rough. On the other hand, The SEM image of annealed nanoparticles shows that the ZnO grains are flower-shaped.
- 126 -
Chapter Five
Conclusion and Future Work
From the transmission spectra, the optical band gap energy of ZnO thin films is found to be in the range 2.95-3.32 eV. But, The vacancy energy level of ZnO nanoparticles was found to be 2.25 - 2.37 eV. The values of k, n, ε1 and ε2 for the film at RT is greater than the annealed films in the visible and near infrared region because the annealed films more crystalline than the film at RT (amorphous film) and the free charge carrier concentration of the film at RT is larger than the annealed films. The variation of k, n, ε1 and ε2 values for the annealed films is due to the variation of the crystallinity degree and the free charge carrier concentration. The values of k, n, ε1 and ε2 for the annealed ZnO nanoparticles increase with increasing the annealing temperature. This is due to the increase of average grain size, oxygen vacancies and the carrier concentration with the annealing temperature. The PL spectra of ZnO thin films show strong UV, violet, blue and green emissions. However, The PL spectrum of ZnO nanoparticles shows that all the samples emits strong UV and very weak violet, blue and green emissions. The activation energy of ZnO thin films was found to be 0.093–0.168 eV. But, the activation energy of ZnO nanoparticle was found to be 0.35–0.791 eV. The ac conductivity increase with the temperature and with the annealing temperature. The increase of ac conductivity with the temperature indicates that the mobility of charge carriers was increased. 5.2 Future Work: Based on the conducted experimental work the following ideas and technological challenges appeared: The deposition of ZnO thin films onto heated single crystal substrates such as quartz and silicon substrate were found to improve the crystal quality of the films.
- 127 -
Chapter Five
Conclusion and Future Work
Measure the sensitivity of ZnO thin films for gases such as Hydrogen and liquid petroleum gases by measuring the resistance of the film. The fabrication of ZnO thin films doped with Ga, Al and In elements to improve the electrical and optical properties.
- 128 -
جامعة السويس كلية العلوم قسم الفيزياء
دراسة مقارنة على التركيب وبعض الخصائص الفيزيائية ألفالم من أكسيد الزنك الرقيقة المحضرة بطريقة ترسيب الليزر النابض رسالة مقدمة من
محمد عبدالرحيم علي عبدالباقى بكالريوس العلوم فى الفيزياء كلية العلوم – جامعة القاهرة()9002
كجزء من متطلبات نيل درجة ماجستير العلوم فى الفيزياء
(فيزياء البصريات والقياسات الطيفية)
4102
جامعة السويس كلية العلوم قسم الفيزياء
السادة المشرفين عنوان الرسالة :دراسة مقارنة على التركيب وبعض الخصائص الفيزيائية ألفالم من أكسيد الزنك الرقيقة المحضرة بطريقة ترسيب الليزر النابض اسم الباحث :محمد عبدالرحيم على عبد الباقى إشراف : -1أ.د /محمد محمود الدسوقى
التوقيع ...............
أستاذ فيزياء الجوامد – كلية العلوم – جامعة السويس -4د /هشام امام محمود
...............
المعهد القومى لعلوم الليزر -جامعة القاهرة -3د /جمال السيد عفيفى المعهد القومى لعلوم الليزر -جامعة القاهرة
...............
جامعة السويس كلية العلوم قسم الفيزياء
الساده أعضاء لجنة الحكم والمناقشة عنوان الرسالة :دراسة مقارنة على التركيب وبعض الخصائص الفيزيائية ألفالم من أكسيد الزنك الرقيقة المحضرة بطريقة ترسيب الليزر النابض اسم الباحث :محمد عبدالرحيم على عبد الباقى لجنة الحكم و المناقشة :
التوقيع
-0أ.د /محمد يسرى حسان
..............
أستاذ فيزياء الجوامد – كلية العلوم -جامعة األزهر -4أ.د /محمد محمود الدسوقى
..............
أستاذ فيزياء الجوامد – كلية العلوم – جامعة السويس -3أ.د /فريد محمود كامل طنطاوى أستاذ فيزياء الجوامد – كلية العلوم -جامعة قناة السويس
..............
مقدمة أكسيد الزنك هو مركب العضوي ذو الصيغة الكيميائية ) (ZnOوهو على شكل مسحوق أبيض، واليذوب تقريبا في الماء .في علم المواد ،أكسيد الزنك هو شبه موصل سالب بسبب فجوات األكسجين الموجودة فى البلورة وله طاقة فجوة بصرية واسعة تصل الى حوالى 3.3الكترون فولت. أكسيد الزنك لديه العديد من الخصائص الكهربية والضوئية مثل الشفافية العالية للضوء المرئى، واالنتقا اإللكترون العالي ،طاقة الفجوة البصرية الواسعة وشدة اللمعان الضوئى عند درجة حرارة الغرفة. أكسيد الزنك يستخدم فى العديد من التطبيقات مثل استخدامه كأقطاب موصلة شفافة للخاليا الشمسية ،للصمام الثنائي الباعث للضوء و لشاشات الكريستا السائل .ويستخدم ايضا فى اجهزة مجسات الغاز ،ليزر االشعة الفوق البنفسجية ،شرائح الترانزستور الرقيقة ،الصمام الثنائي الباعث للضوء، كاشف لالشعة الفوق بنفسجية ،األجهزة البصرية و االلكترونية قصيرة الطول الموجي ،أجهزة سطح الموجة الكهربائية والصوتية ،مكثف ،الخاليا الشمسية ،السيراميك ،الزجاج ،األسمنت، المطاط (إطارات السيارات)،الطالء ،المراهم ،األغذية (كمصدر للتغذية بعنصر الزنك (والبطاريات الكهربائية. تعد تقنية االغشية الرقيقة واحدة من أهم التقنيات التي ساهمت في تطوير دراسة اشباه الموصالت واعطت فكره واضحة عن العديد من الخصائص الفيزيائية .ويطلق عادة مصطلح االغشية الرقيقة على طبقة أو عدة طبقات من ذرات معينة قد اليتعدى سمكها واحد ميكرون ناتجه عن تكثيف الذرات أو الجزيئات والتي تمتلك خواص فريده هامه تختلف عما إذا كانت عباره عن جسيم سميك كالصفات الفيزيائية والهندسية ،ولقلة سمك هذه االغشيه وسهولة تشققها لذلك ترسب على مواد أخرى تستخدم كقواعد ترسيب ويعتمد نوع القاعدة على طبيعة االستخدام والدراسة مثل الزجاج و الكوارتز و السليكون و االلومنيوم .لالغشيه الرقيقه استعماالت صناعية متعددة إذ تدخل في تركيب األجهزة اإللكترونية على شكل مقاومات و ترانزسترات وغيرها وتعد أساسا لتصنيع الخاليا الشمسية والضوئية ،كما تدخل في صناعة الكواشف الكهروبصرية ولها كثير من التطبيقات. تحضر األغشية الرقيقة باستخدام تقنيات مختلفة ،هذه التقنيات اما ان تكون طرق تحضير كيميائية او طرق تحضير فيزيائية .ومن اهمها :
.1طريقة الترسيب الكهربائي )(Electrodeposition .9التبخير الحرارى فى الفراغ )(Thermal Evaporation In Vacuum .3الترذيذ المغناطيسى ()Magnetron Sputtering .4طريقة الترسيب الكيميائى الحرارى ()Chemical Spray Pyrolysis .5تقيل (النمو الفوقى) الشعاع الجزيئي ()Molecular Beam Epitaxy .6ترسيب الليزر النابض ()Pulsed Laser Deposition بين العديد من التقنيات المختلفة لترسيب االغشية الرقيقة أصبح تقنية ترسب الليزر النابض هامة لتصنيع االغشية الرقيقة وذلك ألنه يمكن ترسيب غشاء رقيق ذات تركيب بلورى عالى الجودة عند درجة حرارة الغرفة ويكون الغشاء موزع بطريقة منتظمة وهذا يعنى ان سمك الغشاء يكون منتظم و تكون قوة التالصق بين الغشاء و قواعد الترسيب عالية. ان تقنية الليزر النابض يمكنها ترسيب مجموعة كبيرة من انواع المواد مثل االكاسيد ،المعادن ، اشباه الموصالت والبوليمر ويمكنها ايضا ترسيب غشاء رقيق متعدد الطبقات وترسيب المواد ذات التركيب الكيميائى المعقد .
الملخص العربى تم ترسيب افالم اكسيد الزنك ) (ZnOالرقيقة على شرائح زجاج عند درجة حرارة الغرفة باستخدام تقنية ترسب الليزر النابض بحيث كان الهدف هومسحوق اكسيد الزنك النانومترى المحضر بطريقة الميكروويف .كال من افالم اكسيد الزنك المرسب ومسحوق اكسيد الزنك النانومترى المحضر تم معالجتهم حراريا فى الهواء لمدة ساعتين عند درجات الحرارة االتية 500, 450, 400, 350, 300 درجة مئوية .و تم دراسة تاثيرالمعالجة الحرارية على البنية البلورية والخواص الضوئية والكهربية لكال من افالم اكسيد الزنك الرقيقة ومسحوق اكسيد الزنك النانومترى بواسطة : -1مطياف حيود األشعة السينية ). (X-ray diffraction -9مطياف االشعة تحت الحمراء ). (Fourier Transform Infrared Spectroscopy -3المجهر االلكترونى النفاذ ). (Transmission Electron Microscope -4المجهر االلكترون الماسح ). (Scanning Electron Microscope -5مطياف االشعة فوق البنفسجية والمرئية ). (Ultraviolet/visible Spectroscopy -6مطياف اللمعان الضوئى ). (Photolumenescence Spectroscopy -7الموصلية الكهربية المستمرة ). (dc conductivity -8الموصلية الكهربية المترددة ). (ac conductivity كشف مطياف حيود األشعة السينية ) (XRDان كال من افالم اكسيد الزنك الرقيقة ومسحوق اكسيد الزنك التانومترى متعدد التبلور وان التركيب البللورى يكون على شكل سداسى و باستخدام معادلة شيرر وجد ان متوسط حجم البللورات ) (Dالفالم اكسيد الزنك الرقيقة والتى تم معالجتها حراريا تتراوح ما بين 5.22الى 10.61نانومتر اما فى حالة مسحوق اكسيد الزنك النانومترى فان متوسط حجم البللورات ) (Dيتراوح ما بين 25.7الى 36.4نانومتر. تم التأكد من وجود بللورات افالم اكسيد الزنك الرقيقة ومسحوق اكسيد الزنك النانومترى عن طريق مطياف االشعة تحت الحمراء) (FTIRحيث وجد ان قيم تردد الطاقة الصوتية البصرية )(υo تتراوح مابين 1.26 -1.58 x10¹³هرتز ألفالم اكسيد الزنك و 1.26 -1.3 x10¹³هرتز لمسحوق اكسيد الزنك التانومترى. اوضحت صورة المجهر االلكترونى النفاذ ) (TEMلفيلم اكسيد الزنك المعالج عند 400درجة مئوية ان بللورات اكسيد الزنك على شكل اقراص نانومترية وان متوسط قطر االقراص حوالى 12نانومتر .اما فى حالة مسحوق اكسيد الزنك المعالج عند 400درجة مئوية فان صورة المجهر
االلكترونى النفاذ اوضحت ان بللورات اكسيد الزنك على شكل قضيب نانومترى وان متوسط قطر القضيب حوالى 39نانومتر و متوسط طوله حوالى 388نانومتر. وفى حالة المجهر االلكترونى الماسح ) (SEMلفيلم اكسيد الزنك المعالج عند 400درجة مئوية تبين الصورة ان سطح الفيلم هو سطح خشن وان الحبيبات البللورية على شكل كروى .من ناحية اخرى فان صورة المجهر االلكترونى الماسح الكسيد الزنك النانومترى المعالج عند 400درجة مئوية تظهر كمية كبيرة من الحبيبات على شكل زهرة. باستخدام مطياف االشعة فوق البنفسجية والمرئية ) (UV/Vis spectroscopyوجد ان طاقة الفجوة البصرية ) (Egألفالم اكسيد الزنك تتراوح مابين 2.95الى 3.32الكترون فولت اما فى حالة مسحوق اكسيد الزنك النانومترى فان مستوى طاقة الفجوات ) (Evيتراوح مابين 2.37 – 2.25الكترون فولت. ومن قياس أطياف اللمعان الضوئى ) (PL spectroscopyألفالم اكسيد الزنك تظهر انبعاثات قوية للطيف فوق البنفسجى ،البنفسجي ،األزرق و االخضر وفى حالة مسحوق أكسيد الزنك النانومترى تبين أن جميع العينات تظهر انبعاث قوى لألشعة الفوق بنفسجية وانبعاث ضعيف جدا للطيف البنفسجي ،األزرق و االخضر. ومن دراسة التوصيلية الكهربائية ) (σdcالمستمرة وجد أن جميع العينات هي أشباه الموصالت سواء فيلم او مسحوق.وبحساب طاقة التنشيط ) (Wألفالم اكسيد الزنك وجد انها تتراوح ما بين0.093 الى 0.168إلكترون فولت .من ناحية أخرى ،وجد ان طاقة التنشيط ) (Wلمسحوق اكسيد الزنك النانومتر تتراوح ما بين 0.35الى 0.791إلكترون فولت. ومن دراسة التوصيلية الكهربية للتيارالمترددة ) (σacلمسحوق اكسيد الزنك المعالج حراريا لوحظ ان التوصيلية الكهربية للتيار المترددة ) (σacتزداد مع زيادة درجة حرارة المعالجة ويرجع ذلك الى زيادة كال من متوسط حجم البللورات وفجوات األكسجين مع زيادة درجة حرارة المعالجة .لوحظ ايضا ان التوصيلية الكهربية المترددة ) (σacتزداد مع زيادة درجة حرارة ويرجع ذلك الى زيادة حركة حامالت الشحنة مع زيادة درجة حرارة. وجد ان فيلم أكسيد الزنك المعالج حراريا فى الهواء عند درجة حرارة 400درجة مئوية لمدة ساعتان هو أفضل فيلم الستخدامه كأقطاب موصلة شفافة للخاليا الشمسية و للصمام الثنائي العضوي الباعث للضوء ( .)OLEDحيث شفافية الفيلم للضوء المرئى حوالي %90وطاقة التنشيط )(W حوالي 0.093الكترون فولت وقيمة الموصلية الكهربائية ) (σdcعند درجة حرارة الغرفة حوالى 382.7اوم 1 -متر.1 -