Comparing Two Interface Tools in Performing Visual Analytics Tasks Dong Hyun Jeong∗
Tera Marie Green†
William Ribarsky‡
∗‡§ Charlotte
† School
Visualization Center UNC Charlotte
A BSTRACT In visual analytics, menu systems are commonly adopted as supporting tools because of the complex nature of data. However, it is still unknown how much the interaction implicit to the interface impacts the performance of visual analysis. To show the effectiveness of two interface tools, one a floating text-based menu (FloatingMenu) and the other a more interactive iconic tool (InteractiveIcon), we evaluated the use and human performance of both tools within one highly interactive visual analytics system. We asked participants to answer similarly constructed, straightforward questions in a genomic visualization, first with one tool, and then the other. During task performance we tracked completion times, task errors, and captured coarse-grained interactive behaviors. Based on the participants’ accuracy, speed, behaviors and post-task qualitative feedback, we observed that although the Interactive-Icon tool supports continuous interactions, task-oriented user evaluation did not find a significant difference between the two tools because there is a familiarity effect on the performance of solving the task questions with using Floating-Menu interface tool. 1
I NTRODUCTION
In a recent paper by Green et al. [1] on the development of a human cognition model for visual analytics, they noted the importance of human interaction and flow of cognition in the model by suggesting that “intimate interactions deter attentional interference during the cognitive flow, and enables the reasoning process to move forward unabated.” Specifically, they mentioned that traditional menus cause considerable interruptions to an analyst’s flow, and argued that “visualization design should avoid, as much as possible, menus or other actions that take the user outside of the frame of the task. Interactions should be direct manipulation or closely attached (e.g., with buttons in or on the window). This would include pull-down menus, which require the human to sort through and think about menu items.” The statement against the use of traditional menus is clear, and it specifically makes mention of the high cost of using menus during an involved analysis process. However, in surveying literature in the HCI community on the cost and benefits of menus vs. direct manipulation icons, we find that the distinction between the two is not nearly as clear. In fact, Lim et al. [3] reported the results of an evaluation that directly compares these two systems (menu vs. direct manipulation icons) and found no time difference on task performance. The claim by Green et al. and the findings of Lim et al. appear to be contradictory on surface. However, a closer inspection of the evaluation procedures by Lim et al. reveals that the task used in their evaluation is trivial. The goal of this paper is therefore to perform a user study (task-oriented user evaluation) to ∗ e-mail:
[email protected]
† e-mail:
[email protected] ‡ e-mail:
[email protected] § e-mail:
[email protected]
Remco Chang§
of Interactive Arts and Technology Simon Fraser University
examine the use of these two interfaces in a complex analysis task involving the use of a visual analytical tool and determine whether the claim of Green et al. is valid, or if the finding of Lim et al. could be extended to complex visual analytical tasks as well. 2 2.1
S YSTEM GVis (Genomic Visualization)
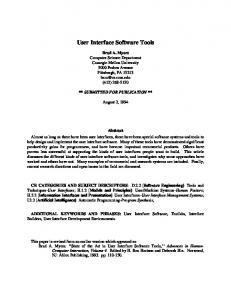
GVis [2] is an expert visualization system (a zoomable interface) that helps bioinformaticians support the visual analysis of largescale phylogeny hierarchies populated with the genomic data of various organisms. It uses a publicly available biological database (GenBank) hosted by the National Center for Biotechnology Information (http://www.ncbi.nlm.nih.gov/) to picture the phylogeny hierarchies of organisms and allows the user to quickly browse the hierarchy from the highest-level, base categorization down to the level of individual genome for the desired organism of interest . Figure 1(a) shows a system overview; phylogenic hierarchies are represented in spheres, and each organism is directly mapped within that sphere. On top of GVis, two menu tools were designed: Floating-Menu and Interactive-Icon. Depending on the chosen option, relevant information is represented as shown in (b) and (c). However, representing 18,000 citations, in addition to relevant organismic information in a limited display space is not feasible. Therefore, an aggregation technique was utilized to make the visualization both complete and scalable. If an organism is located in the lower level of the phylogeny, the represented information is too small to be perceived; aggregation is then automatically applied to show such information within the organization of the higher categorizational level. Figure 1(b) and (c) shows related citations grouped by year and organism. 2.2
Menu Systems
Floating-Menu System Because of data complexity, most visual analytics applications commonly adopt traditional text-based menus (e.g. pull-down, pop-up) to support changing display views and system functionality. However, in a scalable, complex visualization, the size of the menu can become illegibly small. Because of the reason, GVis’ Floating-Menu is designed to act similarly the pop-up menu system, but without linking the menu to a static object, the menu “floats” over the visual space, and can be easily grabbed and moved out of the way. Interactive-Icon System The Interactive-Icon tool seeks to minimize the use of text and the need for a separate menu. It uses six icons, each placed around the circumference of the organism’s sphere (see Figure 1(c)). Unlike the Floating-Menu’s radio buttons, the icons are dragged and dropped to the area of interest. For example, if the user wants to see the relevant information related to organism A, then an icon needs to be dropped in the region between the organism A and its subgroup organism(s). However, each icon does not represent data itself nor the data’s symbolic meaning the way traditional icons do. Instead, it represents an operation to be performed (see Figure 1(c)).
(a)
(b)
(c)
(d)
(e)
(f)
Figure 1: The system overview (a). (b) and (c) show two different interfaces as Floating-Menu and Interactive-Icon. Based on user’s selection within the interface, it shows a detail information related to each organism group. Three study results: (d) Accuracy, (e) Ease of use and ease of learning, and (f) Grades on a scale of ‘A’ to ‘F’.
3
C OMPARATIVE S TUDY
We conducted a task-oriented, within-subject study to explore which interface tool was more effective. 31 participants (twelve males and nineteen females) performed a total of six performance tasks, 3 with each interface tool. All participants were taking an introductory psychology course, and received course credit for participation. Students self-reported that they all were unfamiliar with visualization. After a brief introduction to GVis, participants were administered a brief web questionnaire containing demographic questions about gender, academic major, interface familiarity, as well as computer and video game usage. Before beginning the study, participants were given a tutorial about the tool they were about to use, including how to utilize the tool’s basic functionalities. The participant was then requested to answer four training questions with the tool; these questions were designed to introduce participants to essential functionalities of the tool. After training, two task sets were administered to measure the effectiveness of each tool during task performance. The order in which the participants used each tool was counterbalanced; roughly half of the participants were randomly assigned to use the Interactive-Icon tool first, and the other half used the Floating-Menu first. These task sets were carefully created to maintain the same level of difficulties across the sets: the first question in each set was the easiest to solve, the second question was moderately difficult, and the last question was designed to be the most difficult. 4
R ESULTS
Based on the results of our comparative user study, we found that there was no significant difference in the results of the participants’ accuracy while solving each task using both interface tools (p = 0.23) (see Figure 1(d)). On average, participants spent about 174 seconds using Floating-Menu, and 204 seconds using InteractiveIcon. In the post-task questionnaire, participants were requested to report the difficulty and helpfulness of the interface tool in solving each task. About 60% (18.6 ± 0.5 for each task) of the participants reported all 3 tasks to be “easy” or “very easy” when using FloatingMenu. On the other hand, only 43% (13.3 ± 4.0 for each task) of the participants identified all three tasks as being “easy” or “very easy” when using Interactive-Icon. The question asking about the helpfulness of each tool, about 74% (23 ± 3.6 for each task) of the participants identified Floating-Menu to be “helpful” or “very helpful” in solving the tasks, and about 65% (20 ± 3.6 for each task) of the participants found Interactive-Icon to be “helpful” or “very helpful”. From the post-study questionnaire, we found that about 67% (21) and 51% (16) of the participants rated that Floating-Menu and Interactive-Icon were easy to use, respectively (see Figure 1(e)). A positive significant correlation was found between ease of use and task accuracy (r(185) = .21, p = .0035), as well as between ease of
learning and task accuracy (r(185) = .28, p = .0001)). However, the overall time spent in solving each task showed no statistically significant correlation (Ease of use: p = .174 and ease of learning: p = .429). After completing both series of tasks, each participant was asked to rank the two tools, indicate which tool was preferred, and describe what was liked and disliked about each tool. Overall, there was no significant difference between the preference feedback of one tool over the other (see Figure 1(f)). 5 C ONCLUSION AND F UTURE WORK This study was designed to answer the specific question of whether menus or direct manipulation icons are more effective in complex visual analytical systems. In answering this question, we examined the efficiencies of the tools based on task-oriented user evaluation. Our findings demonstrate that the two tools, Floating-Menu and Interactive-Icon, perform practically the same both quantitatively and qualitatively. In measuring time and accuracy, performance times and accuracy rates while using the Floating-Menu were slightly better than the Interactive-Icon, but the difference was not statistically significant. In the user’s self-reported evaluation, there is also no difference in ease of use, ease of learning, preference, difficulty, and helpfulness. In comparing Green et al.’s claim that menus cause considerable interruption to the analysis process, and Lim et al.’s reports that menus and direct manipulation icons are not comparable in performance, our findings seem to support the latter claims. In truth, Lim et al.’s findings and our study results seem to reinforce the generally-held idea that task-oriented user evaluation method is not always helpful in finding the more effective or efficient interfaces, as there might be other factors (such as familiarity effect, cognitive flow, etc.) that have a greater role in determining tool superiority than we can currently account for. These studies and the considerations and analysis they engendered in this paper have set the stage for significant new work. Based on this analysis, we and others can now undertake deeper and more careful studies on the relationships between interaction, cognitive flow, and the reasoning process. This is a central research issue for visual analytics. R EFERENCES [1] T. Green, W. Ribarsky, and B. Fisher. Visual analytics for complex concepts using a human cognition model. In Visual Analytics Science and Technology, 2008. VAST ’08. IEEE Symposium on, pages 91–98, Oct. 2008. [2] J. Hong, D. H. Jeong, C. D. Shaw, W. Ribarsky, M. Borodovsky, and C. G. Song. Gvis: A scalable visualization framework for genomic data. In K. Brodlie, D. J. Duke, and K. I. Joy, editors, EuroVis, pages 191–198. Eurographics Association, 2005. [3] K. H. Lim, I. Benbasat, and P. A. Todd. An experimental investigation of the interactive effects of interface style, instructions, and task familiarity on user performance. ACM Trans. Comput.-Hum. Interact., 3(1):1–37, 1996.