MARINE ECOLOGY PROGRESS SERIES Mar Ecol Prog Ser
Vol. 244: 89–93, 2002
Published November 29
Comparison of abundance and spatial distribution of burrowing megafauna from diver and remotely operated vehicle observations David M. Parry1, 3,*, Lois A. Nickell4, Michael A. Kendall3, Michael T. Burrows4, Derek A. Pilgrim1, Malcolm B. Jones2 1
Institute of Marine Studies, and 2 School of Biological Sciences, University of Plymouth, Plymouth, Devon PL4 8AA, United Kingdom 3 Plymouth Marine Laboratory, Prospect Place, Plymouth, Devon PL1 3DH, United Kingdom 4 Dunstaffnage Marine Laboratory, Oban, Argyle PA34 4AD, Scotland, United Kingdom
ABSTRACT: The standard method for collecting information on both the abundance and distribution of surface-dwelling megafauna, and biotic sediment-features associated with burrowing megafauna has been direct observation and counting by divers. However, remote observations allow information comparable to diver observations to be applied to investigations at greater depths and over wider spatial extents than divers may achieve. The present paper compares abundance estimates of megafaunal biotic sediment-features obtained from diver and remotely operated vehicle-mapping techniques. Results show strong agreement between estimates of total-feature and conspicuousfeature abundance, providing assurance that remote observation techniques are not subject to systematic errors in estimation of feature abundance. The ability to detect the smallest features appeared to differ between observation techniques, but this was an artefact caused by measurement of features rather than feature detection. A laser diode array attached to the camera to quantify image scale increased the amount of quantitative data that may be extracted from remote images. KEY WORDS: Megafauna · SCUBA diving · Remotely operated vehicle · Spatial variation · Image scaling Resale or republication not permitted without written consent of the publisher
INTRODUCTION A number of hypotheses may be invoked to explain the role of bioturbation in the structure and maintenance of biodiversity within soft-sediment assemblages (Connell 1978, Huston 1979, Brenchley 1981, Grassle & Morse-Porteous 1987). Although these hypotheses consider disturbance as a function of amplitude and frequency, the mode of bioturbation by different species may elicit different community responses (Widdicombe et al. 2000). Therefore the identity, abundance and spatial distribution of bioturbating species must be considered when attempting to *Email:
[email protected] © Inter-Research 2002 · www.int-res.com
understand the dynamics of soft-sediment assemblages. Unfortunately, traditional grab sampling significantly underestimates the abundance of largerbodied organisms (Kendall & Widdicombe 1999), so alternative methods are required to accurately sample this fraction of the benthic fauna. Many bioturbating species inhabit burrows and tubes that produce characteristic openings or features on the sediment surface, from which information on their abundance and local distribution may be inferred from direct observations by SCUBA divers (Nash et al. 1984, Atkinson & Nash 1990, Atkinson et al. 1998). However, there is a growing need to increase the extent of such observations to monitor and predict larger-scale diversity patterns.
90
Mar Ecol Prog Ser 244: 89–93, 2002
tions is muddy sand; current speeds are generally low. Loch Creran supports low densities of large megafaunal species such as Nephrops norvegicus and Maxmuelleria lankesteri, while Jennycliff Bay supports high megafaunal densities, characterised by thalassinidean shrimp (Upogebia deltaura and Callianassa subterranea), Goneplax rhomboides and several large bivalve species. Survey design. Four survey plots were established at 10 to 15 m depth at each location. Each plot consisted of a 3 × 3 m steel frame subdivided into a grid of 50 × 50 cm to assist with mapping. The plots were fixed by embedding steel legs at each corner of the frame firmly into the sediment. Biotic features counted included burrows, tubes and all surface-dwelling megafauna. The identity of species responsible for burrow construction was determined where possible using the morphological characteristics described by Marrs et al. (1996). Divers mapped the identity, size and location of biotic features within survey plots onto slates, while similar maps were generated from the videotape that was recorded as the ROV was flown over the same area. The interval between diver and ROV surveys in Loch Creran was 5 d, while Jennycliff Bay plots were surveyed by both techniques within the hour. The ROV camera was fitted with the ABISS (automated benthic image scaling system), a structured lighting array that is used for image scaling (Pilgrim et al. 2000). Four laser diodes were aligned in parallel to project the corners of a square of known dimensions, at any camera-object distance, when the substratum was perpendicular to the camera’s optical axis. A fifth laser MATERIALS AND METHODS was aligned obliquely in the same plane as the bottom pair of parallel lasers and was used to calculate camSite description. Two locations were chosen that era-object distance. As camera orientation with respect supported different megafaunal densities. The location to the substratum changes, the parallel laser spots and identity of biotic features within survey plots projected onto the seabed appear as a trapezium in were mapped in Loch Creran, Scotland (56° 32.9’ N, images recorded onto videotape. Benthic Imager soft05° 16.1’ W) and Jennycliff Bay, Plymouth Sound ware (University of Plymouth, UK; Pilgrim et al. 2000) (50° 21.0’ N, 04° 07.8’ W). The substratum at both locaanalyses the laser spot pattern to calculate camera orientation and allow real Table 1. Mean (± 95% CI) biotic-feature abundance estimates in survey plots measurements of features to be taken (9 m2) derived from diver and remotely operated vehicle (ROV) observations. Number of plots: Loch Creran = 4; Jennycliff Bay = 1. Differences between from each still image. Consequently, observation techniques were tested with non-parametric Wilcoxon signed-rank still images were selected and captest (p-values in parentheses); na = test not applicable tured from the videotape such that the entire survey plot was represented Diver ROV Wilcoxon signed-rank to allow measurement of all biotic feaestimate estimate test statistic tures observed. The biotic-feature maps produced by Loch Creran Total features 70.8 ± 7.8 65.8 ± 6.7 0.55 (0.58) divers and from ROV observations Conspicuous features 29.5 ± 7.2 25.8 ± 7.9 1.28 (0.20) were digitised using Scion Image softFeatures >15 mm diameter 64.0 ± 8.0 32.0 ± 8.3 1.64 (0.10) ware (Scion), from which feature coJennycliff Bay ordinates were extracted. Scion Image Total features 635 621 na software also provided the dimenThalassinidean ejecta mounds 14 4 na sions of feature symbols in the diverThe deployment of underwater cameras mounted on remotely operated vehicles (ROVs) permits such information to be collected beyond the depth and spatial extent achieved by SCUBA divers, whilst providing non-destructive sampling with greater control of observations than is possible with cameras mounted on towed vehicles. ROV observations normally produce qualitative abundance estimates because a standardised image area cannot be maintained in the same way as for vehicles towed in contact with the substratum (Elliott 1991). Recent technological developments calculate image scale by analysing the pattern of spots projected by a diode laser array (Pilgrim et al. 2000), which permits extraction of quantitative data from ROV images. However, a comparison between diver observations and remote observations is required before remote observations may be used with confidence to investigate larger-scale (100s of metres) megafaunal spatial distribution patterns. Such comparisons would indicate the possible extent of errors that might be present in deep-water studies that rely on image analysis alone. The study reported here was intended to assess the agreement between estimates of megafaunal abundance made from diver and ROV observations by comparing (1) total feature abundance, (2) the spatial coincidence between estimates, and (3) the identification of features within clearly defined plots from 2 shallow subtidal soft-sediment environments.
Parry et al.: Comparison of diver and ROV-derived megafaunal abundance estimates
generated maps, while the dimensions of features observed by ROV were extracted from the still images in conjunction with Benthic Imager software. Data analysis. A comparison between methods was achieved by counting the total number of biotic features of each type within each grid cell, which represented the minimum sample grain (i.e. 0.25 m2; Wiens 1989). To assess the ability of each technique to detect different size fractions of the megafauna, total bioticfeature abundance data were re-classified to generate abundance estimates of ‘conspicuous features’ and ‘all features >15 mm diameter’ groups for each survey plot. The ‘conspicuous feature’ group consisted of the Norway lobster Nephrops norvegicus, echiuran worm Maxmuelleria lankesteri, sea pen Virgularia mirabilis, polychaete worm Myxicola infundibulum, funnelshaped openings and large circular holes without a funnel. Megafaunal features were assigned to the ‘features >15 mm diameter’ group for either diver or ROV observations using feature measurements extracted from Scion Image or Benthic Imager software respectively. Analyses were performed at a range of sample grain sizes, which were obtained by aggregating adjacent grid cells (to give sample grains of 0.5 and 1.0 m2), to investigate whether larger samples minimise errors due to parallax. The extent of agreement between diver and ROV-derived estimates of biotic-feature abundance was examined using the Bland & Altman method, a descriptive technique in which the difference between abundance estimates is plotted against the mean of the 2 estimates for each sample (Bland & Altman 1986). The difference between estimates was calculated by subtracting the diver abundance estimate from the ROV abundance estimate; hence positive values indicate that more features were observed in ROV images. The Bland & Altman method was preferred to product-moment correlation as it indicates the extent of bias (the average difference between estimates) rather than demonstrating covariance; it is also independent of the range of the data (Bland & Altman 1986).
91
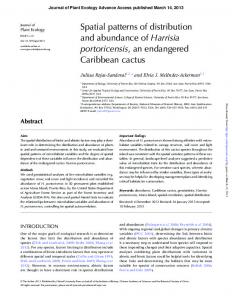
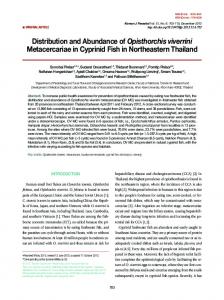
In Jennycliff Bay, high feature density and restricted time for SCUBA diving limited observations by both diver and ROV to a single survey plot. The biotic features present in the Jennycliff Bay assemblage had similar dimensions, so different size fractions were not examined. Qualitative assessment of total bioticfeature abundance data in Jennycliff Bay suggested that diver and ROV-derived estimates were similar (Table 1). Thalassinidean ejecta mounds were the only features detected by an experienced diver more effectively than by ROV in Jennycliff Bay. In both locations, the limits of agreement between abundance estimates widened slightly as sample grain increased (Figs. 1 & 2), but the mean abundance estimate also increased. Data points that fell outside the limits of agreement at 0.25 m2 sample grain approached the methodological bias as samples were aggregated, which indicates that the effects of parallax on abundance estimates decreased as sample grain increased. Variation associated with the difference
RESULTS In Loch Creran, there were no significant differences in abundance estimates made by divers and from ROV images for either total biotic features, conspicuous features or features >15 mm at the scale of the entire grid (Table 1). Similarly, there was no between-method bias in estimates of total biotic and conspicuousfeature abundance. However, ROV estimates of ‘features >15 mm diameter’ were consistently lower than those derived from diver observations at the sub-grid scale, which suggests a methodological bias.
Fig. 1. Bland and Altman plots of difference against mean for estimates of total biotic-feature abundance in Loch Creran plot CR3 with increasing sample grain. Dashed line represents mean difference between diver and ROV abundance estimates (i.e. bias). Dotted lines represent limits of agreement that equal mean difference between estimates ± 2 SD
92
Mar Ecol Prog Ser 244: 89–93, 2002
Fig. 2. Bland and Altman plots of difference against mean for estimates of total biotic-feature abundance in the Jennycliff Bay plot with increasing sample grain. Dashed line represents mean difference between diver and ROV abundance estimates (i.e. bias). Dotted lines represent limits of agreement that equal mean difference between estimates ± 2 SD
between abundance estimates (y-axis) at larger grain sizes indicated that some biotic features had not been detected by both observation techniques, while variation between mean abundance estimates (x-axis) indicated variation of the spatial distribution of biotic features.
DISCUSSION There was no significant difference between abundance estimates of total biotic features, conspicuous features or features >15 mm made by direct diver observation and ROV imaging in 2 shallow unvegetated sedimentary environments. Although remote observations appeared to consistently underestimate the abundance of smaller features, this was an artefact caused by measurement of features rather than feature detection because there was strong agreement between total biotic-feature abundance esti-
mates. Feature dimensions were extracted from the diver maps by measuring the size of the object drawn in situ, while measurements of features in the ROVgenerated map were made from still images of the features themselves. The ABISS is capable of measurements that are accurate to ± 5% (Pilgrim et al. 2000), while divers are known to significantly overestimate the size of objects (Ross 1989). Greater confidence must, therefore, be placed in the dimensions of features measured from remote images. Although the standard method for quantification of megafaunal biotic features has been direct observation by divers, remote observation techniques extend biological survey to greater depths than divers may achieve. The results presented here provide assurance that there is no systematic error associated with remote survey estimates of biotic feature abundance. As a result, the confidence that may be applied to deeper-water investigations of megafaunal diversity, bioturbational activity, standing stock, production or energy flux is increased. Much of the variability within the data presented here can be accounted for by the different ways in which divers and camera systems observe the seabed. In the present study, survey frames were deployed close to (but not in contact with) the seabed to minimise sediment resuspension. The frame was a considerable aid when diver-mapping; the divers can position themselves directly above the grid nodes to look vertically down. Conversely, the ROV camera was oriented obliquely to the sediment surface causing small differences in abundance estimates due to parallax at the edges of the smallest grid cell size. The effect of parallax diminished as sample grain size increased because the sample area:sample perimeter ratio decreased. The variation between abundance estimates that could not be explained by parallax was due to features that were not observed by one or other of the survey techniques. Biotic features that were omitted by one or other of the survey techniques do not necessarily represent lack of agreement between diver and ROV observations, as there was no consistent pattern to suggest systematic bias between either technique. The features that were responsible for the variation were all approximately 2 cm in diameter. Since significant temporal variation in feature abundance may occur within 24 h in Loch Creran, these small features may have been generated and/or eradicated during the inter-survey interval. The ability to apply scale to the still ROV images using the laser array allowed feature measurement, which assisted with their identification and may be used to infer size distributions of the burrowing fauna.
Parry et al.: Comparison of diver and ROV-derived megafaunal abundance estimates
In the present study, we made observations within metal frames. However, the ABISS permits abundance estimates to be expressed as absolute density estimates without needing the deployment of frames or other scaling aids. The laser array also provides a visual reference that assists the pilot to maintain camera orientation, thus maintaining absolute resolution, to increase the amount of quantitative data that may be extracted from remote images. The high agreement between diver and ROV estimates at Jennycliff Bay suggests that remote observations may be most cost-effective where feature density is high because the same area may be surveyed in a fraction of the time required by diver observations. Divers were able to detect features characterised by subtle changes in bottom topography, such as thalassinidean ejecta mounds, more effectively than with ROV, as they were able to manipulate features and change the angle of observation to gain information on the fauna. Detection of features characterised by subtle changes in bottom topography could be enhanced by more oblique camera and illumination angles that would cast shadows onto the seabed. The concordance between abundance estimates derived from diver and ROV observations at both sites indicates that remote observations may be used to obtain accurate estimates of biotic-feature abundance from unvegetated sediment environments that are not accessible to direct diver observation.
93
LITERATURE CITED
Acknowledgements. The authors wish to express their gratitude to Steve Widdicombe, Mel Austen and Rob Wood for their diving expertise and to the crews of RV ‘Tamaris’ and RV ‘Soel Mara’ for their assistance during fieldwork. We also thank Dr Chris Ricketts for valuable statistical advice and 3 anonymous referees for constructive comments that improved a previous draft of the manuscript. Financial support was provided by the Natural Environment Research Council (04/98/MS/233 to D.M.P.) and the UK Department for Environment, Food and Rural Affairs (DEFRA) under Contract CDEP 84/5/295 and AE 1137 for rapid assessment of marine biodiversity (RAMBLERS). This paper is a contribution to the Coastal Biodiversity Projects at Plymouth Marine Laboratory and Dunstaffnage Marine Laboratory.
Atkinson RJA, Nash RDM (1990) Some preliminary observations on the burrows of Callianassa subterranea from the west coast of Scotland. J Nat Hist 24:403–413 Atkinson RJA, Froglia C, Arneri E, Antolini B (1998) Observations on the burrows and burrowing behaviour of Brachynotus gemmellari and on the burrows of several other species occurring on Squilla grounds off Ancona, central Adriatic. Sci Mar 62:91–100 Bland JM, Altman DG (1986) Statistical methods for assessing agreement between two methods of clinical measurement. Lancet 1:307–310 Brenchley GA (1981) Disturbance and community structure: an experimental study of bioturbation in marine softbottom environments. J Mar Res 39:767–790 Connell JH (1978) Diversity in tropical rain forests and coral reefs. Science 199:1302–1309 Elliott M (1991) Summary of discussions, conclusions and recommendations of the Imaging Methods in Benthic Ecology Workshop. In: Keegan BF (ed) COST 647 coastal benthic ecology, Activity Report 1988–1991. Commission of the European Communities, Brussels, p 348–352 Grassle JF, Morse-Porteous LS (1987) Macrofaunal colonisation of disturbed deep-sea environments and the structure of deep-sea benthic communities. Deep-Sea Res Oceanogr A 34:1911–1950 Huston MA (1979) A general hypothesis of species diversity. Am Nat 113:81–101 Kendall MA, Widdicombe S (1999) Small scale patterns in the structure of macrofaunal assemblages of shallow soft sediments. J Exp Mar Biol Ecol 237:127–140 Marrs SJ, Atkinson RJA, Smith CJ, Hills JM (1996) Calibration of the towed underwater TV technique for use in stock assessment of Nephrops norvegicus. Final Report to the European Commission 94/069, University Marine Biological Station, Millport, UK Nash RDM, Chapman CJ, Atkinson RJA, Morgan PJ (1984) Observations on the burrows and burrowing behaviour of Calocaris macandreae (Crustacea: Decapoda: Thalassinoidea). J Zool Soc 202:425–439 Pilgrim DA, Parry DM, Jones MB, Kendall MA (2000) ROV image scaling with laser spot patterns. Underwat Tech 24: 93–103 Ross HE (1989) Orientation, movement and motor skills in divers. Prog Underw Sci 13:147–167 Widdicombe S, Austen MC, Kendall MA, Warwick RM, Jones MB (2000) Bioturbation as a mechanism for setting and maintaining levels of diversity in subtidal macrobenthic communities. Hydrobiologia 440:369–377 Wiens JA (1989) Spatial scaling in ecology. Funct Ecol 3: 385–397
Editorial responsibility: Otto Kinne (Editor), Oldendorf/Luhe, Germany
Submitted: October 8, 2001; Accepted: August 1, 2002 Proofs received from author(s): October 28, 2002