Physiological Psychology. 1984, Vol. 11 (4), 243-250. Comparison of cardiovascular and behavioral responses to near-threshold acoustic stimuli in baboons.
Physiological Psychology 1984, Vol. 11 (4), 243-250
Comparison of cardiovascular and behavioral responses to near-threshold acoustic stimuli in baboons JAYLANS. TURKKAN and ROBERT D. HIENZ The Johns Hopkins University School of Medicine, Baltimore, Maryland Three male baboons were trained to respond in an auditory psychophysical procedure to obtain reliable estimates of their auditory thresholds. Subsequently, animals were implanted with femoral catheters and retested at near-threshold levels of a 1.0-kHz tone. Beat-by-beat information was obtained on changes in interbeat interval (IBI) and both systolic and diastolic blood pressure (SBP and DBP) during tone presentations. IBIs decreased as stimulus intensity increased when animals correctly detected the stimuli, whereas no changes in IBI occurred when the animals did not detect the stimuli or when the response lever was removed in a probe session. No changes in SBP were observed, and one animal showed significant increases in DBP as stimulus intensity increased. Thresholds estimated from the overall functions relating changes in IBI to changes in stimulus intensity were approximately 7-9 dB higher than thresholds estimated from behavioral psychometric functions. Sensory psychophysical detection experiments that have also measured cardiovascular responses have taken two directions. One area of research has studied how cardiovascular variables affect the detection of stimuli (e.g., Lacey & Lacey, 1970). Such studies have, for example, manipulated cardiovascular levels by altering heart rate (e.g., Saxon & Dahle, 1971) or have presented stimuli at different portions of the cardiac cycle (Birren, Cardon, & Phillips, 1963). The second body of research has studied how stimulus detection affects cardiovascular responses, with an eye toward using cardiovascular measures as "objective" indices of sensory detection (e.g., Gerber, Mulac, & Lamb, 1977; T. Suzuki, 1978; Zeaman & Wegner, 1956). These studies have manipulated stimuli along an intensity or frequency dimension and examined functional relationships with cardiovascular changes. For auditory detection in particular, such overt behavioral indices as the' 'I heard it," the head nod, or a hand raise have long been used to assess hearing, while such physiological responses as respiration (Walter & Porges, 1976), brainstem evoked responses (J. Suzuki & Yamane, 1982), or heart rate changes (Butterfield, 1962) have been more or less neglected. Although there is general agreement that cardiovascular response magnitude can vary directly with stimulus intensity at The authors would like to thank M. Woodland, A. Heaton, M. Kuduk, D. Bowers, R. Wurster, and R. Atkinson for technical assistance. They also thank Ron Ray for statistical consultation. This research was supported by a Cooperative Agreement with the United States Environmental Protection Agency (No. CR 808567). Reprints can be obtained from the fIrst author at the Department of Psychiatry and Behavioral Sciences, The John Hopkins University School of Medicine, 72J) Rutland Avenue, Baltimore, Maryland 21205.
suprathreshold intensities (e.g., Suzuki, 1978; Zeaman & Wegner, 1956), there has been some controversy regarding the use of cardiovascular changes (principally heart rate changes) as an index of stimulus detection at near-threshold levels of auditory stimuli (Borton & Smith, 1980). The present study addressed this problem by providing data on the correlations among changes in heart rate, blood pressure, and a behavioral detection response in nonhuman primates during the performance of a psychoacoustic threshold-detection procedure. METHOD Subjects The subjects were three male baboons (Papio cynocephalus), weighing 17-22 kg. None of the animals had any history of acoustical or other trauma. One of the subjects (SI) previously had received intramuscular injections of ketamine twice weekly for 6 weeks in an unrelated experiment. All subjects were TB tested at 3-month intervals with ketamine used as a tranquilizer. The anima1s were maintained on a 22-h restricted feeding regimen with supplemental monkey chow and fresh fruit provided daily after experimental sessions. Apparatus During threshold training and testing sessions, each anima1 was housed in a double-walled foam-insulated concrete-block acoustical chamber with inside dimensions of 1 x 1.3 x 1.7 m. The attenuation characteristics of each chamber ranged from 60 dB at 250 Hz to greater than 100 dB at 2 kHz and above. A 76 x 97 cm intelligence panel inside the chamber contained a response lever, a red cue light, and a tube feeder for delivery of banana pellets. With the animal positioned facing the panel, the response lever rested in front of the animal's right hand, and the feeder tube in front of his mouth. Acoustic stimuli were delivered via an Altec wide-range speaker suspended from the ceiling and located directly over the animal's head approximately SO.5 cm above ear level. Pure-tone signals were generated by a Leader oscillator passed through a Coulboum electronic switch (20-msec rise and fall times)
243
Copyright 1984 Psychonomic Society, Inc.
244
TURKKAN AND HIENZ
and programmable attenuator, a Crown D-75 amplifier, and the speaker. The system was calibrated with a General Radio soundlevel meter (No. 1981B) by a O.S-in. condenser microphone placed at ear level where the baboon's head would normally be and at a 9O-deg incidence angle to the sound source. A specially designed microcomputer system was employed as an on-line data processor for transmitting real-time beat-by-beat physiological information to a larger DEC PDP-81B minicomputer system, which in turn controlled the experiment and stored all physiological and behavioral data on hard disk for later evaluation and statistical analysis. The microcomputer system employed a high-speed Burr-Brown AID converter that was software controlled to provide a sampling rate of 303 samples/sec for each variable, selected to ensure accurate detection of the systolic and diastolic components of the pressure wave. Procedure A reaction time procedure (Hienz, Turkkan, & Harris, 1982) was employed in which a flashing red cue light signaled the start of each trial. A baboon pressed the lever to initiate a trial, signaled by the flashing light becoming steady. The animals were trained to continue holding the lever down, releasing the lever only when a tone burst (1.5 sec duration) was presented from the overhead speaker. Each tone burst was programmed to occur randomly between 1.0 and 7.3 sec after initiation of the lever-holding response. Lever releases during the I.S-sec tone period were dermed as correct stimulus detections and were reinforced by the immediate delivery of one or two banana-flavored food pellets. Releases prior to or after the tone period were not reinforced. All trials were separated by a I-sec intertrial interval (ITI), during which the cue light was off; responses during the ITI delayed the next trial by 1 sec. Auditory thresholds were determined by randomly varying the intensity of the test stimuli from trial to trial for a block of 140 trials, with four to five such blocks comprising each session. Four intensity levels, 10 dB apart, were randomly presented at a testtone frequency of 1.0 kHz. Interspersed among these trials were catch (no-tone) trials, which occurred randomly with a probability of .2. These trials were used to determine the false-a1arm rate of each subject. Thresholds were corrected for such "guessing" by defining the threshold as that intensity producing a detection score halfway between the false-alarm rate and 100070. Four to five such threshold estimates were obtained during each session. For all animals, testing was conducted until performance stability was obtained, as indicated by stable thresholds (± 2 dB), false-alarm rates below 20'10, and no systematic trends in the data. For two subjects (AL and MA), auditory threshold functions for frequencies ranging from .62 to 40.0 kHz had been previously published (Hienz et aI., 1982). Subject SI had been previously tested at frequencies ranging in octave steps from .250 to 16.0 kHz. SUl'lery After stable performances were obtained, the anima1s underwent surgery for arterial catheterizatiol' in order to measure systolic and diastolic blood pressure (SBP, DSP) and interbeat intervals (IBis) on every heart beat. A silicone coated polyvinyl catheter was inserted into the femoral artery under 1.75'10 halothane anesthesia according to a surgical procedure adapted from Werdegar, Johnson, and Mason (1964). The distal end of the catheter was tunneled under the skin, exited in the interscapular area, and was fitted with an 18-ga Luer stud adapter. The arterial catheter was connected to a Statham transducer (p23De) mounted at heart level. The proximal end of the arterial catheter was advanced to just above the iliac bifurcation and below the renal arteries. Patency of the arterial catheter was maintained by a continous infusion of heparinized saline (5,000 USP units per liter) at a constant rate of 4 ml/h, and by a more rapid infusion (125 ml/h) for one min once each day. Daily calibration of the system was accomplished without dismantling the components by integrating a mercury manometer through a series of three-way valves (Findley, Brady, Robinson, & Gilliam, 1971).
After a 2-week surgical recovery period, auditory thresholds were redetermined at 1.0 kHz using the reaction time procedure. In the postsurgical series of sessions, the behavioral procedure was modified so that the pretone foreperiod was synchronized to end at a heart beat occurrence. This synchronization of tone onset with a heart beat prevented tones from occurring at varying portions of the cardiac cycle, a manipulation that has been shown to affect reaction time performance (e.g., Birren et al., 1963). Data Analysis From each tone presentation trial, values for IBI, SBP, and DBP were obtained at the last pretone heart beat, all complete heart beats during the tone presentation, and the first posttone heart beat. Change scores were used as an index of cardiovascular response magnitude. IBI change scores were calculated by subtracting the first IBI after tone onset from the preceding pretone IBI. Positive changes indicate heart rate acceleration; negative changes indicate deceleration. Systolic and diastolic blood pressure changes were calculated by subtracting the last pretone pressure value from the first tone pressure value, with positive changes thus indicating increases in blood pressure. Reaction times typically ranged from 400-1,000 msec. When reaction times were short, the first heart beat after tone onset (first tone beat) often fell into the posttone beat category. Data presented in the results section for cardiovascular changes during the tone period are based upon the first tone beat only.
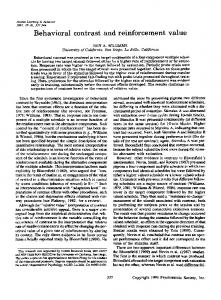
RESULTS Figure 1 illustrates changes in both signal detectability and reaction time. Mean percent correct lever releases (Figure 1, left) and average median reaction time for correct releases (Figure 1, right) are shown as a function of the intensity of a 1.0-kHz tone for the three subjects. All subjects showed increases in signal detectability as tone intensity increased, describing familiar psychometric functions. The displacement of these functions along the abscissa indicates differences in threshold sensitivity among the animals, with Subject AL the most sensitive and Subject SI the least sensitive. Behavioral thresholds, defined as that intensity producing a detection level halfway between the catch trial rate and 100070, were -0.8, 4.9, and 16.S dB SPL for Subjects AL, MA, and SI, respectively. Reaction time, on the other hand, generally decreased as stimulus intensity increased, with reaction times approaching asymptote at the highest stimulus intensity employed. Cardiovascular responsiveness during the same sessions is plotted in Figure 2, where IBI (left), SBP (center), and DBP (right) change scores are shown as a function of tone intensity for the three subjects. Since not all subjects received the same tone intensities, a within-subject repeated measures analysis of variance was used to assess the significance of the cardiovascular changes. For all three subjects, the magnitude of IBI response increased with increasing tone intensity. Since pretone IBIs were constant across tone intensities, this indicates an increasingly accelerative heart rate response to tones [Subjects AL, MA, and SI yielded F values (4,8) of 10.47, 26.93, and 11.10, respectively; p < .01 in all cases].
245
CARDIOVASCULAR RESPONSES TO TONES 1000
100
...
"j j..
80
()
~
II:
0
60
w
40
...Z ()
~
e
/ / / ' a-e-o
~ 20
e
0
•
• I
..L.
I
-8
CATCH
I
2
12
.
800
w
~~I •
~
Z
~
600
()
< w
II:
,
I
22
32
,
"----
,
400_
I
-8
42
I
I
22
12
2
.
"----0
"---- e
,
,
32
42
INTENSITY ( dB SPl )
Figure 1. Mean percent correct lever releases (left) and average median reaction time (right) as a function of tone intensity for three subjects. Each data point is the average of three sessions. Catch (no tone) trial response levels are shown to the left. 220 160 140
INTERBEAT INTERVAL
lliJ "~ O.
.f/"
W
~'00 00
20 -20
t
j.
SYSTOLIC BLOOD PRESSURE
";;:/
•
CATCH
0
,
co J:
~
0
/