clinical linguistics & phonetics, 2002, vol. 16, no. 2, 135± 147
Comparison of methods in speech acquisition research C . B O W ² , P . B L A M E Y ² , L . PA AT S C H ² a n d J. SARANT³ ² Department of Otolaryngology, University of Melbourne, Australia ³ Bionic Ear Institute, Melbourne, Australia (Received 11 September 2001; accepted 12 November 2001)
Abstract The paper examines the eŒect of choices involved in speech acquisition research among children with impaired hearing. Choices involving transcription method, sampling procedures, subject selection and statistical approaches aŒect the outcome of any research. Two recent papers used diŒerent methodological approaches to examine the conversational speech samples of children with impaired hearing and arrived at diŒering conclusions about their rates of improvement. To compare these results, a further data set was examined using both methodologies. The analyses indicated a closer alignment of results than was immediately obvious from the two previous studies, suggesting that the diŒerent results were primarily due to diŒerences in methodology. Keywords: hearing impairment; speech acquisition; research methodology; cochlear implant.
Any attempt to study speech acquisition immediately encounters a number of important choices. Choices involving such factors as the selection of subjects, sampling procedures, statistical approaches and transcription methods will all in¯ uence the outcome. The eŒect of such choices must be considered in the design of the study and consideration of the ® ndings. DiŒerent choices will be appropriate according to the circumstances, revealing diŒering characteristics of the population being studied. The same body of data may produce what appear to be quite diŒerent results depending on the methodological approach taken. The literature includes a range of studies that identify some of the consequences of these choices. Data from articulation tests will diŒer from those taken from spontaneous conversation in such areas as natural phonological processes and fast speech phenomena (Morrison and Shriberg, 1992; Tobey, Geers and Brenner, 1994). Address correspondence to: Catherine Bow, Department of Otolaryngology, University of Melbourne, 384± 388 Albert Street, East Melbourne VIC 3002, Australia; e-mail:
[email protected] Clinical Linguistics & Phonetics ISSN 0269-920 6 print/ISSN 1464-507 6 online Ñ 2002 Taylor & Francis Ltd http://www.tandf.co.uk/journals DOI: 10.1080/02699200110112826
136
C. Bow et al.
The calculation of results requires a choice of what units are considered the most salient, such as counting the number of words or phonemes correct, or other methods of quantifying intelligibility (Shriberg, Austin, Lewis, Sweeney and Wilson, 1997; Tobey, Geers, Douek, Perrin, Skellett, Brenner and Toretta, 2000). Consideration of rate of acquisition may focus on either a measure of correctness or a phonetic inventory (Geers and Tobey, 1992; Serry and Blamey, 1999). An analysis of longitudinal individual data will diŒer from that focussing on cross-sectional data of a larger group (Meyer, Svirsky, Kirk and Miyamoto, 1998). The choice of narrow or broad transcription involves weighing up the sometimes-con¯ icting needs for accuracy and reliability (Shriberg and Lof, 1991). In addition, the literature contains many examples showing speech and language measures as a function of age (Boothroyd, Geers and Moog, 1991; Svirsky, Sloan, Caldwell and Miyamoto, 2000b), implant experience ( Tobey and Hasenstab, 1991; Miyamoto, Robbins, Svirsky, Todd, Iler Kirk and Riley, 1997; Svirsky, Robbins, Iler Kirk, Pisoni and Miyamoto, 2000a) , or assessment number ( Tobey et al., 1994; Geers and Moog, 1994). Two recently published papers used diŒerent methodological approaches to examine the development of speech production in children with impaired hearing by examining conversational samples and calculating percentages of words and sounds produced correctly. Both studies used the same procedure to elicit, record and transcribe the conversational data, using clinicians not involved in the habilitation of the subjects, and using the same computer program to analyse the data. The diŒerences between the two studies were the use of broad and narrow transcription, the time scales used in the analyses, the durations of the studies and the groups of children studied. These diŒerences appear to have led to diŒerent conclusions regarding the improvement of the subjects’ speech production over time. Study A (Blamey, Barry, Bow, Sarant, Paatsch and Wales, 2001a) considered the growth in intelligibility and complexity in the conversational speech samples of a group of nine profoundly deaf children over 6 years following implantation. The usual audiological criterion for profound deafness is an average hearing loss of at least 90 dB at frequencies of 500, 1000 and 2000 Hz. Each subject in the study had a pure tone average hearing loss > 105 dB HL. The children were all implanted with the Cochlear Ltd 22-electrode cochlear implant between the ages of 2 and 5 years (inclusive) and had a variety of audiological histories and educational experiences (six in auditory/oral settings, three in total communication settings). The development of a near-complete phonetic inventory by these children over the 6 years was documented in Serry and Blamey (1999) and Blamey, Barry and Jacq (2001b). A broad phonetic transcription measured the percentage of monophthongs , diphthongs, singleton consonants, consonant clusters, and whole words produced correctly in each conversational sample. Before implantation, the children were producing almost no words correctly, while 6 years after implantation they averaged 61% of words produced correctly. This indicates an average increase in the percentage of correct words of approximately 10% per year over the 6 years. Study B (Blamey, Sarant, Paatsch, Barry, Bow, Wales, Wright, Psarros, Rattigan and Tooher, 2001c) evaluated the speech perception, production and language measures of 87 primary school children with impaired hearing ( 47 using cochlear implants, 40 using hearing aids) over 3 years. All children were enrolled in oral/aural habilitation programmes and most attended integrated classes with normally hearing children for part of the time at school. The results of spontaneous conversations calculated according to a narrow phonetic transcription showed a wide scatter about
Comparison of methods in speech acquisition research
137
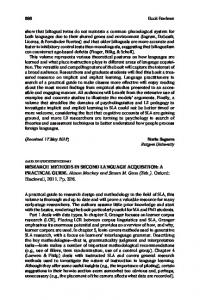
the average speech production score of around 40% of words correctly produced, with no signi® cant upward trend with age. The data from both these studies are summarized in ® gure 1, which shows the percentage of words correct as a function of time. The diŒerence in regression lines is immediately striking, and appears to indicate that the children in study B are not making signi® cant improvements over time, as is the case with the children in study A. However, the diŒerences in methodology are not apparent from ® gure 1, and consideration of these diŒerences may lead away from that simple conclusion. Some of the methodological diŒerences between the two studies include transcription methods (study A used a broad transcription while study B used narrow); the time factor (the results for the nine children in study A were calculated from time of implantation, while those for the 87 children in study B were calculated by chronological age); the duration of study (the smaller group in study A was observed over 6 years compared with 3 years for the larger group of study B); and the populations (study B included both hearing aid and implanted children). The aim of this paper was to reconsider the two methodological approaches used to determine these ® ndings, and to establish whether the children in study B were improving over time. It is hypothesized that the diŒerences in methodology account
Figure 1.
Percentage of words correct as a function of timeÐ and B.
summary of data in studies A
C. Bow et al.
138
for the diŒering results, and that once the ® gures are compared in an appropriate way, a closer agreement should become evident, indicating that the larger group of children were in fact improving in their speech production over time as they grew older. Method To compare the methodology of the two studies, a subgroup of children from the population in study B was selected, and the methodologies of both studies were then applied to the conversational data from these children. Subjects A subset of children reported in the longitudinal study of the speech and language development of school-age children with a hearing impairment reported in Blamey et al. (2001c) were selected for the study. Of those 87 children, selection was restricted to those congenitally deaf, ® tted with cochlear implants and for whom conversation results were available for at least three consecutive annual assessments. The 23 children selected (16 boys, seven girls) were all attending primary school (aged between 4 and 12 years) at the beginning of the study, used English at home as their ® rst language, and were enrolled in an oral/aural educational programme. Most children attended integrated classes with normally hearing children for part of the time at school. Two of the children from study A are included here, however the assessments from which these data are taken were done following the conclusion of the 6-year study (Blamey et al., 2001b). Table 1 summarizes some of the characteristics of this group of children. The hearing loss is calculated as the unaided puretone-average (PTA) threshold in dB HL averaged over frequencies of 500, 1000 and 2000 Hz, referring to the most recent audiogram taken pre-operativel y in the better ear. The second of the three annual assessments was chosen as the midpoint for calculating the means for age at evaluation, duration of deafness and auditory experience (referring to the period between implantation and evaluation) . All the children used the 22-electrode cochlear implant (Clark, Blamey, Brown, Busby, Dowell, Franz, Pyman, Shepherd, Tong, Webb, Hirshorn, Kuzma, Mecklenburg, Money, Patrick and Seligman, 1987) manufactured by Cochlear Ltd together with the SPECTRA wearable speech processor and the SPEAK speech processing strategy (McDermott, McKay and Vandali, 1992). Conversational samples The method of data collection is the same as that used in both previous studies (A and B), and is reported in detail in Study B (Blamey et al., 2001c). In short, the Table 1.
Characteristics of the children in the study
Number of subjects Total number of evaluations Mean pre-operative hearing loss Mean age at implantation Mean age at second evaluation Mean auditory experience at second evaluation
23 69 106.5 dB HL 3 years, 3 months 8 years, 6 months 5 years, 3 months
Comparison of methods in speech acquisition research
139
data were taken from a conversational sample recorded as part of each child’s annual assessment. The child’s conversational partner was an audiologist, teacher of the deaf, or linguist who had presented the other tests in the assessment. The topic of the conversation was unstructured, and the child was encouraged to speak freely with little input by the professional, usually on a topic familiar to the child (family, sport, holidays, etc.). A sample of at least 60 utterances (ideally over 250 words) was then transcribed from the video recording by a speech pathologist or linguist with experience in listening to the speech of children with impaired hearing. The use of videotapes gives the transcriber opportunity to listen to the recorded speech as many times as necessary while producing and revising the orthographic and phonetic transcripts. The orthographic and phonetic transcriptions of the conversations were carried out using the Computer Assisted Speech and Language Assessment (CASALA) program (Serry, Blamey, Spain and James, 1997), which provides a consistent framework for the orthographi c and phonetic transcription of conversational samples and their subsequent analysis. Transcriptions were based on perceptual methods that have consequences for issues of reliability and validity (Shriberg and Lof, 1991). Four professionals (three linguists and a speech pathologist) were responsible for transcribing all the data. Intertranscribe r agreement for the narrow transcription was estimated by comparing the results of a single conversational sample (containing 1170 phonemes) , which was transcribed independently by all four transcribers. The agreements between pairs of transcribers ranged from 64 to 74%. This was slightly lower than the average of 74% reported by Shriberg and Lof (1991), which was calculated from the results of consensus teams of transcribers in narrow transcription of mild to severely speechdelayed children. The percentage of phonemes correct for this conversational sample (55%) was lower than that found by Shriberg and Lof (80%). ( The 55% diŒers from the calculation of 72% of Blamey et al. (2001), which was incorrectly calculated from broad transcription of the conversational sample. The 55% is the correct ® gure calculated from narrow transcription.) The lower reliability in the present study is to be expected, since Shriberg and Lof found that transcription agreement decreased as the percentage of phonemes correct decreased. Narrow versus broad transcription Issues surrounding the choice of narrow and broad transcription methods have been discussed, notably by Shriberg and Lof (1991). The choice of broad transcription is generally made to achieve a higher degree of reliability and to concentrate attention on speech production characteristics that aŒect the identity of phonemes, instead of focusing on subphonemic phonetic characteristics. As such, a phoneme has to be replaced by another phoneme, rather than varied using a diacritic, as would be the case in narrow transcription. The wide range of diacritical markers used in narrow phonetic transcription allows the transcriber to note some of the ® ne distinctions between sounds that do not correspond to a phonemic contrast. The narrow phonetic transcription method implies that the correctly produced words are not only phonemically correct, but each phoneme is correctly articulated with a reasonably high degree of accuracy. For example, hypernasality is a common feature of deaf children’s speechÐ nasalized vowels are marked by the use of a nasality diacritic and words containing nasalized vowels are not included as `correctly produced.’ In some cases there are shades of grey between a distorted sound or a distinct phoneme, for
C. Bow et al.
140
example, an [s] with some degree of palatalization may be represented by one transcriber as [sj ] and by another as [S]. The decision made will aŒect the ® nal percentages of both broad and narrow scores in slightly diŒerent ways. There are also cases where a variation from the target may not represent an error of production (e.g. in narrow transcription an utterance-® nal stop which is marked as unreleased, or in broad transcription a reduced vowel in an unstressed syllable). Consequently, some of the diŒerences between the transcriptions and the dictionary pronunciations used in the analysis were the result of natural processes as found in the speech of normally hearing, non-language-impaire d children and adults. The conversations under consideration were transcribed using the narrow transcription method, and statistics were calculated from the transcripts using the CASALA program. CASALA enables calculations to be made as either broad or narrow through its treatment of diacritics. For study A, scores were calculated according to a broad transcription, while for study B, narrow transcription ® gures were used. For the purposes of the present study, calculations made from both broad and narrow transcriptions of the conversational data of the 23 children were used to compare the two methodologies appropriately. Since the calculations in study A indicated a high correlation between pairs of measures (monophthongs , diphthongs, consonants, words), only the percentage of correct words was considered relevant. Statistical analysis The transcribed conversational samples were analysed according to the percentages of correctly produced words according to both broad and narrow transcripts, as calculated in CASALA. The results were analysed using linear regression as a function of chronological age, time post-implant and evaluation number. These combinations include the methods used in studies A and B, which led to apparently diŒerent conclusions. The variety of statistical analyses used here on the same set of children and conversational samples should indicate whether the disparate results of the two studies were the result of diŒerent methods or due to diŒerences in the speech production of the two groups of children. Results The results for the broad and narrow transcriptions are shown as a function of chronological age, duration of implant experience, and assessment number in ® gures 2 to 4 respectively. The regression lines shown in each panel of the ® gures yield the coe cients shown in table 2. In each case, the regression line follows an equation of the form: Words correct 5 slope3 time1
intercept.
Although all of the R2 were low, the results were statistically signi® cant for the cases where implant experience and assessment number were used as the independent variables and a broad phonetic transcription was used. The latter analyses indicate that the percentage of words correct increased signi® cantly over time, although the analyses with age as the independent variable suggest that there was no signi® cant increase over time. Thus, the apparently contradictory results of the two studies in the introduction are reproduced with a single set of data.
Comparison of methods in speech acquisition research
141
Figure 2.
Percentage of words correct as a function of chronological ageÐ transcription.
broad and narrow
Figure 3.
Percentage of words correct as a function of implant experienceÐ transcription.
broad and narrow
The pairs of broad and narrow transcription methods result in similar slopes for each of the three time factors. Each pair of slopes diŒers by much less than 2 standard errors (SE ), indicating that there are no signi® cant diŒerences in the slopes derived from broad and narrow transcripts. The pairs of intercepts diŒer consistently
C. Bow et al.
142
Figure 4.
Percentage of words correct as a function of assessment numberÐ transcription. Table 2.
Time factor
Summary of linear regression analysesÐ Transcript
Age Age Implant experience Implant experience Assessment number Assessment number
broad narrow broad narrow broad narrow
SlopeÔ SE (%/years) 0.35Ô 0.14Ô 1.64*Ô 1.61Ô 4.93**Ô 3.57Ô
0.69 0.79 0.72 0.84 1.69 2.01
broad and narrow
Wgures 2± 4 InterceptÔ (%) 51.9Ô 41.6Ô 46.2Ô 34.3Ô 45.0Ô 35.7Ô
SE
6.1 7.0 4.1 4.7 3.7 4.3
R2 0.004 0.001 0.072 0.052 0.113 0.045
*Slope signi® cantly diŒerent from zero ( p < 0.05). **Slope signi® cantly diŒerent from zero ( p < 0.01 ).
by about 10% between broad and narrow transcripts with the same time variable. In the cases of implant experience and assessment number analyses, there is a statistically signi® cant diŒerence between the intercepts for broad and narrow ( p < 0.05). As expected, the broad transcriptions result in signi® cantly higher scores than the narrow transcriptions, but the slopes are not signi® cantly diŒerent. Comparison of the SE of the slopes, the SE of the intercepts, and R2 indicate that the narrow transcription results are more variable than the broad transcription results, as expected from Shriberg and Lof (1991). Discussion The comparisons between the analyses in the Results indicate that methodological diŒerences can easily change the conclusions drawn from a study, even though the data were drawn from the same set of conversations. This observation upholds the
Comparison of methods in speech acquisition research
143
hypothesis that the diŒerences between the conclusions of studies A and B were the result of methodological diŒerences. Study A used broad transcription and chose implant experience as the time factor. Implant experience and assessment number were equivalent time variables as data collection commenced just before implantation. It also found a signi® cant increase in the percentage of words produced correctly over time, and an average score of about 60% words correct after 6 years of implant experience. Study B chose narrow transcription and used chronological age as the time factor. It found a lower average score of about 45% words correct and a non-signi® cant slope for the regression line. The eŒects of these methodological diŒerences are clearly shown in table 2. The average scores for broad and narrow transcription (60 and 45% respectively) from the earlier studies were reasonably consistent with the average scores in the present study (® gures 1± 3). The nonsigni® cant slope found in study B was consistent with the non-signi® cant slope for the analyses that used age as the independent variable in the present study. On the other hand, the increase of about 10% per year observed in study A was well above the slope of 4.9% observed for the analysis of broad transcription data as a function of assessment number in the present study. This diŒerence may be accounted for by diŒerences in the groups of children studied, and the ages over which they were observed. The apparent diŒerences in the conclusions reached from the alternative analyses above led to two questions. Which is the most appropriate analysis? Which are the correct conclusions? The answers depend on the main purpose of the analysis, and the data available. In the case of broad and narrow transcription, the greater reliability of the broad transcription led to a more sensitive analysis of variations in speech production ability within the group of children studied here. Thus, broad transcription seemed most appropriate for studies with the goal of comparing levels of speech production competence between children or between evaluations repeated over time. Although less reliable, narrow transcription may provide additional information on the types of errors that children make, and may therefore be more appropriate for studies concerned mainly with the details of how speech production is aŒected by hearing impairment, or the ® tting of cochlear implants and hearing aids, or the use of particular habilitation strategies. With respect to the time variable(s) used in regression analysis, the choice again depends on the purpose of the study and the data available. If the goal was to describe the levels of speech production performance within a group of children, then the age and implant experience variables are appropriate because they will indicate how a typical child performed at any age or with any duration of experience. On the other hand, if the goal was to determine whether children were changing their level of speech production performance and the rate of change at the time of the study, then the assessment number independent variable is clearly the most sensitive one to use, and gives the most `correct’ answer for rate of change. A consequence of this observation is that studies of rate of change must be longitudinal. In other words, there must be more than one observation of each child, and the observations must be su ciently far apart in time for the changes in the observations to be dominated by the eŒects of development or habilitation rather than test± retest factors such as the reliability of the evaluation procedure itself. This conclusion applies not only to the evaluation of speech production, but also to all aspects of development including speech perception and other language acquisition measures.
C. Bow et al.
144
From a mathematical point of view, these results give rise to two questions. Why do the diŒerent time analyses give diŒerent slopes? What characteristics in the data sets lead to diŒerent slopes for diŒerent analyses? Some hypothetical data were analysed to consider these questions. Hypothetical data are given in table 3, which shows three groups of ® ve children of diŒerent ages who were assessed on a hypothetical test at annual intervals over 5 years, starting at a hypothetical date of implant which is diŒerent for each child within the group. The groups are labelled `normal’ (improving in score by 10% for each year of age), `delayed’ (improving by 10% for each year of the study, but all starting at a level of 10%, which is delayed relative to the normal group), and `slow’ (improving by 6% for each year of the study, and delayed relative to the normal group) . Figures 5 and 6 show the hypothetical data for the three groups plotted against chronological age and annual evaluation number respectively. Also shown are linear regression lines for the three hypothetical groups of children using age and annual evaluation number as the independent variables and test score as the dependent variable. Note that the horizontal spread of the data is diŒerent for the groups in ® gures 5 and 6, and the slopes of the regression lines for the delayed and slow groups are also diŒerent. The reason for the diŒerence in the slopes of the regression lines for the delayed and slow groups is that there are diŒerent sets of children at diŒerent ages in ® gure 5. For example, there is only one data point for child 1 in each group at age 2 years, but there are ® ve data points (one for each child ) for each group at age 6 years. Thus, the average scores at successive ages include diŒerences between Table 3. Child no. 1 1 1 1 1 2 2 2 2 2 3 3 3 3 3 4 4 4 4 4 5 5 5 5 5
Hypothetical percentages for three groups of Wve children (normal, delayed, slow) from Wve annual evaluations Evaluation no.
Age (years)
Normal (%)
Delayed (%)
Slow (%)
1 2 3 4 5 1 2 3 4 5 1 2 3 4 5 1 2 3 4 5 1 2 3 4 5
2 3 4 5 6 3 4 5 6 7 4 5 6 7 8 5 6 7 8 9 6 7 8 9 10
20 30 40 50 60 30 40 50 60 70 40 50 60 70 80 50 60 70 80 90 60 70 80 90 100
10 20 30 40 50 10 20 30 40 50 10 20 30 40 50 10 20 30 40 50 10 20 30 40 50
10 16 22 28 34 10 16 22 28 34 10 16 22 28 34 10 16 22 28 34 10 16 22 28 34
Comparison of methods in speech acquisition research
145
Figure 5.
Data and regression lines for hypothetical test score versus chronological age for three hypothetical groups of children.
Figure 6.
Data and regression lines for hypothetical test score versus assessment number for three hypothetical groups of children.
C. Bow et al.
146
children as well as diŒerences in the performance of individual children as they grow older. In contrast, every child in each group contributes to the data at each assessment shown in ® gure 6. Thus the regression lines in ® gure 6 do not incorporate diŒerences between children, only diŒerences between the assessments at successive times. As in the case of the actual data, diŒerent analyses are required for diŒerent purposes. For example, if one is interested in how well a typical child from one of the groups is doing at a particular age, the regression analyses using chronological age as the independent variable are most appropriate (as in ® gures 2 and 5 ). On the other hand, if one is interested in typical rates of improvement for children in each group, the regression analyses based on evaluation number are more appropriate (as in ® gures 4 and 6). Naõ È vely, it seems logical that the time-scale that produces the least spread in time for the data should produce the greatest slope for the regression line (because the same range of scores is compressed into a shorter time span). However, this is not always true. For example, the slopes of the regression lines for the normal group are identical in ® gures 5 and 6. This is because the ® ve children in this group perform identically with one another at every age, and the rate of increase in score is constant with time. These two conditions do not apply to the delayed and slow groups, where the rate of increase before the ® rst assessment is less than the rate of increase after the ® rst assessment, and the children perform at diŒerent levels from one another even after allowing for age diŒerences. Variations like these are likely to occur within groups of real children, and so regression analyses with alternative time-scales are likely to result in diŒerent slopes, as is the case with the actual data given here. Conclusions The choices made in the establishment of any research study of speech acquisition will have signi® cant eŒects on the results. Looking at two similar sets of data in diŒerent ways can produce apparently contradictory results. Consideration of a subset of data using diŒerent methodological approaches shows that the children are actually improving and therefore the hypothesis that a diŒerence in methodological approach accounts for the diŒering results between the two previous papers is supported. The bene® ts of applying diŒerent methodologies depend on the goal of the particular research involved. Depending on whether the goal is to look at individual children’ s rate of change, then a longitudinal study will be more appropriate than a cross-sectional study giving a general description of a population of children. Which time factor is selected as the independent variable, and the appropriate method of transcription used will each be important decisions aŒecting the outcome of the research. Acknowledgements The authors acknowledge the assistance and cooperation of the children, parents and teachers involved in the collection of data, particularly from the Sydney Children’s Cochlear Implant Centre. Thanks also to Johanna Barry, Tanya Serry and Pascale Jacq for careful work in transcribing the conversational data. Financial support was provided by the Australian National Health & Medical Research Council (Project Grant #970257). Ethical approval was provided by the Human Research and Ethics Committee of the Royal Victorian Eye and Ear Hospital.
Comparison of methods in speech acquisition research
147
References Blamey, P., Barry, J., Bow, C., Sarant, J., Paatsch, L. and Wales, R., 2001a, The development of speech production following cochlear implantation. Clinical Linguistics and Phonetics, 15, 363± 382. Blamey, P. J., Barry, J. G. and Jacq, P., 2001b, Phonetic inventory development in young cochlear implant users 6 years post-operation. Journal of Speech, Language , and Hearing Research, 44, 73± 79. Blamey, P. J., Sarant, J. Z., Paatsch, L. E., Barry, J. G., Bow, C. P., Wales, R. J., Wright, M., Psarros, C., Rattigan, K. and Tooher, R., 2001c, Relationships among speech perception, production, language, hearing loss, and age in children with impaired hearing. Journal of Speech, Language , and Hearing Research, 44, 264± 285. Boothroyd, A., Geers, A. E. and Moog, J. S., 1991, Practical implications of cochlear implants in children. Ear and Hearing, 12 (4 suppl.), 81S± 89S. Clark, G. M., Blamey, P. J., Brown, A. M., Busby, P. A., Dowell, R. C., Franz, B. K.-H., Pyman, B. C., Shepherd, R. K., Tong, Y. C., Webb, R. L., Hirshorn, M. S., Kuzma, J., Mecklenburg, D. J., Money, D. K., Patrick, J. F. and Seligman, P. M., 1987, The University of Melbourne± Nucleus multi-electrode cochlear implant. Advances in Oto-Rhino-Laryngology , 38, 1± 189. Geers, A. and Moog, J., 1994, Spoken language results: vocabulary, syntax and communication. Volta Review, 96, 131± 148. Geers, A. E. and Tobey, E. A., 1992, EŒects of cochlear implants and tactile aids on the development of speech production skills in children with profound hearing impairment. Volta Review, 94, 135± 163. McDermott, H. J., McKay, C. M. and Vandali, A. E., 1992, A new portable sound processor for The University of Melbourne/Nucleus Limited multi-electrode cochlear implant. Journal of the Acoustical Society of America, 91, 3367± 3371. Meyer, T. A., Svirsky, M. A., Kirk, K. I. and Miyamoto, R. T., 1998, Improvements in speech perception by children with profound prelingual hearing loss: eŒects of device, communication mode, and chronological age. Journal of Speech, Language, and Hearing Research, 41, 846± 858. Miyamoto, R. T., Robbins, A. M., Svirsky, M., Todd, S., Iler Kirk, K. and Riley, A., 1997, Speech intelligibility of children with multichannel cochlear implants. Annals of Otology, Rhinology and Laryngolog y, 106, 35± 36. Morrison, J. A. and Shriberg, L. D., 1992, Articulation testing versus conversational speech sampling. Journal of Speech and Hearing Research, 35, 259± 273. Serry, T. A. and Blamey, P. J., 1999, A four year investigation into phonetic inventory development in young cochlear implant users. Journal of Speech, Language, and Hearing Research, 42, 141± 154. Serry, T., Blamey, P., Spain, P. and James, C., 1997, CASALA: Computer aided speech and language analysis. Australian Communication Quarterly, Spring, 27± 28. Shriberg, L. D., Austin, D., Lewis, B. A., Sweeney, J. L. and Wilson, D. L., 1997, The percentage of consonants correct (PCC ) metric: extensions and reliability data. Journal of Speech, Language , and Hearing Research, 40, 708± 722. Shriberg, L. D. and Lof, G. L., 1991, Reliability studies in broad and narrow phonetic transcription. Clinical Linguistics and Phonetics, 5, 225± 279. Svirsky, M. A., Robbins, A. M., Iler Kirk, K., Pisoni, D. B. and Miyamoto, R. T., 2000a, Language development in profoundly deaf children with cochlear implants. Psychological Science, 11, 153± 158. Svirsky, M. A., Sloan, R. B., Caldwell, M. and Miyamoto, R. T., 2000b, Speech intelligibility of prelingually deaf children with multichannel cochlear implants. Annals of Otology, Rhinology and Laryngolog y, 109, 123± 125. Tobey, E., Geers, A. and Brenner, C., 1994, Speech production results: speech feature acquisition. Volta Review, 96, 109± 129. Tobey, E. A., Geers, A. E., Douek, B. M., Perrin, J., Skellett, R., Brenner, C. and Toretta, G., 2000, Factors associated with speech intelligibility in children with cochlear implants. Annals of Otology, Rhinology and Laryngolog y, 109, 28± 30. Tobey, E. A. and Hasenstab, M. S., 1991, EŒects of a Nucleus multichannel cochlear implant upon speech production in children. Ear and Hearing, 12, 48S± 54S.