Comparison of the Three CPU Schedulers in Xen Ludmila Cherkasova
Diwaker Gupta and Amin Vahdat
Hewlett-Packard Labs Palo Alto, CA 94303, USA
University of California, San Diego San Diego, CA 92093, USA {dgupta,vahdat}@cs.ucsd.edu
[email protected]
ABSTRACT The primary motivation for enterprises to adopt virtualization technologies is to create a more agile and dynamic IT infrastructure — with server consolidation, high resource utilization, the ability to quickly add and adjust capacity on demand — while lowering total cost of ownership and responding more effectively to changing business conditions. However, effective management of virtualized IT environments introduces new and unique requirements, such as dynamically resizing and migrating virtual machines (VMs) in response to changing application demands. Such capacity management methods should work in conjunction with the underlying resource management mechanisms. In general, resource multiplexing and scheduling among virtual machines is poorly understood. CPU scheduling for virtual machines, for instance, has largely been borrowed from the process scheduling research in operating systems. However, it is not clear whether a straight-forward port of process schedulers to VM schedulers would perform just as well. We use the open source Xen virtual machine monitor to perform a comparative evaluation of three different CPU schedulers for virtual machines. We analyze the impact of the choice of scheduler and its parameters on application performance, and discuss challenges in estimating the application resource requirements in virtualized environments.
1.
INTRODUCTION
Virtualization is emerging as a key mechanism of scaling the IT infrastructure and enabling enterprises to move from vertical silos of servers to horizontal pools of resources. Server virtualization provides the ability to slice larger, underutilized physical servers into smaller, virtual ones. Although virtualization has been around for more than three decades, it has found its way into the mainstream only recently, as a consequence of the recent developments in virtualization software and improved hardware support. A variety of solutions — both commercial and open source — are now available for commodity systems. The motivations for enterprises to adopt virtualization technologies include increased flexibility, the ability to quickly re-purpose server capacity to better meet the needs of application workload owners, and to reduce overall costs of ownership. Virtualization services offer interfaces that support the life cycle management (e.g., create, destroy, move, size capacity) of VMs that are provided with access to shares of resource capacity (e.g., cpu, memory, input-output). Furthermore, some virtualization platforms provide the ability to dynamically migrate VMs from one physical machine to another without interrupting application execution. For large enterprises it offers an ideal solution for server and application consolidation. Unfortunately, the complexity of these virtualized environments presents additional management challenges. Garfunkel and Rosenblum discussed security challenges in virtualized environments [12]. In this work, we address resource allocation and capacity manage-
ment problems in VM-based environments. In such environments there are many different workloads, and a finite number can be hosted by each server. Each workload has capacity requirements that may frequently change based on business needs. VMs currently provide ideal fault isolation. In an enterprise environment, however, they must also provide performance and resource isolation; meaning that rogue services should not impact the performance of other applications that share the same infrastructure[14]. Cost effective capacity management methods are not yet available. Moreover, such capacity management methods critically depend on the characteristics of the resource allocation mechanisms of the underlying VM platform. While our broader premise is that resource allocation for VMs is, in general, a hard problem, in this paper we focus our attention on CPU scheduling. As a concrete example of the types of challenges involved, we analyze and compare the CPU schedulers in the Xen VMM [6] in the context of traditional workload managers. Workload managers [4, 2] and similar tools were, until a few years ago, known only to mainframers and users of large Unix environments. These technologies have their own requirements from the underlying resource management mechanisms (e.g., CPU scheduling of VMs). Using Xen and its evolution with three different CPU schedulers, we demonstrate the challenges in choosing the appropriate scheduler features and parameters to support desirable application performance, as well as demonstrate the performance impact of these different choices. We find that, at least for the popular Xen environment, much work remains to be done in CPU scheduling before effective resource isolation guarantees can be delivered in large-scale deployments. The rest of this paper is organized as follows: Section 2 introduces some useful concepts and terminology for CPU schedulers; followed by a brief overview of workload managers that are used for resource allocation in traditional enterprise environments in Section 3. We also discuss the requirements these workload managers impose on the underlying CPU schedulers. Section 4 introduces the three CPU schedulers in Xen. Section 5 introduces the I/O model in Xen and presents some CPU allocation challenges directly related to this model. Then using a small suite of I/O intensive applications, we analyze the impact of the choice of scheduler and its parameters on application performance.
2.
CPU SCHEDULERS FOR VIRTUAL MACHINES
Before describing Xen’s CPU schedulers, we first establish some terminology and classical ways of classifying CPU schedulers. A large fraction of CPU schedulers belong to a popular class of schedulers called Proportional Share (PS) schedulers. There are compelling reasons to use proportional share (PS) scheduling for CPU scheduling in VMs. PS scheduling allocates CPU in proportion to the number of shares (weights) that VMs have been assigned. This
gives end users a very natural way of thinking about CPU allocations, and scales well to large number of VMs and processors. Typically, PS schedulers are evaluated based on fairness, i.e., the time interval over which the scheduler provides fair CPU allocation, and the allocation error which typically depends on the scheduler algorithm and its quantum size. An important distinction between fair-share schedulers and PS schedulers is the time granularity at which they operate. Proportional share schedulers aim to provide an instantaneous form of sharing among the active clients according to their weights. In contrast, fair-share schedulers attempt to provide a time-averaged form of proportional sharing based on the actual use measured over long time periods. For example, consider a simple situation where two clients C1 and C2 share a system with equal CPU shares. Suppose C1 is actively computing for some time, while C2 is temporarily inactive (e.g., blocked). When C2 becomes active, a fair-share scheduler will allocate a large CPU share to C2 to “catch up” with C1 . In contrary, a proportional CPU scheduler will treat C1 and C2 equally because it is “unfair” to penalize C1 for consuming otherwise idle resources. CPU schedulers can be further distinguished as supporting workconserving (WC-mode) and/or non work-conserving (NWC-mode) modes. In the WC-mode, the shares are merely guarantees, and the CPU is idle if and only if there is no runnable client. It means that in a case of two clients with equal weights and a situation when one of these clients is blocked, the other client can consume the entire CPU. With the NWC-mode, the shares are caps, i.e., each client owns its fraction of the CPU. It means that in a case of two clients with equal weights, each client will get up to 50% of CPU, but the client will not be able to get more than 50% even if the rest of the CPU is idle. We also distinguish preemptive and non-preemptive CPU schedulers. Preemptive schedulers rerun the scheduling decision whenever a new client becomes ready. If the new client has “priority” over the running client, the CPU preempts the running client and executes the new client. Non-preemptive schedulers only make decisions when the running client gives up the CPU. Non-preemptive schedulers allow every running client to finish its CPU slice. Having a preemptive scheduler is important for achieving good performance of I/O intensive workloads in shared environment. These workloads are often blocked waiting for I/O events, and their performance could suffer when competing with CPU intensive jobs if the CPU scheduler is non-preemptive. However, choosing a right quantum size may alleviate this problem.
3.
Such isolation can be desirable in a shared environment for enterprise applications as it gives the appearance of dedicated access to resources. Adding new workloads to the pool (if available resources allow) has little impact on the performance behavior of workloads already in the pool. Each virtual machine is pre-allocated specific shares of capacity for short time periods (e.g. 5 seconds). Then, based on the demands of the VM and the availability of resources, the allocations may be adjusted to ensure that each VM gets the capacity it needs. Since the decision of the workload manager controller is based on a difference between assigned and consumed CPU allocation, a scheduler with significant error in CPU allocation may cause unstable controller behavior. Thus, a prerequisite of the underlying CPU scheduler is a small allocation error (typically, 1–2%).
4.
• preemptive (if warp is used), WC-mode only; • optimally-fair: the error between fair share and actual allocation is never greater than context switch allowance C plus one mcu ; • low-overhead implementation on multiprocessors as well as uni-processors.
WORKLOAD MANAGERS
A core requirement for effective virtualization is workload management, i.e., the ability to assign resources such as CPU, memory, and I/O to applications as precisely as possible. Workload management enables applications to provide service levels based on policies driven by time, price, and performance. One simple approach for assigning CPU resources to VMs is static allocation. However, static allocation becomes inefficient under varying load: each VM must be sized to support the application’s peak capacity requirements. Yet, most applications rarely need their peak amount. Workload managers aim to dynamically allocate resources to match application requirements. A workload manager 1 is typically layered upon a PS scheduler used in the NWC-mode. This mode provides performance isolation among competing services. Each VM receives its particular service rate regardless of whether any of the other VMs are using resources. 1 While the authors are closely familiar with HP workload management products and refer to features and parameters related to HP’s products (such as NWC-mode, usage-based management policy, and small allocation error), IBM’s workload managers have similar characteristics as well.
CPU SCHEDULERS IN XEN
Xen is unique among VM platforms because it allows users to choose among different CPU schedulers. But this choice comes with the burden of choosing the right scheduler and configuring it. Over the course of last three years, three different CPU schedulers were introduced, all allowing users to specify CPU allocation via CPU shares (weights). Below, we briefly characterize their main features that motivated their inclusion in Xen at the time. Borrowed Virtual Time (BVT) [9] is a fair-share scheduler based on the concept of virtual time, dispatching the runnable VM with the smallest virtual time first. Additionally, BVT provides low-latency support for real-time and interactive applications by allowing latencysensitive clients to “warp” back in virtual time to gain scheduling priority. The client effectively “borrows” virtual time from its future CPU allocation. The scheduler accounts for running time in terms of a minimum charging unit (mcu), typically the frequency of clock interrupts. The scheduler is configured with a context switch allowance C, which is the real time by which the current VM is allowed to advance beyond another runnable VM with equal claim on the CPU ( the basic time slice or time quantum of the algorithm). C is typically some multiple of mcu. Each runnable domain 2 receives a share of CPU in proportion to its weight weighti . To achieve this, the virtual time of the currently running Domi is incremented by its running time divided by weighti . In summary, BVT has the following features:
The lack of NWC-mode in BVT severely limited its usage in a number of environments, and led to the introduction of the next scheduler in Xen. Simple Earliest Deadline First (SEDF) [20] uses real-time algorithms to deliver guarantees. Each domain Domi specifies its CPU requirements with a tuple (si , pi , xi ), where the slice si and the period pi together represent the CPU share that Domi requests: Domi will receive at least si units of time in each period of length pi . The boolean flag xi indicates whether Domi is eligible to receive extra CPU time (WC-mode). SEDF distributes this slack time fairly manner after all runnable domains receive their CPU share. One can allocate 30% CPU to a domain by assigning either (3 ms, 10 ms, 0) or (30 ms, 100 ms, 0). The time granularity in the definition of the period impacts scheduler fairness. 2
We use words domain and virtual machine interchangeably.
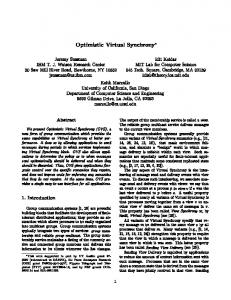
(a) Initial I/O Model
(b) Current I/O Model in Xen
Figure 1: Two popular I/O models for VMs. For each domain Domi , the scheduler tracks two additional values (di , ri ): • di - time at which Domi ’s current period ends, also called the deadline. The runnable domain with earliest deadline is picked to be scheduled next; • ri - remaining CPU time of Domi in the current period. In summary, SEDF has the following features: • preemptive, WC and NWC modes; • fairness depends on a value of the period. • implements per CPU queue: this implementation lacks global load balancing on multiprocessors. Credit Scheduler [1] is Xen’s latest PS scheduler featuring automatic load balancing of virtual CPUs across physical CPUs on an SMP host. Before a CPU goes idle, it will consider other CPUs in order to find any runnable VCPU. This approach guarantees that no CPU idles when there is runnable work in the system. Each VM is assigned a weight and a cap. If the cap is 0, then the VM can receive any extra CPU (WC-mode). A non-zero cap (expressed as a percentage) limits the amount of CPU a VM receives (NWC-mode). The Credit scheduler uses 30 ms time slices for CPU allocation. A VM (VCPU) receives 30 ms before being preempted to run another VM. Once every 30 ms, the priorities (credits) of all runnable VMs are recalculated. The scheduler monitors resource usage every 10 ms. To some degree, Credit’s computation of credits resembles virtual time computation in BVT. However, BVT has a context switch allowance C for defining a different size of the basic time slice (time quantum), and an additional low-latency support (via warp) for real-time applications. In summary, Credit has the following features: • non-preemptive, WC and NWC modes; • global load balancing on multiprocessors. In the next section, we present results of a performance study comparing these schedulers and their features in more detail.
5.
CASE STUDY
There are two popular I/O models for VMs, as demonstrated in the evolution of the I/O architecture of Xen. In its original design [6], the Xen VMM itself contained device driver code and provided safe, shared access for I/O hardware (see Figure 1 a). Later, the Xen team proposed a new architecture [11] that allows unmodified device drivers to be hosted and executed in isolated “driver domains” (see Figure 1 b). Typically, the management domain Dom0 hosts unmodified Linux device drivers and plays the role of the driver domain. This new I/O model results in a more complex CPU usage
model. For I/O intensive applications, CPU usage has two components: CPU consumed by the guest virtual machine (VM) and CPU consumed by Dom0 which hosts the device drivers and performs I/O processing on behalf of the guest domain. Finding a satisfactory solution to the CPU allocation problem for applications executing in VMs requires answering several questions. How does one estimate the application CPU requirements and project them into two components: Dom0 and guest domain’s shares? How sensitive are I/O intensive applications to the amount of CPU allocated to Dom0 ? Does allocation of a higher CPU share to Dom0 mean a better performance for I/O intensive applications? How significant is the impact of scheduler parameters on application performance, e.g., context switch allowance C in BVT and period Pi in SEDF? Further, additional functionality was the main motivation behind introducing new Xen schedulers. For example, SEDF added the NWC -mode missing in BVT, and Credit added automatic, transparent global load balancing of VCPUs, missing in both BVT and SEDF. To the best of our knowledge, a thorough comparative performance evaluation of the different schedulers does not exist, so it is not immediately clear if configuring different schedulers with the same CPU allocation would result in similar application performance. While scheduling of virtual machines might rely on the CPU schedulers proposed for process scheduling in general purpose OSes, the parameter setting and scheduler tuning can be different for VMs. Our performance study aims to answer some of these questions. We performed experiments with three applications: • web server: We measure web server throughput. In our workload, we request fixed size (10 KB) files 3 using httperf [3]. • iperf: We measure maximum achievable network throughput using iperf [5]. • disk read: Finally, we benchmark disk read throughput with the dd utility for reading 1000 1-KB blocks. Note our choice of simple, focused benchmarks (instead of extensive suites like the SPEC benchmarks) for two reasons: first, if we are able to demonstrate scheduling issues even with these benchmarks, then one can conclude that the problems would be just as visible, if not worse, in more complex setups; second, these benchmarks are much more predictable and easier to debug than more extensive benchmarking suites. Our testbed consists of dual CPU HP workstations LP200R, with 1-GHz PIII processors, 2-GB RAM and 1-Gbit/s NICs running Xen 3 We had limited our study to a web server with 10 KB files. We refer a reader to the earlier case study [7] where the CPU overhead in Dom0 is measured for different file sizes retrieved from a web server.
3.0.3. In this work, we first present the results for single CPU configurations to separate comparison of the basic CPU scheduler properties from the load balancing issues for SMP configurations. We will present results for SMP-configuration in Section 5.3. We consider 5 different configurations where we varied the CPU allocated to Dom0 relative to Dom1 , e.g., in Conf 0.25, Dom0 is allocated 0.25 of the CPU allocated to Dom1 .
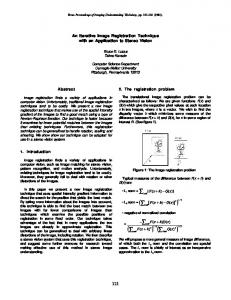
5.1 Impact of Different Scheduler Parameters and Dom0 Weight In this section, we aim to answer the following questions: • How sensitive are I/O intensive applications to the amount of CPU allocated to Dom0 ? Does allocation of a higher CPU share to Dom0 mean a better performance for I/O intensive applications? • How significant is the impact of scheduler parameters on application performance, e.g., context switch allowance C in BVT and period Pi in SEDF? Figure 2(a) shows web server throughput for BVT with context allowance C set to 1 ms, 5 ms, and 50 ms. The X-axis presents the results of experiments for 5 different configurations where the CPU weights allocated to Dom0 relative to Dom1 are 0.25, 0.5, 1, 2, and 4. We first note that the web server throughput is quite sensitive to Dom0 weight for all three schedulers. Second, BVT with larger values for C supports higher web server throughput. The difference in performance is significant: when Dom0 and Dom1 have equal weights (Conf 1) web server throughput with context allowance C = 50 ms is 85% higher than for C = 1 ms. With a larger context allowance, the currently running domain executes longer before it is preempted by another runnable domain. When Dom0 is assigned a higher weight, it gets a higher priority when it unblocks. Intuitively, it leads to a situation where Dom0 preempts the running guest domain on each incoming interrupt and ends up processing fewer I/O events per execution period at a higher cost (due to context switch overhead). Increasing C alleviates this problem because it lets the guest VM execute slightly longer before being preempted by Dom0 , and as a result, Dom0 can more efficiently process multiple I/O events accumulated over time. Figures 2(b) and 2(c) show web server throughput for SEDF in WC and NWC -mode respectively with different granularity for periods Pi of 10 ms, 100 ms, and 1000 ms. SEDF with a smaller time period makes a fair share allocation at smaller time granularity, while with a larger time period the algorithm may result in “burstier” CPU allocation. When Dom0 and Dom1 have equal weights (Conf 1) SEDF scheduler in WC-mode with 10 ms period supports almost 40% higher web server throughput compared to 1000 ms period (50% throughput improvement in the NWC-mode). To obtain additional system performance metrics and to gain some insight into the schedulers’ behavior we analyzed monitoring results from XenMon [15] that reports resource usage of different domains and some scheduling information such as how often a domain has been scheduled, its average waiting time for CPU allocation (i.e., being in the run queue), etc. Figures 3 and 4 show CPU usage by Dom0 and Dom1 for web server experiments reported in Figure 2. First, we see that Dom0 (which performs I/O processing on behalf of the guest domains) consumes a significant share of CPU. Second, while the Dom0 weight varies across a significant range (from 0.5 to 4 relative to Dom1 weight) the CPU usage by Dom0 varies in a rather limited range between 33% to 45% for BVT and SEDF in WC -mode. Third, the limited variation in CPU usage might lead to a drastic difference in application performance.
Since we observe the most significant difference in web server performance under BVT and SEDF schedulers with different parameters for the configuration where Dom0 and Dom1 have equal weights (Conf 1), we first analyze and compare resource usage by Dom0 and Dom1 in this configuration. The results are shown in Table 1 below. CPU Scheduler Type BVT, context allow.= 50 ms BVT, context allow.= 5 ms BVT, context allow.= 1 ms SEDF, wc, period=10 ms SEDF, wc, period=100 ms SEDF, wc, period=1000 ms SEDF, nwc, period=10 ms SEDF, nwc, period=100 ms SEDF, nwc, period=1000 ms
Dom0 Util (%) 35 38 43 35 41 43 27 35 40
Dom1 Util (%) 64 61 56 59 59 53 50 50 50
Tput req/sec 934 817 510 696 632 499 615 504 419
Table 1: CPU usage by Dom0 and Dom1 and web server throughput. Table 1 shows that different scheduler parameters such as decreased context switch allowance C in BVT and increased period in SEDF lead to a relatively small increase in CPU usage by Dom0 while causing a drastic change in the application performance. In case of WC-mode, one can say that, additionally, there is also a small decrease in CPU usage by Dom1 , and this smaller CPU allocation to the application can explain worse web server performance and its lower throughput. However, in the case of SEDF in NWC-mode, it is not true. For all the three values of period (10 ms, 100 ms, and 1000 ms) the CPU usage by Dom1 is the same: it is at its maximum value of 50% (note that in NWC-mode, when Dom0 and Dom1 have equal weights they are entitled to the maximum of 50% CPU usage). As for CPU usage by Dom0 , we observe that with larger time periods, SEDF allocates higher CPU share to Dom0 . For example, a period of 10 ms results in 27% of CPU allocation to Dom0 , and with period of 1000 ms, the CPU allocation to Dom0 is increased to 40%, while in contrast, web server throughput, drops from 615 req/sec to 419 req/sec, causing the 33% decrease in web server throughput. At first glance, the lower web server throughput achieved by the configuration with higher CPU share to Dom0 seems like a contradiction. To clarify and explain this phenomenon, we analyze some additional, low level scheduling and system metrics. XenMon reports an execution count metric that reflects how often a domain has been scheduled on a CPU during the measurement period (e.g., 1 second). XenMon also provides I/O count metric that is a rough measure of I/O requested by the domain. Table 2 below shows the number of execution periods per second and the I/O count per execution period for BVT and SEDF as discussed above and the configuration with Dom0 and Dom1 having equal weights (Conf 1). CPU Scheduler Type BVT, context allow.= 50 ms BVT, context allow.= 5 ms BVT, context allow.= 1 ms SEDF, wc, period=10 ms SEDF, wc, period=100 ms SEDF, wc, period=1000 ms SEDF, nwc, period=10 ms SEDF, nwc, period=100 ms SEDF, nwc, period=1000 ms
ex/sec 1127 3080 6409 2478 5124 6859 451 4635 7292
i/o count/ex 27.3 8.6 2.6 6.9 3 1.9 34.6 2.8 1.5
Table 2: The number of execution periods per second of Dom0 and I/O count per execution period in Dom 0 .
Web Server (BVT): Throughput
Web Server (SEDF, WC): Throughput
1000
900 P = 10 ms P = 100 ms P = 1000 ms
800
800 700 600
P = 10 ms P = 100 ms P = 1000 ms
800 Throughput (req/sec)
750 Throughput (req/sec)
900 Throughput (req/sec)
Web Server (SEDF, NWC): Throughput
850 C = 50 ms C = 5 ms C = 1 ms
700 650 600 550 500
700 600 500 400 300
450
500
200
400 400
350 0
0.5
1
1.5
2
2.5
3
3.5
4
100 0
0.5
Dom0 Weight relative to Dom1 Weight
1
1.5
2
2.5
3
3.5
4
0
0.5
Dom0 Weight relative to Dom1 Weight
(a) BVT (WC-mode)
1
1.5
2
2.5
3
3.5
4
Dom0 Weight relative to Dom1 Weight
(b) SEDF (WC-mode)
(c) SEDF (NWC-mode)
Figure 2: Impact of schedulers’ parameters on web server performance Web Server (SEDF, WC): Dom0 CPU Utilization
Web Server (SEDF, NWC): Dom0 CPU Utilization 50
45
45
45
40
40
40
35 30 25 20
Dom0 CPU Util (%)
50
Dom0 CPU Util (%)
Dom0 CPU Util (%)
Web Server (BVT): Dom0 CPU Utilization 50
35 30 25 20
C = 50 ms C = 5 ms C = 1 ms
15 0.5
1 1.5 2 2.5 3 Dom0 Weight relative to Dom1 Weight
3.5
4
30 25
15
10 0
35
20 P = 10 ms P = 100 ms P = 1000 ms
15
10
P = 10 ms P = 100 ms P = 1000 ms
10 0
(a) BVT (WC-mode)
0.5
1 1.5 2 2.5 3 Dom0 Weight relative to Dom1 Weight
3.5
4
0
(b) SEDF (WC-mode)
0.5
1 1.5 2 2.5 3 Dom0 Weight relative to Dom1 Weight
3.5
4
(c) SEDF (NWC-mode)
Figure 3: Dom0 ’s CPU usage under different schedulers’ parameters Web Server (BVT): Dom1 CPU Utilization
Web Server (SEDF, WC): Dom1 CPU Utilization
70
65 60 Dom1 CPU Util (%)
60 55 50 45 40 35
50 45 40 35 30
25
25
20
20 0.5
1 1.5 2 2.5 3 Dom0 Weight relative to Dom1 Weight
(a) BVT (WC-mode)
3.5
4
P = 10 ms P = 100 ms P = 1000 ms
60
55
30
0
70 P = 10 ms P = 100 ms P = 1000 ms Dom1 CPU Util (%)
65
Dom1 CPU Util (%)
Web Server (SEDF, NWC): Dom1 CPU Utilization
70 C = 50 ms C = 5 ms C = 1 ms
50 40 30 20 10
0
0.5
1 1.5 2 2.5 3 Dom0 Weight relative to Dom1 Weight
(b) SEDF (WC-mode)
3.5
4
0
0.5
1 1.5 2 2.5 3 Dom0 Weight relative to Dom1 Weight
(c) SEDF (NWC-mode)
Figure 4: Dom1 ’s CPU usage under different schedulers’ parameters
3.5
4
Web Server
Iperf
1000 950 900
50 SEDF CREDIT BVT
280
45
260
800 750 700 650 600
240 220 200 180
500
140
450
120 0
0.5
1 1.5 2 2.5 3 Dom0 Weight relative to Dom1 Weight
3.5
4
35 30 25 20
160
550
SEDF CREDIT BVT
40 Throughput (MB/s)
850
Throughput (Mbits/s)
Throughput (req/sec)
Disk
300 SEDF CREDIT BVT
15 10 0
0.5
(a) Web server
1 1.5 2 2.5 3 Dom0 Weight relative to Dom1 Weight
3.5
4
0
0.5
(b) iperf
1 1.5 2 2.5 3 Dom0 Weight relative to Dom1 Weight
3.5
4
3.5
4
(c) Disk
Figure 5: Evaluating the three schedulers (WC-mode) for different workloads. Web Server
Iperf
900
Disk
240 SEDF CREDIT
800
45 SEDF CREDIT
220
SEDF CREDIT
40
700 600 500 400
180
Throughput (MB/s)
Throughput (Mbits/s)
Throughput (req/sec)
200
160 140 120 100
35 30 25 20
80 300
15
60
200
40 0
0.5
1 1.5 2 2.5 3 Dom0 Weight relative to Dom1 Weight
(a) Web server
3.5
4
10 0
0.5
1 1.5 2 2.5 3 Dom0 Weight relative to Dom1 Weight
(b) iperf
3.5
4
0
0.5
1 1.5 2 2.5 3 Dom0 Weight relative to Dom1 Weight
(c) Disk
Figure 6: Evaluating the three schedulers (NWC-mode) for different workloads. Indeed, in case of a smaller context switch allowance C in BVT or a larger time period in SEDF, both schedulers exhibit a similar behavior: they schedule Dom0 much more often (see the increased number of execution periods). However, frequently scheduled Dom0 is processing fewer I/O events that are accumulated in between the Dom0 execution periods. This type of scheduling leads to a higher context switch overhead and to a worse web server performance. In such a way, while the observed CPU usage by Dom0 is higher, in fact, it performs less useful work which manifests itself as degraded application performance. Figures 5 and 6 show the performance of the three workloads for the three schedulers in the WC and NWC modes respectively. For brevity, we omit detailed analysis of these experiments and summarize below: • I/O intensive applications are highly sensitive to the amount of CPU allocated to Dom0 . The problem of adequate CPU allocation to Dom0 and efficient CPU scheduling becomes even harder when multiple VMs with diverse set of applications are competing for I/O processing in Dom0 ; • Application performance varies significantly under different schedulers even when the schedulers are configured with the same CPU allocation shares; • Application performance is significantly worse under NWCmode when compared to WC-mode (when using similar shares). NWC -mode is an operational requirement for workload managers (it is used to support performance isolation and to deliver resource guarantees between applications). Optimizing CPU schedulers to support a more efficient CPU allocation under NWC -mode is an often overlooked problem. Thus, the choice of the CPU scheduler and its configuration can significantly impact application performance despite supporting similar resource allocation models. In an environment where different
servers may potentially run different CPU schedulers with varying configurations, the job of the workload manager becomes even more complex: migrating a VM to a different node with more resources does not necessarily result in better application performance. Hence, one interesting open question is whether virtualization environments must employ a single CPU scheduler with fixed parameters to successfully manage heterogeneous workloads.
5.2
Scheduler CPU Allocation Accuracy
A traditional metric used in scheduler’s analysis and comparison is the error of CPU allocation. This metric is also important in practice as we discussed in Section 3. Since the decision of workload manager’s controller is based on a difference between assigned and consumed CPU allocation, a scheduler with significant error in CPU allocation may cause unstable controller behavior and as a corollary, lead to a poor application performance. To evaluate the CPU allocation error in NWC-mode for SEDF and Credit schedulers, we designed a simple benchmark, called ALERT (ALlocation ERror Test): • Dom0 is allocated a fixed, 6% CPU share during the all benchmark experiments; it is more than sufficient to run XenMon monitoring tool; • the guest domain Dom1 executes a cpu-hungry loop; • for each benchmark point i the CPU allocation to Dom1 is fixed to Ai , and each experiment i continues for 3 min; • the experiments are performed with Ai = 1%, 2%, 3%, ..., 10%, 20%, ... , 90%. Note that under this benchmark there are no any contention for resources, i.e., there are always enough CPU resources for Dom1 to receive its CPU share. ALERT is truly the simplest test to verify
CREDIT 100
80
80
Normalized Relative Error (%)
Normalized Relative Error (%)
SEDF 100
60 40 20 0 -20 -40
60 40 20 0 -20 -40
0
10
20
30 40 50 60 Targeted CPU Allocation (%)
70
80
90
0
10
20
30 40 50 60 Targeted CPU Allocation (%)
(a) SEDF
70
80
90
(b) Credit
Figure 7: Benchmarking with ALERT: CPU allocation error under SEDF versus Credit schedulers in Xen.
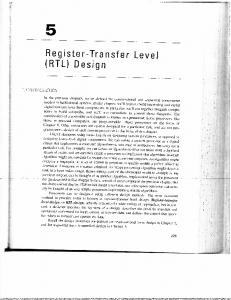
Erik = (Ai − Uik )/Ai We execute ALERT benchmark under SEDF and Credit schedulers in Xen. The Credit scheduler uses 30 ms as a time slice for CPU allocation as described in Section 4. To match the CPU allocation time granularity we use 10 ms period in SEDF in our comparison experiments. Figures 7 a) and b) show the normalized relative errors of CPU allocation with ALERT for SEDF and Credit schedulers respectively at one second time granularity, i.e., we compare the CPU usage Uik of Dom1 measured at each second during experiment i with the assigned CPU allocation value Ai . X-axes represent the targeted CPU allocation, Y-axes show the normalized relative error. Each experiment is represented by 180 measurements (3 min = 180 sec); thus, each “stack” in Figures 7 a) and b) has 180 points and the stack’s density reflects the error distribution. As Figure 7 a) shows the CPU allocation errors under SEDF are consistent and relatively small across all of the tested CPU allocation values. The Credit scheduler has overall much higher allocation error as shown in Figure 7 b). The errors are especially high for smaller CPU allocation targets, i.e., below 30%. 4 Figure 8 presents the distribution of all the errors measured during the ALERT’s experiments for SEDF and Credit respectively. We plot the normalized relative errors measured at 1 second time scale for all the performed experiments in ALERT (18 × 180 = 3240 data points). It is a special version of the CDF (cumulative distribution function), where we plot the CDF of the negative errors (with errors ordered in decreasing order) normalized with respect to all the errors, 4 We had to limit the shown error in Figure 7 b) to the range of [−50%, 100%] for visibility: the actual range of the observed errors is [−100%, 370%].
as well as the complementary CDF of positive errors (with errors ordered in increasing order). We call it CDF−+ . 0.6 SEDF CREDIT 0.5
0.4 CDF
the accuracy of a scheduling algorithm. While it does not guarantee the same CPU allocation accuracy when there are competing VM’s, one can easily extend ALERT to test the CPU allocation error for multiple VMs, as well as for a case with multiple VCPUs per VM. Let Uik denote CPU usage of Dom1 measured during the k-th time interval in benchmark experiment i, e.g., we sample CPU usage of Dom1 at the second time scale in the ALERT experiments. If a CPU scheduler works accurately we should see that for X% of CPU allocation to Dom1 it should consume X % of CPU, i.e., ideally, Uik = Ai for any k-th time interval in benchmark experiment i. Let Erik denote a normalized relative error of CPU allocation defined as follows:
0.3
0.2
0.1
0 -100
-50
0
50 100 150 200 250 Normalized Relative Error (%)
300
350
400
Figure 8: CDF−+ of CPU allocation errors. Figure 8 presents CDF−+ of both positive and negative errors with respect to all the errors. This way, we can see that the Credit scheduler is over-allocating the CPU share more often than underallocating, while for SEDF the under-allocation is a more typical error. As apparent from Figure 8 the Credit scheduler has a much higher CPU allocation error compared to SEDF scheduler: • for Credit, 10% of the points have the negative errors worse than -9.9% while for SEDF only 0.03% of points have the error in this range; • for Credit, 10% of the points have the positive errors larger than 36.3%, while for SEDF there are no error in this range: the maximum positive error is 9.52%. Figure 9 shows the normalized relative errors of CPU allocation at three minute time scale, i.e., we compare the targeted CPU allocation with average CPU utilization measured at the end of each ALERT experiment (each experiment runs for 3 min). Overall, SEDF and Credit show comparable CPU allocation averages over longer time scale. However, the Credit scheduler’s errors are still significantly higher than SEDF’s errors for CPU allocation in the range [1%, 30%] as shown in Figure 9.
tion. Similarly to a 1-CPU case study, we designed 5 different configurations, where we varied the CPU allocated to Dom0 relative to Dom1 , e.g., in Conf 0.25, Dom0 is allocated 0.25 of the CPU allocated to Dom1 . Figure 10 a) shows web server throughput for BVT, SEDF and Credit schedulers under WC-mode. Similarly to 1-CPU case, we can observe
ALERT: CPU Allocation Error (3 min Average) 140 Normalized Relative Error (%)
SEDF CREDIT
10 0 -10 0
10
20
30 40 50 60 Targeted CPU Allocation (%)
70
80
90
Figure 9: Normalized relative error at a longer time scale of 3 min. Since many advanced management tools like workload manager controllers (see Section 3) rely and depend on accurate CPU allocation at a fine time granularity, it is important to optimize the CPU scheduler behavior and minimize the allocation error, as well as to augment the provided CPU schedulers with measured allocation error results.
5.3 SMP Case To efficiently use CPU resources in the SMP configuration a special support is required from the underlying CPU scheduler. Typically, a virtual machine can be assigned multiple virtual CPUs (VCPUs) and an application with multiple processes or threads can have significant performance improvements when multiple VCPUs are executed on different physical CPUs. To further improve the CPU usage efficiency in the SMP configuration, the CPU scheduler might implement a global load balancing functionality that quickly reassigns VCPUs among available physical CPUs. Both BVT and SEDF schedulers do not support global load balancing. It limits their CPU usage efficiency and somewhat might mislead the intended resource allocation. Let us consider the 2-CPU machine. By assigning equal weights and a single VCPU to each of the three VMs, one would expect to get around 66.6% of CPU allocation per VM (200% / 3 = 66.6%). However, this is only achievable when the CPU scheduler implements global load balancing that dynamically balances VCPUs among the physical CPUs. For example, the Credit scheduler in Xen is equipped with global load balancing functionality, it support the expected behavior and provides the expected resource allocation. As for BVT and SEDF, they assign one VCPU to the CPU 1 and the remaining two VCPUs to the CPU 2, in random order, unless the user additionally specifies some affinity rules for VCPUs. Thus, if for example, VCPU 1 was assigned to CPU 1, and VCPU 2 and VCPU 3 are assigned to CPU 2, then under the original equal weight condition, VCPU 1 receives 100% of CPU 1 capacity, while VCPU 2 and VCPU 3 share CPU 2 and each VM receives around 50% of CPU 2 capacity. In this section, we analyze how the additional load balancing capabilities in the Xen CPU schedulers impact their accuracy and the application behavior. Our testbed consists of dual CPU HP workstations LP200R. Figures 10 a) and b) show web server throughput for BVT, SEDF and Credit for a dual CPU machine, where both Dom0 and Dom1 are assigned 2 VCPUs (VCPU stands for virtual CPU). Since the web server application (Apache 2) uses multiple processes for processing different requests, it should be able to benefit of increased capacity of 2-CPU machine and 2 VCPUs assigned to this applica-
• a high sensitivity of application performance to the amount of CPU allocated to Dom0 ; • a significant difference in web server throughput under different schedulers, especially, for a configuration when Dom0 and Dom1 have equal weights. If we compare web server maximum throughput achieved for 1-CPU machine and 2-CPU machine (i.e., with doubled CPU capacity), then performance improvements are lower when one would expect. For BVT, the web server throughput increases by 45%, for SEDF it increases by 30%, and for Credit it increases by 24%. In these experiments, we are not limited by network bandwidth, therefore these numbers indicate some inefficiency in the underlying resource allocation. Figure 10 b) shows web server throughput for the SEDF and Credit schedulers under NWC-mode. While maximum web server throughput achieved for SEDF is still higher than for Credit, the marginal improvement with Credit is higher than with SEDF when compared to the single CPU case: there is 42% improvement under Credit, while only 15% improvement under SEDF. Figure 10 c) presents the results of a simple scaling exercise. Xaxes show the number of VMs created on the system: each VM is configured with 2 VCPUs, it runs a web server, and all the domains, including Dom0 , are assigned equal weights under WC-mode. The httperf tool has a matching number of instances: each one issues the same workload rate to the corresponding web server. Figure 10 c) reports the maximum overall (combined) web server throughput delivered by one VM, two VMs, three VMs, and four VMs respectively. We speculated that with multiple domains the overall throughput might be higher because multiple domains might better utilize the CPU capacity in the SMP configuration. While all the three schedulers show 10% drop in web server throughput when switching from one guest domain to two guest domains, the Credit scheduler shows an improved throughput for the three and four guest domains (due to its global load balancing capabilities); while BVT and SEDF schedulers show “flat” web server throughput for the increased number of guest domains. We omit graphs showing iperf and disk read performance because they are very similar to the results presented in Section 5.1, with only a small increase in throughput. In Section 5.2, we designed the ALERT benchmark for evaluating the CPU allocation error in 1-CPU configuration. As we noted earlier, the Credit scheduler is capable of doing transparent load balancing across multiple CPUs. We therefore evaluate it on a dual CPU system to quantify the CPU allocation error. By understanding the CPU allocation errors in a single CPU case and SMP configuration, one can make an intelligent choice on VM management policy design. Figure 11 a) presents CDF−+ o the CPU allocation error for three domains each running a cpu-hungry loop, and each one is allocated 66% of CPU in 2-CPU configuration. We use Dom0 , Dom1 , and Dom2 in these experiments. Each experiment is performed for 10 min, and the CPU allocation error is reported at 1 second granularity. The CPU allocation error introduced by the global load balancing schema is relatively high when observed at a fine time granularity. Since the decision of workload manager’s controller is based on a difference between assigned and consumed CPU allocation, the
Web Server, SMP
Web Server, SMP
1350
1400 SEDF CREDIT
900 Throughput (req/sec)
1300 1250 1200 1150 1100 1050
800 700 600 500
1000 400
950 900
300 0
0.5
1
1.5
2
2.5
3
3.5
4
SEDF CREDIT BVT
1300 1200 1100 1000 900 800
0
Dom0 Weight relative to Dom1 Weight
0.5
1
1.5
2
2.5
3
3.5
4
1
Dom0 Weight relative to Dom1 Weight
(a) Web server, WC-mode
(b) Web server, NWC-mode
2
3
4
Number of VMs
(c) Web server, WC-mode, 1 to 4 VMs.
Figure 10: Web Server Performance under Different Schedulers in Xen (SMP case).
1 Dom0 0.9 Dom1 Dom2 0.8 0.7 0.6 CDF
Throughput (req/sec)
Web Server, SMP
1000 SEDF CREDIT BVT
Overall System Throughput (req/sec)
1400
0.5 0.4 0.3 0.2 0.1 0 -40
-30
-20 -10 0 Normalized Relative Error (%)
10
20
Figure 11: CPU allocation error, Credit, SMP case, 3 domains, NWC -mode, 66%:66%:66%. management solution may be tuned to use for stability a coarser time granularity where the CPU allocation exhibits a higher accuracy.
6.
RELATED WORK
Conventional operating systems typically employ a simple notion of priority for process scheduling. A task with a higher priority is scheduled prior to a task with a lower priority. Priorities may be static or they can be dynamically recalculated. While there are many sophisticated priority schemas, the meaning of the assigned process priorities is not intuitive and often the performance characteristics of such schedulers are difficult to understand [8]. For example, decay usage scheduling [16] is a priority and usage based mechanism for CPU scheduling employed by BSD [19] Unix and a few other operating systems. Decay usage scheduling is motivated by two concerns: fairness and performance. Fairness is achieved by allocating the CPU slice to processes that have received fewer slices in the recent past. In such a way, the I/O-bound process will be dispatched to receive CPU before the compute-bounded processes, which improves throughput by overlapping CPU and disk/network activities. While decay usage and other priority schedulers can provide fairness and performance, achieving service rate objectives or quantitative objectives for CPU consumption, for example to ensure that a particular application receives 50% of the CPU usage, remains difficult. To overcome this shortcoming, different scheduling mechanisms were introduced, for example, fair-share schedulers [10, 17, 18]. The fair-share schedulers were introduced to provide propor-
tional sharing among processes and users in a way compatible with a UNIX-style time sharing framework. Each client has a priority which is adjusted as it executes. The fair-share scheduler will provide proportional-share among the clients by adjusting the priorities of clients in the appropriate way. However, the algorithms used by these systems are complex, requiring periodic usage updates, complicated dynamic priority adjustment and correct parameter setting to ensure fairness at a time scale of minutes. Empirical measurements show that most fair-share schedulers provide reasonable proportional fairness over relatively large time intervals [10]. It is almost certainly the case that the CPU allocation errors can be very high. Lottery scheduling [24] provides a more disciplined proportional sharing approach than fair-share schedulers. Each client receives a number of tickets proportional to its share. A lottery scheduler then randomly picks a ticket and schedules the client that owns this ticket to receive a CPU slice. Several previous systems [24, 13, 23, 21] use the same virtual time basis as BVT [9] for measuring and controlling long-term sharing of the CPU. However, most do not provide control over low-latency dispatch, but some of them that have such a control do introduce extra mechanisms such as deadlines. In a deadline-based scheduling system, such as Atropos [20], the processes declare future CPU needs to the system: the process can express a required CPU reservation and CPU needs per time period. Thus the scheduler uses real time-algorithms to ensure time guarantees. The problem of scheduling periodic tasks with hard deadlines was well researched in the literature for real-time applications. The literature contains a variety of techniques for scheduling processes and tasks. However, resource multiplexing and scheduling among virtual machines is not well understood. Additional complexity in scheduling and CPU allocation of virtual machines is introduced by a variety of I/O models used by different virtualization platforms. We use the open source Xen virtual machine monitor to perform a comparative evaluation of three different CPU schedulers for virtual machines and analyze the impact of the CPU scheduler and resource allocation on application performance.
7.
CONCLUSION
In this work, we analyze and compare three proportional-share CPU schedulers for virtual machines. We present a sensitivity study showing how both the CPU scheduling algorithm and the scheduler parameters can drastically impact the performance of I/O intensive applications running on virtual machines. To demonstrate performance sensitivity, we use three relatively simple system benchmarks that approximate disk and network intensive workloads, and inter-
rupt driven applications like a web server. We also introduce a simple benchmark, called ALERT, for measuring the CPU allocation errors in these schedulers. In the process, we hope to have motivated the larger problem: resource allocation among VMs is poorly understood, and we have taken a first step towards understanding CPU scheduling issues in this paper. As VM technologies evolve, their I/O model will certainly undergo some changes. However, it is unlikely that resource allocation problems (such as those described in this paper) will disappear anytime soon. For instance, for fully virtualized guests, Xen employs a per-VM user space process running in Domain-0 to perform I/O emulation. Since Domain-0 is indirectly involved in servicing I/O for the VMs, resource allocation for Domain-0 and its impact on VM performance remains an issue. In fact, Domain-0’s involvement is not a prerequisite to these problems. The deeper issue is the impact of cross-system interactions on application performance in VMs. Consider that Xen is considering moving the I/O emulation from Dom0 into per-VM “stub domains” [22]. While this might alleviate some of the problems found in our work (for instance, resource accounting will become easier), we still need to understand resource contention between stub domains and its impact on performance. The scheduler allocation inaccuracies noted in this paper would also continue to be an issue. Similarly, virtualization-aware I/O devices (with multiplexing capabilities in hardware) will ease the problem somewhat, however the CPU might still remain on the critical path for most I/O operations. It is conceivable, however, that a combination of better I/O hardware and multi-core processors will alleviate the problem in the case where the number of available cores exceeds the inherent parallelism in the workload. Thus far, all our experiments have focused on one particular virtualization platform: Xen. Our motivation for using Xen, among others, was source code availability and the freedom to modify it. However, we stress that as long as the I/O model involves services being provided by an entity external to the VM, resource allocation problems will remain. The only difference is that, in the case of Xen (where we have a split device driver model and a choice of CPU schedulers), the problems are exposed to the end user whereas in platforms where the device drivers are in the hypervisor and there is no choice in CPU schedulers, the end user is not directly concerned with these issues. However, the developers of the hypervisor will most certainly need to address the problem of allocating resources to the hypervisor for providing services, while making decisions on the choice of scheduler and scheduler parameters. At first glance, it may seem that the choice of VM scheduler and parameter configuration is not relevant to most users because they are often shielded from such decisions. However, our experience suggests that “reasonable defaults” (e.g., equal weights that are typically used in WC-mode) are not very useful beyond toy experiments. For any serious VM deployment, the platform will need to give users control over the scheduling parameters and provide flexible mechanisms that allow a wide variety of resource allocation policies. Our experiences with Xen’s CPU schedulers suggests that our understanding of VM resource allocation issues is far from complete, and opens several interesting avenues for future research.
8.
ACKNOWLEDGEMENTS
The authors owe warm thanks to Stephan Diestelhorst and Timothy Roscoe for discussions on implementation issues and algorithm details of SEDF, to Emmanuel Ackaouy for explanations of Credit scheduler and his hearty reaction to the first informal “accuracy” results that led to a significantly improved Credit scheduler’s implementation that was presented in this paper. Many thanks to our HPL colleagues Hernan Laffitte and N.K. Krishnan for their help with the Xen testbed.
9.
REFERENCES
[1] Credit Scheduler. http://wiki.xensource.com/ xenwiki/CreditScheduler. [2] HP-UX Workload Manager. http://www.hp.com/ products1/unix/operating/wlm/. [3] Httperf. http: //www.hpl.hp.com/research/linux/httperf/. Last accessed 1/17/2006. [4] IBM Enterprise Workload Manager. http://www.ibm. com/developerworks/autonomic/ewlm/. [5] Iperf: The TCP/UDP Bandwidth Measurement Tool. http://dast.nlanr.net/Projects/Iperf. [6] P. Barham, B. Dragovic, K. Fraser, S. Hand, T. Harris, A. Ho, R. Neugebauer, I. Pratt, and A. Warfield. Xen and the art of virtualization. In Proceedings of the 19th ACM SOSP, 2003. [7] L. Cherkasova and R. Gardner Measuring CPU Overhead for I/O Processing in the Xen Virtual Machine Monitor. In Proceedings of the Annual Technical Usenix Conference, 2005. [8] H. M. Deitel. Operating Systems. Addison-Wesley, 1990. [9] K. J. Duda and D. R. Cheriton. Borrowed-virtual-time (BVT) scheduling: supporting latency-sensitive threads in a general-purpose scheduler. In Proceedings of the 17th ACM SOSP, 1999. [10] R. B. Essick. An event based fair share scheduler. In Proceedings of the Winter USENIX Conference, 1990. [11] K. Fraser, S. Hand, R. Neugebauer, I. Pratt, A. Warfield, and M. Williamson. Reconstructing I/O. Technical report, 2004. [12] T. Garfinkel and M. Rosenblum. When virtual is harder than real: Security challenges in virtual machine based computing environments. In Proceedings of the 10th HotOS, 2005. [13] P. Goyal, X. Guo, and H. M. Vin. A hierarchial cpu scheduler for multimedia operating systems. In OSDI ’96: Proceedings of the second USENIX symposium on Operating systems design and implementation, pages 107–121, New York, NY, USA, 1996. ACM Press. [14] D. Gupta, L. Cherkasova, R. Gardner, and A. Vahdat. Enforcing Performance Isolation Across Virtual Machines in Xen. In Proceedings of the 7th International Middleware Conference, 2006. [15] D. Gupta, R. Gardner, and L. Cherkasova. XenMon: QoS Monitoring and Performance Profiling Tool. Technical report, HPL-2005-187, 2005. [16] J. L. Hellerstein. Achieving Service Rate Objectives with Decay Usage Scheduling. In IEEE Transactions on Software Engineering, 1993. [17] G. J. Henry. The fair share scheduler. AT&T Bell Labs Technical Journal, 63(8):1945–1957, 1984. [18] J. Kay and P. Lauder. A fair share scheduler. Commun. ACM, 31(1):44–55, 1988. [19] S. J. Leffler, M. K. McKusick, and M. J. Karels. The Design and Implementation of the 4.3 BSD Unix Operating System. Addison-Wesley, 1988. [20] I. M. Leslie, D. Mcauley, R. Black, T. Roscoe, P. T. Barham, D. Evers, R. Fairbairns, and E. Hyden. The Design and Implementation of an Operating System to Support Distributed Multimedia Applications. IEEE Journal of Selected Areas in Communications, 1996. [21] J. Nieh and M. S. Lam. A smart scheduler for multimedia applications. ACM Trans. Comput. Syst., 21(2):117–163, 2003. [22] I. Pratt. Xen Roadmap. http: //wiki.xensource.com/xenwiki/XenRoadMap. [23] I. Stoica, H. Abdel-Wahab, K. Jeffay, S. K. Baruah, J. E. Gehrke, and C. G. Plaxton. A proportional share resource allocation algorithm for real-time, time-shared systems. In RTSS ’96: Proceedings of the 17th IEEE Real-Time Systems Symposium (RTSS ’96), page 288, Washington, DC, USA, 1996. IEEE Computer Society. [24] C. A. Waldspurger. Lottery and stride scheduling: Flexible proportional-share resource management. Technical report, Cambridge, MA, USA, 1995.


![ModelSim Tutorial - UCSD CSE [PDF]](https://m.moam.info/img/260x300/modelsim-tutorial-ucsd-cse-pdf_64799306098a9e495b8b45ed.jpg)