Previous research indicates that a perceived .... University of Illinois at Urbana-Champaign, Urbana,. IL 61801. This work .... master, Maple Park, IL), drip tubing.
Compatibility of Biocontainers in Commercial Greenhouse Crop Production Andrew Koeser1,4,9, Gary Kling1,5, Candice Miller2,6, and Daniel Warnock3,7,8 ADDITIONAL INDEX WORDS. pots, sustainability, ebb-and-flood, drip irrigation, overhead irrigation, mechanized production SUMMARY. Despite consumer interest in biocontainers, their use in commercial greenhouse production remains limited. Previous research indicates that a perceived incompatibility of biocontainers with current production systems may be a barrier to their widespread adoption. This article investigates two potential areas of concern for growers looking to adopt biocontainers as part of their production process: 1) the ability of biocontainers to withstand the rigors of a semimechanized commercial production process, and 2) biocontainer performance under three different irrigation methods (i.e., hand, ebb-and-flood, and drip irrigation). In the two studies presented here, ‘Florida Sun Jade’ coleus (Solenostemon scutellarioides) was evaluated to match measures of container resiliency with plant performance. Results indicate that plants grown in biocontainers were of equal size and quality as those grown in conventional plastic containers within each of the irrigation types tested. However, some biocontainers were more prone to damage during crop production, handling, and shipping.
M
arket research has shown that environmentally conscious consumers are willing to pay more for products developed by companies that incorporate sustainable business practices (Blend and van Ravenswaay, 1999; Thompson and Kidwell, 1998; Yue et al., 2011). Beyond the acceptance of premium pricing, green consumers have shown loyalty to businesses that embrace their environmental ideals (Yue and Tong, 2009). When one looks at issues of sustainability and horticultural sales, container type is consistently listed among the top factors having a positive impact on consumer product perception (Dennis et al., 2010; Hall et al.,
Research conducted by Daniel Warnock while at the University of Illinois at Urbana-Champaign, Urbana, IL 61801. This work funded in part by the Illinois Department of Agriculture, project number IDOA SC 10 36. We gratefully acknowledge the technical support and facilities made available to us by Mid-American Growers, Inc., Granville, IL.
2010; Yue et al., 2011). As a highly visible symbol of past production processes, container type has generated more interest than ‘‘behind the scenes’’ practices such as organic fertilizer or efficient greenhouse space usage (Yue et al., 2011). Similar results were found in the work by Hall et al. (2010), who found that container type outweighed all other purchasing considerations— including price and carbon footprint. These findings have led researchers to state that consumers are more interested in making the pots sustainable than the plants themselves (Yue et al., 2011). Despite this consumer interest, biocontainers as a whole have yet to be widely embraced by the greenhouse and nursery industry. Hall et al. (2009) found that over 22% of growers surveyed indicated that they had used biocontainers in their operations. Of the remaining 78% that participated in the study, only 6% noted that they would like to add biocontainers to their current production processes
(Hall et al., 2009). Similarly, research by Dennis et al. (2010), reported that 12% of greenhouse growers acknowledged prior use of peat pots in their operations. Within this 12%, respondents estimated that peat pots comprised less than 3% of their total container consumption (Dennis et al., 2010). These figures support a general consensus that the widespread use of biocontainers has been largely limited by their higher cost and perceived limitations (Helgeson et al., 2009; Kuehny et al., 2011). Conventional plastic containers remain popular given their ability to provide consistent performance (e.g., comparable wet/dry strength, compatibility with equipment) in production systems. This effectively removes one of the many possible variables a grower must contend with when attempting to produce a uniform crop of high-quality plants. The price of plastic still remains relatively inexpensive and economically accessible to ornamental crop growers (Evans and Hensley, 2004; Helgeson et al., 2009). For its cost, plastic is strong, lightweight, and versatile. These properties make it fully compatible with mechanized production processes and ideal for shipping (Evans and Hensley, 2004; Hall et al., 2010; Helgeson et al., 2009). Given the reliability of plastic, growers—especially growers with large operations—are hesitant to move toward any container that they feel may pose a risk to their crop or be difficult to implement in their existing production practices (Dennis et al., 2010; Hall et al., 2009). Despite this aversion to risk, greenhouse growers (in contrast with nursery growers and nursery/ greenhouse growers) ranked issues of compatibility as a minor barrier, indicating that perhaps flexibility in production practices, equipment, and crops may allow for greater adoption of biocontainers (Dennis et al., 2010). Although some published research has quantified biocontainer resistance
1 Department of Crop Sciences, University of Illinois at Urbana-Champaign, Urbana, IL 61801 2
University of Illinois Extension, Oregon, IL 61061
Units
3
Monsanto, Chesterfield, MO 63017
To convert U.S. to SI, multiply by
U.S. unit
SI unit
To convert SI to U.S., multiply by
0.3048 2.54 0.0044 1.6093 28.3495 1 (�F – 32) O 1.8
ft inch(es) lbf mile(s) oz ppm �F
m cm kN km g mg�L–1 �C
3.2808 0.3937 224.8089 0.6214 0.0353 1 (�C · 1.8) + 32
4
Graduate Research Assistant
5
Associate Professor
6
Extension Educator in Horticulture
7
Plant Growth Resource Management Lead
8
Principal Investigator
9
Corresponding author. E-mail: arborkoeser@yahoo. com. •
April 2013 23(2)
149
RESEARCH REPORTS to puncturing and crushing as indicators of container resiliency in production processes (Evans and Karcher, 2004; Evans et al., 2010), the current range of biocontainers on the market have yet to be thoroughly tested in the mechanized systems required for high throughput production of crops grown in greenhouses. As shown in this article, in situ commercial testing is needed to assess impacts on system efficiency beyond container breakage (e.g., time to process). Furthermore, previous biocontainer growth studies under research greenhouse conditions have focused exclusively on hand irrigation as a means of water delivery (Evans and Hensley, 2004; Evans and Karcher, 2004). However, commercial greenhouses often rely on a variety of irrigation methods beyond overhead watering (e.g., drip irrigation and ebb-and-flood irrigation)— each with its own pattern of initial wetting and saturation that could potentially impact biocontainer durability during crop production. This work reports findings from two separate, but complimentary studies. The first is a series of interrelated experiments designed to determine whether biocontainers can withstand the rigors of high throughput, commercial greenhouse production—namely, semimechanized filling, transplanting, handling, and shipping. In addition, this study includes two successive growth trials (drip irrigation only) intended to determine if container root zone conditions, and ultimately plant shoot growth, are affected by container type. The second study expands on the first
set of growth trials, as well as the existing body of biocontainer research, through the inclusion of an irrigation method factor. Measures of plant growth and container strength were conducted to determine the impact of drip irrigation, hand watering, and ebb-and-flood irrigation on crop and container performance. The combined product of these efforts contributes to the growing body of biocontainer research while helping professional growers make more informed decisions on whether these plastic pot alternatives can be incorporated in their own operations.
Materials and methods CONTAINERS. Eight container types (one control and seven biocontainer alternatives) were compared in all experiments (Table 1). LOCATIONS. The mechanical filling and spacing experiments were conducted at a wholesale commercial greenhouse facility (Mid-American Growers, Granville, IL). Both greenhouse growth trials were conducted at a university research facility (Plant Science Laboratory, University of Illinois at Urbana-Champaign, Urbana, IL). The route for the shipping experiment connected these two locations. Container strength testing was conducted at a university materials testing facility (Advanced Materials Testing and Evaluation Laboratory, University of Illinois at Urbana-Champaign, Urbana, IL). MECHANICAL FILLING. This experiment was a randomized complete
block design with four separate runs serving as blocks. Within each run, the eight pot types were sent through a gravity-fed pot-filling machine (model PM1100; Agrinomix, Oberlin, OH) in batches of 50 transport trays. Although container sizes were selected to provide similar rooting volume for the later greenhouse trial, differences in width and height required the use of both six-cell and eight-cell azalea transport trays (Landmark Plastics, Akron, OH) during the filling experiment. As a result, each batch of 50 trays consisted of either 300 or 400 total pots. Four workers were involved in the filling process—one person to load the transport trays onto the conveyor belt; two to unstack the pots, load them into the transport trays, and ensure that the machinery was running properly; and one person to load the trays onto carts after going through the filling machine. The pot-filling machine and conveyors were adjusted between each run to meet various pot height requirements. The calibration time was not included in the total run time. Data gathered during this procedure included proportion of pots damaged by machinery (e.g., crushed, torn, or punctured pots), proportion of pots unfilled (defined as more than 33% of pot volume devoid of soil), and total elapsed pot filling time (starting with placement of the first tray at the beginning of the line and ending with the removal of the last tray at the end of the line). MECHANICAL SPACING. Lifter bars were used in a simulated spacing trial to assess compatibility with the
Table 1. Containers evaluated in all greenhouse and industrial trials in this article. Greenhouse trials investigated the growth of ‘Florida Sun Jade’ coleus in the containers below when watered using a variety of irrigation methods (i.e., drip irrigation, ebb-and-flood table, and hand watering with a wand). Industrial trials assessed container damage as a result of mechanical filling, lifting, and shipping. Container typez
Approximate vol (L)y
Product namex
Manufacturer
Plastic (control) Wheat-based bioplastic (bioplastic) Coir Pressed manure (manure) Paper
1.3 1.2
JanorPotÒ 15cm-L 15cm-L TerraShellTM/OP47
Summit Plastic Co., Akron, OH Summit Plastic Co.
1.3 1.2 1.0
Dillen Products, Middlefield, OH CowPots Manufacturing and Sales, East Canaan, CT ITML Horticultural Products, Middlefield, OH
Peat Straw Wood fiber
0.7 0.8 3.9
6$ Round Coir Pot 6$ Round 5$ KordÒ Fiber Grow Round Pot Jiffy-potsÒ 5 5$ Straw Pot 7X7RD
Jiffy Products of America Inc., Lorain, OH Ivy Acres, Baiting Hollow, NY Western Products Co., Corvallis, OR
z y
Shortened descriptions appearing in parenthesis will be used throughout this article. 1 L = 0.2642 gal. Product names are as listed in their respective company’s catalog.
x
150
•
April 2013 23(2)
biocontainers tested. As with the filling trial, individual differences in container dimensions influenced sample size. To account for differences in pot widths, one of three lifter bars was selected for each pot type in this trial: 4-inch, 15pot spacer bar; 6-inch, 10-pot spacer bar; and 8-inch, 7-pot spacer bar (FW Systems, Bergschenhoek, The Netherlands). In addition to the eight container types, two different levels of a ‘‘shelf life’’ factor were used during this experiment. The first group in this factor was comprised of pots that had been filled with soil and watered just before the lifting test. The second level was comprised of containers under greenhouse conditions 4 weeks after transplanting. This second set of containers was also watered just before lifting. A simulation of mechanical spacing equipment was used for this trial. The downtime and labor associated with changing pot lifter bars and calibrating the mechanical spacer were prohibitive given the small volume of pots in each treatment. Thus, lifter bars were raised manually to assess whether the biocontainers tested were compatible with mechanical spacing equipment. The appropriate number of pots was lined up across the bench. The pots were lifted with a person on each end of the spacer bar to a height of �1 ft and then set down and released �1 ft away from the original location (similar to the mechanical spacing process). This procedure was replicated a total of four times per pot type in a randomized order for both treatments. After each lift, data were collected on the number of pots damaged during spacing, the number of pots spilled during spacing, and the number of pots not picked up by the spacer bar. SHIPPING. Pots filled with soilless media and arranged in shuttle trays were watered just before this trial, loaded onto rolling greenhouse carts, and loaded onto a box truck for transportation to and from the two sites in this trial. At each destination point, pots were unloaded and inspected for fraying, tears, gashes, creasing, crushed areas, and other signs of damage. Data from one-way trips (200 km) were used in this analysis to minimize any confounding factors associated with pot handling by mechanized equipment or simulated mechanized handling while at each site. For each container type, •
April 2013 23(2)
12 groups of five similar containers (n = 60) were used to assess the proportion of pots damaged during transport. G ROWING CONDITIONS ( BOTH GREENHOUSE TRIALS). Each of the two greenhouse trials listed below (i.e., drip only and hand, drip, and ebb-andflood irrigation) were repeated. The first and second iterations of the two experiments began on 28 Apr. and 28 June 2010, respectively. All pots were mechanically filled with a peat-based substrate (85 peat:15 perlite by volume, Mid-American Growers) and planted with rooted cuttings of ‘Florida Sun Jade’ coleus. These cuttings were grown under ambient light with minimum day and nighttime temperatures set at 24 and 18 �C, respectively. Plants were fertigated weekly (with one key exception detailed below) with a 250 ppm 20N–8.7P–16.6K fertilizer solution (Plantex 20–20–20 All Purpose Fertilizer; Plant Products, Brampton, ON, Canada). All plants were pinched in week 3 after planting to promote branching. Trials were concluded once the plants reached market-ready size (week 7). GREENHOUSE TRIAL—DRIP IRRIGATION. This experiment was a completely randomized design with groups of five similar containers serving as the experimental unit (n = 6 groups for the two trials). Plants were placed on metal mesh greenhouse benches with drip tubes (Chapin tube weights; JainÒ Irrigation, Fresno, CA). Water was applied uniformly across all container treatments when �25% of the potted plants showed visible drying on the surface of the media. Irrigation frequency was recorded, and weekly aboveground plant volume (i.e., the product of two perpendicular diameters and the height to the apical meristem), as well as pH and electrical conductivity (EC) measurements of pot leachate were taken. Container leachate was analyzed with a portable pH and EC meter (HI 98129 pH/conductivity/TDS tester; Hannah Instruments, Smithfield, RI) using a pour-through measurement technique. Dry shoot weight and total leaf area were quantified at the end of each trial. G R E E N H O U S E T R IA L — H A N D , DRIP, AND EBB-AND-FLOOD IRRIGATION. Plants were watered using one of three irrigation methods: ebb-and-flood table (Ebb-Flo bench; Midwest GROmaster, Maple Park, IL), drip tubing
(Chapin tube weights), or hand watering with an irrigation wand. Ebb-and-flood tables were set for slow fill, fast empty with a 20-min, manually triggered watering cycle. Drip irrigation was set to run for 1 min after being manually set to run. Water was applied uniformly across all container and irrigation method combinations when �25% of the potted plants showed visible drying on the surface of the media. As fertilizer was premixed in the ebb-and-flood reservoir tank, plants given this irrigation level were fertilized at every watering, not every week as with the drip and hand irrigated treatments (limitations are discussed below). The large footprint of the ebband-flood tables limited randomization and necessitated a split-plot design. Irrigation was considered the whole-plot factor and container type was designated the subplot. Each whole plot was replicated three times per trial and contained 40 individual pots arranged by container type in groups of five. Response values for each of the individual pots in these groupings were averaged making subplot the experimental unit (total n = 144). Watering frequency for each irrigation level was recorded throughout the study period. In addition, substrate pH and EC readings were taken on a weekly basis. Final plant growth was measured as dry shoot weight. CONTAINER STRENGTH TESTING—HAND, DRIP, AND EBB-ANDFLOOD IRRIGATION. After plant harvest, pots were emptied and allowed to dry. A random selection of used pots representing each container type/irrigation system combination was taken to a materials testing laboratory to evaluate the crush (n = 5) and puncture strength (n = 5). In addition, new containers were strength tested as a comparison with pots that had been used in production (n = 8). A portion of these new containers were tested dry (n = 5). The remaining containers were submerged in water for 24 h and tested while still saturated to assess wet strength (n = 3). STATISTICAL ANALYSIS. Unless otherwise noted, all conclusions are made at an a = 0.05 level of Type I experimental error. Container damage and filling success data from the pot filling experiment were analyzed via analysis of deviance within the generalized linear model (GLM) function of 151
RESEARCH REPORTS R [version 2.14.2 (R Development Core Team, 2012)]. Wood fiber containers were not included in the pot filling analysis, as they did not fit in the transport trays used for testing. The remaining seven container types were fit to a GLM with a quasibinomial distribution specified to account for overdispersion (Crawley, 2005). A left-tailed Dunnett’s test (to see if the proportion of undamaged/filled containers decreased as compared with plastic control) was completed using the MULTCOMP function (Hothorn et al., 2008) in R. Pot filling speed was standardized as the time (in minutes) required to fill 100 containers. These data were analyzed with the analysis of variance (ANOVA) within the AOV function of R (version 2.14.2). Means separations were completed using a righttailed Dunnett’s multiple comparison test (to see if time increased) with the plastic container designated as the control. Pot shipping was also analyzed via analysis of deviance. For this data set, neither the wood fiber nor the paper containers experienced any damage. To contend with this lack of variation, these two treatments were removed from the analysis. As with the filling data, a quasibinomial distribution was specified given the presence of overdispersion. A left-tailed Dunnett’s multiple comparison test was conducted against the plastic control. The influence of container type on plant volume, potting mix EC, and potting mix pH were analyzed using repeated measures with the MIXED procedure of SAS/STAT (version 9.2; SAS Institute, Cary, NC). Final leaf area and final dry shoot weight for the greenhouse trials were
assessed using ANOVA within the MIXED procedure of SAS/STAT. A log10 transformation was applied to the observed dry shoot weights to meet the assumptions of normality and homogeneity of variance required for the analysis assumptions. Crush strength and puncture strength were assessed using ANOVA as part of the GLM procedure for SAS/STAT. Plastic, straw, coir, and bioplastic containers were not included in the puncture analysis. These materials are very flexible and resisted penetration when tested with the metal probe. A square root transformation was applied to the response variable, load (in kilonewtons), to meet the assumptions (particularly homogeneity of variance) required for the analysis of the crush data. A log10 transformation was applied to the load measurements from the puncture testing for similar reasons. When making plant growth and container strength comparisons between irrigation types (i.e., hand, drip, and ebb-and-flood), probability values from post hoc contrasts have been included to supplement the figures in cases where it may be difficult to make clear separations of means using the confidence interval bars.
Results and discussion MECHANICAL FILLING. The proportion of successfully filled pots did not vary by run/block (P = 0.1998) or by container type (P = 0.5993). However, the proportion of damaged containers did vary among the containers tested (P = 0.0679) (Table 2). In addition, blocking/run was significant (P = 0.0198) with regard to container damage. Compared with the plastic control, coir (P = 0.0098),
pressed manure (P = 0.0055), paper (P = 0.0181), and peat pots (P = 0.0204) were more likely to be damaged by the filling machine (Table 2). Despite these statistical differences, none of the containers experienced damage levels greater than 1.5%. As many of the biocontainers had not been used at the facility before, it is conceivable that the proportion of damaged pots could decrease as workers become more familiar with the products. The differences seen between runs show the impact of initial machine calibration and setup when switching container types. For the potting equipment used in this experiment, the most crucial adjustment involved setting the overhead brushes that sweep excess potting mix from tops of the containers to the appropriate height (Fig. 1). Brushes were manually adjusted to minimize damage while maintaining effectiveness. Slight inconsistencies in this process or in the containers themselves (i.e., some have irregular rims) may account for the differences seen between runs. The results of the mechanical filling trial suggest that damage to containers is a more pressing concern than filling success, given the pots and equipment used. Individual container properties contributed to the differences in damage among the products tested. Containers made from flexible materials (e.g., plastic, bioplastic, and straw) experienced a lower proportion of damage than containers constructed with brittle material (e.g., manure, peat, and paper; Table 2). Coir pots, though relatively flexible in nature, were prone to fraying as the tops were brushed to remove excess potting mix. If some tearing or chipping of the container top is acceptable, even the level of
Table 2. Proportion of unfilled or damaged containers for mechanical filling and shipping trials. Values are given as the number of unsuccessfully processed pots per 100 pots. Eight container types (one control and seven biocontainer alternatives) were used in both trials. For the filling trial, containers were run through a gravity-fed filling machine (model PM1100; Agrinomix, Oberlin, OH) in trays. For the shipping trial, containers (in trays) were transported �200 km (124.3 miles) in a box truck.
Control Filling-unfilled Filling-damaged Shipping-damaged
0.29 0.11 1.67
Bioplastic 0.33 0.33 8.33
Proportion of unfilled or damaged containers (%)z Container type Coir Paper Peat Pressed manure 0.33 1.25* 8.33
1.25 1.08* 0.00
0.50 0.87 35.00**
0.58 1.42** 26.67**
Wood fiber y
na nay 0.00
Straw 0.31 0.50 6.67
z
Comparisons are made across rows. Multiple comparisons were not conducted for the filling-unfilled response (first row) as pot type was nonsignificant. Mean separation was conducted as a left-tailed Dunnett’s test with the plastic container designated as ‘‘control.’’ Estimates significant at the 0.05 and 0.1 levels are marked with a double asterisk (**) and single asterisk (*), respectively. y Wood fiber containers were not included in the filling analysis as appropriate transport trays were not available for this pot type.
152
•
April 2013 23(2)
Table 3. Time required to fill 100 containers. Filling time included denesting new containers, loading them into shuttle trays, mechanically filling with a potting machine (model PM1100; Agrinomix, Oberlin, OH), and removing shuttle trays from the conveyor. Container typez
Filling time (min) Avgy SE
Control Bioplastic Coir paper Peat Pressed manure Straw
1.25 1.56** 1.30 1.32 1.81*** 2.17*** 2.31***
0.047 0.113 0.058 0.039 0.063 0.095 0.119
z
Wood fiber containers were not included in the filling analysis as appropriate transport trays were not available for this pot type. y Mean separation was conducted as a left-tailed Dunnett’s test with the plastic container designated as ‘‘control.’’ Estimated differences significant at the 0.01 and 0.05 levels are denoted with a triple asterisk and a double asterisk (**), respectively.
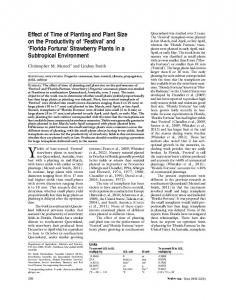
Fig. 1. As trays of straw pots exit the gravity-fed filling machine (model PM1100; Agrinomix, Oberlin, OH) a rotating brush sweeps off excess potting mix. Proper adjustment of this brush was critical in the prevention of container damage and tipping.
damage seen among the worst performing containers may be well within the tolerances of a grower. With regard to pot filling speed, both container type (P < 0.0001) and run (P = 0.0054) were significant factors. At our particular study site, conveyor belt speed, and therefore run time, was ultimately most affected by the rate at which pots were unstacked and loaded into shuttle trays. As containers were placed in the trays, the worker stationed at the filling machine controls adjusted the belt speed to match the pace of the process. Any container type that resisted separation during unstacking, ultimately increased the time needed to complete a particular run. This was reflected in our calculated times for filling 100 containers (Table 3). Peat, pressed manure, and straw containers were substantially slower to fill than the control or other pot types. MECHANICAL SPACING. Straw and peat containers were excluded from the spacing trial as the proper sized lift bars for these pots were unavailable •
April 2013 23(2)
from the commercial collaborator. This highlights the first of several issues associated with switching to alternate pot types in a commercial facility. Additional capital may be needed to purchase new or modify existing equipment to successfully implement the use of novel pot sizes. Furthermore, the slightly greater than one-half circle slots of many of the metal spacer tines combined with flexibility of the wetted pressed manure and paper containers caused these containers to wedge into slots in the spacer bars, making a clean release after lifting difficult (Fig. 2). Given some of the complications noted above, no formal statistical analysis is included. However, several insights were gained from this work. In the lifting tests, damage was only seen in the pressed manure containers (2.2%) and occurred as a direct result of the issue with the spacers noted above. Lifting success of containers made of coir, paper, and wood fiber was 28.8%, 69.8%, and 91.9%, respectively. For the plastic, bioplastic, and pressed manure containers, 99% to 100% of the containers were lifted successfully. For the coir containers, the absence of a lip on the top edge of the pot was a key limitation to lifting success. Although paper containers did feature a lip, it was not strong enough to support the container under wetted conditions.
These results show the importance of matching an appropriate spacer bar to the container used in production. Growers are encouraged to work with manufacturers to determine the appropriate spacing equipment for the biocontainer being considered for adoption. SHIPPING. The proportion of pots damaged during shipping differed with container type (P = 0.0002). The overall significance of this factor was driven largely by differences in pressed manure (P = 0.0317) and peat pots (P = 0.0153) compared with the plastic control. Both of these biocontainers experienced significant losses in shipping, with the former experiencing damage in 27% of the pots measured and the latter recording damage in 35% of the pots measured. Care should be taken when handling and transporting well-watered peat and pressed manure containers, especially after they have been in production several weeks. As such, these containers may be best suited for shorter rotation crops (B. Hayes, personal communication). Damage rates across flexible pots, such as coir, bioplastic, and straw, were higher than expected compared with the control pot treatment (Table 2). The only containers that outperformed the plastic control in shipping were the paper and wood fiber pots. GREENHOUSE TRIAL—DRIP IRRIGATION. Neither final leaf area (P = 0.2804) nor final shoot dry weight (P = 0.1068) varied significantly by container type. Similarly, aboveground plant volume, a relatively coarse plant growth metric compared with the other two measures, was found to be insignificant (P = 0.6708). As expected, plant volume increased each week (P = 0.0003). However, the interaction between week and pot type was nonsignificant (P = 0.9632). Potting mix pH did differ with container type [P = 0.0515 (marginally significant)], but was insignificant given week (P = 0.0895). There was no significant interaction between these two factors (P = 0.1073). With the exception of the straw containers, which generally had a higher media pH than the plastic control, no clear trends were present in the weekly pH data. Furthermore, while pH was found to be different among containers, the growth data above suggest that any alterations to the rooting environment were not of biological significance for the species 153
RESEARCH REPORTS tested (coleus). EC did vary with week (P = 0.0316), but not among container types (P = 0.2284). The findings from this greenhouse experiment contrast somewhat with published work. Evans and Hensley (2004) found dry shoot weight in plastic containers was generally greater than similar measures for peat- and featherbased pots in a variety of species. Our findings suggest that the biocontainers tested had no impact on coleus growth and development compared with petroleum-based plastic containers. Thus, these biocontainers are suitable replacements for plastic containers from a plant growth perspective for coleus. GREENHOUSE TRIAL—HAND, DRIP, AND EBB-AND-FLOOD IRRIGATION. In analyzing the main effects of container type and irrigation on aboveground dry weight, only the latter was found to be significant (P = 0.033; Table 4). Neither the container type (P = 0.268) nor the interaction between irrigation method and container type was significant (P = 0.072). Post hoc analysis of the dry weight means showed that ebb-and-flood plants were significantly different from dripirrigated (P = 0.025) and hand-watered plants (P = 0.019). These comparisons were made at a Bonferroni-adjusted, a = 0.025 level of Type I experimental error. While the ebb-and-flood irrigated plants outperformed both their drip- and hand-irrigated counterparts, the effect of irrigation level is admittedly confounded with the rate of fertilization (see section on Materials and methods). Fertilization is likely a significant—if not the most significant— contributing factor behind the increased dry shoot weight. As such, it is inappropriate to claim that ebb-and-flood is superior to hand watering and drip irrigation. This said, many meaningful insights can be gleaned from this experiment with regard to container performance within each of the irrigation type. Furthermore, direct comparisons can be made between hand and drip irrigation. When comparing hand to drip irrigation, neither method offered any significant growth advantage for the species tested. Thus, other considerations such as cost, water consumption, and grower preference should take precedence over concerns of plant performance when choosing either of these two systems for biocontainer-based 154
greenhouse production of coleus. Within any given irrigation method, plant growth (i.e., dry weight) in biocontainers was no different from growth in the conventional plastic control. These results offer further evidence that, from a plant growth perspective, biocontainers can be suitable substitutes for plastic pots. Beyond growth, we did not observe any noticeable deviations in plant coloration or fullness. As such, growers can put more emphasis on considerations like container
price and appeal when working to make an informed decision on the costs and benefits of biocontainer adoption. Potting mix pH was significantly impacted by container type (P = 0.0009), irrigation method (P = 0.0364), and week (P = 0.0160). However, none of the interactions among these fixed effects were found to be significant. EC did not vary significantly by irrigation method (P = 0.5158), container-type (P = 0.4983), or week (P = 0.5930).
Fig. 2. Comparison of (top) 6-inch (15.2 cm) and (bottom) 8-inch (20.3 cm) spacer bars. Incurved tines on the 6-inch bar made it difficult to achieve clean release of the pressed manure and wood fiber biocontainers after lifting. Table 4. Mean dry shoot weight for ‘Florida Sun Jade’ coleus plants harvested 7 weeks after planting. Plants in each of eight container types (one control and seven biocontainer alternatives) were watered using one of three irrigation methods (i.e., ebb-and-flood, drip, and hand). Avg dry shoot wt [mean ± SE (g)]z Irrigation method Container type Control Bioplastic Coir Pressed manure Paper Peat Straw Wood fiber Avg over container typey
Ebb-and-flood 17.6 ± 6.4 18.7 ± 4.3 15.5 ± 5.7 19.0 ± 5.2 12.6 ± 4.0 13.0 ± 3.9 12.5 ± 4.1 17.2 ± 6.9 15.7 a ± 5.7
Drip
Avg over method
Hand
8.0 ± 2.9 8.4 ± 2.6 10.3 ± 4.0 8.8 ± 3.0 7.8 ± 2.4 8.2 ± 2.4 6.7 ± 2.4 7.3 ± 2.8 6.5 ± 2.9 6.9 ± 2.8 6.2 ± 2.9 3.9 ± 2.7 7.2 ± 2.4 6.3 ± 1.7 10.7 ± 4.2 8.2 ± 3.8 7.91 b ± 3.4 7.3 b ± 3.1
11.3 az ± 6.1 12.5 a ± 5.8 10.5 a ± 5.2 10.9 a ± 6.7 8.7 a ± 4.3 7.7 a ± 5.0 8.6 a ± 4.0 12.1 a ± 6.4 —
z
1 g = 0.0353 oz. Nonsignificant differences for combined values (at an a = 0.05 level of Type I error) are denoted with the same letter.
y
•
April 2013 23(2)
The rise in substrate pH in the ebb-and-flood plants is likely linked to the additional fertilization received before leachate collection. Furthermore, fertilization likely masked any container influence for this irrigation level. In this trial, measures of pH were consistently lower in the manurebased containers and higher for straw containers compared with the plastic control. Despite the statistical significance of these differences, it appears that the changes in soil chemistry did not significantly impact coleus growth as quantified with dry shoot weight. CONTAINER STRENGTH TESTING—HAND, DRIP, AND EBB-ANDFLOOD IRRIGATION. For crush load, the main effects of container type, irrigation method, and the container type · irrigation method interaction were all significant with probability values