Complementarities of trade advantage and trade competitiveness measures
ŠTEFAN BOJNEC*, IMRE FERTŐ‡ Faculty of Management, University of Primorska, Cankarjeva 5, SI-6000 Koper, Slovenia; ‡ Institute of Economics, Hungarian Academy of Sciences. H-1112 Budapest, Hungary
Abstract The complementarities of trade advantage and trade competitiveness measures for agro-food trade of five Central European (CE-5) countries with the European Union are analyzed. The stability and duration of the trade measures over time is investigated by the survival analysis using the nonparametric Kaplan-Meier product limit estimator and the consistency test between the trade measures is conducted by the stratified Cox proportional hazard model. The CE-5 countries experienced greater number of products with relative trade disadvantages and greater significance of one-way imports. Unlike the Czech Republic, Poland, Slovakia and Slovenia, Hungary experienced relative trade advantages for bulk raw commodities, processed intermediates, and horticulture, with the greatest significance of successful quality competition and one-way exports, and the lowest significance of unsuccessful price and unsuccessful quality competition. The duration of relative trade advantages is longer than the duration for the successful trade competition categories. Our results confirm that the relative trade advantage is consistent with the one-way export and the successful price and successful quality competition categories in two-way trade on one side, and the relative trade disadvantage with the one-way import and the unsuccessful price and unsuccessful quality competition on the other.
*
Corresponding author. E-mail:
[email protected]
Complementarities of trade advantage and trade competitiveness measures
I. INTRODUCTION Different concepts and techniques of analysis have been applied measuring the effects of globalization, liberalization and economic integration. Devadoss and Aguiar (2006) analysed the impacts of globalization and trade liberalization on increase in trade and welfare gains on world producers and consumers. Andersen and Herbertsson (2005) rank countries international integration by index of globalization that is constructed from indicators of economic integration employing multivariate technique of factor analysis. Braddorn and Hartley (2007) employed a set of statistical and firm efficiency indicators to measure competitiveness at industry and firm level. Minondo (2007) found variations and large differentials in the border barrier in bilateral trade flows between European Union (EU) countries. Trade measures traditionally have been in a core of measuring of comparative advantages and competitiveness of nations, industries and product specializations. During the last half of the century applied trade literature has developed three main concepts for measuring comparative advantages, trade specialization, and trade competitiveness: relative comparative trade advantage measures (e.g., Liesner, 1958; Balassa, 1965; Vollrath, 1991; Hinloopen and van Marrewijk, 2006), intra-industry trade indices (e.g., Grubel and Lloyd, 1975; Greenaway et al., 1994, 1995; Fontagné et al., 1997), and categories of price and quality competition in two-way trade and non-price competition in one-way trade (e.g., Aiginger, 1997, 1998; Gehlhar and Pick, 2002; Bojnec and Fertő, 2007a and 2007b). So far little attention and limited research is available to bridge these strands in applied literature. This motivated our research to classify trade types, complementarities and consistency between measures of
2
relative comparative trade advantages, intra-industry trade indices, and trade competitiveness categories in the case of agro-food trade. It is known from the literature that measures of relative comparative trade advantages and intra-industry trade are more clearly defined than measures of competitiveness both theoretically and empirically (e.g. Porter, 1990; Krugman, 1994; Kennedy et al., 1997). The theory of relative comparative trade advantages predicts that trade flows exist as a result of relative cost differences between trading partners. It suggests that countries are relatively competitive in goods and services in which they have a relative cost advantage. The relative comparative trade advantage captures structural features of the sector and economy, which are more stable in long-run. The only difference between relative comparative trade advantage and competitiveness measures is that the latter includes also market distortions. Barkema et al. (1991) emphasized the role of distortion in agricultural markets and thus asserted that competitiveness takes a more realistic view about the world. The competitiveness is changing in short-run under impacts of different sector-specific, macroeconomic and other influences that can be related to market and policy distortions with associated transfers such as from the use of agricultural subsidies. Lafay (1992) explains two significant differences between relative comparative trade advantage and trade competitiveness. Firstly, competitiveness usually involves a cross-country comparison for a particular product, whilst comparative advantage is measured between products within a country. Secondly, competitiveness is subject to changes in macroeconomic variables, whereas comparative advantage is structural in nature. Thus empirical analyses that focus on relative comparative trade advantage and trade competitiveness measures may lead different results as a reason for inconsistencies and dissimilarities in results and findings (e.g. Fertő and Hubbard, 2003). However, comparative advantage and competitiveness measures share all interdependencies and dynamic aspects of an economy. According to Aiginger (1998) their might be some significant complementarities
3
and consistencies in measures of relative comparative trade advantage and trade competitiveness. The main novelty of this paper is in a clear differentiation and bridging the gap between price and quality competition in two-way trade and non-price competition in one-way trade combining the knowledge from trade competitiveness (Aiginger, 1997, 1998; Gehlhar and Pick, 2002) and intra-industry trade literature (Greenaway et al., 1994 and 1995; Fontagné et al., 1997). The gap in applied trade literature is established with investigating complementarities and consistencies between relative comparative trade advantages measures, categories of price and quality competition in two-way matched trade flows, and categories of non-price competition in one-way trade flows. The stability of the analyzed trade measures is tested by the survival analysis using the nonparametric Kaplan-Meier product limit estimator and the consistency of the analyzed trade measures is tested by the stratified Cox proportional hazard model. As empirical applied analysis examples are employed data on agro-food trade between five new European Union (EU) member countries from Central Europe (CE-5) (the Czech Republic, Hungary, Poland, Slovakia, and Slovenia) and the old EU-15 member countries. The paper investigates relative comparative trade advantages and categories of competition in trade, magnitude and dynamics of relative comparative trade advantages and different trade competition categories, their dynamics, causalities and consistencies. The rest of the paper is structured as follows. In the next section we explain methodology and data used. After then we present the empirical results of the nature of relative comparative trade advantages, price and quality competition in two-way trade, and non-price competition in one-way trade. We describe the evolving pattern in magnitude, structures, and dynamics of agro-food trade of the CE-5 with the EU-15 employing recently developed empirical procedures based on the modified relative comparative trade advantage index proposed by Vollrath (1991). We separate the one-way trade from the two-way price competition and
4
quality competition trade categories adopting Gehlhar and Pick (2002) to investigate successful price and successful quality competition categories in the matched two-way trade flows. Then we check the consistency and similarity between relative comparative trade advantage and trade competitiveness measures. The final section concludes.
II. METHODOLOGY AND DATA USED The relative comparative trade advantage and trade competitiveness are the main methodological approaches that are applied in this paper. The ability to compete in international and domestic markets depends on price competition and/or product quality in two-way matched trade or on some other non-price competition factors that are important for one-way trade. The simultaneous use of export-to-import unit value and trade balance allows us to investigate the price and quality competition in two-way matched trade. In addition, we analyze one-way trade. We aim to establish causalities and complementarities of measures of relative comparative trade advantages and trade competitiveness. The concept of ‘revealed’ comparative export advantage was introduced by Liesner (1958), but redefined and popularized by Balassa (1965) and therefore known as the ‘Balassa index’ that is widely used empirically to identify a country’s weak and strong export sectors. Porter (1990) uses it to identify strong sectoral clusters, Amiti (1998) analyses specialization patterns in Europe, Proudman and Redding (2000) and Redding (2002) focus on the dynamics of comparative advantage, Bojnec (2001) analyses agricultural trade, Hinloopen and Van Marrewijk (2001, 2004) study the dynamics of the empirical distribution of European and Chinese trade, and Fertő and Hubbard (2003) analyze comparative advantage and trade competitiveness in Hungarian agro-food sectors. The Revealed Comparative Export Advantage (RXA) index is defined by Balassa (1965) as follows: RXA = (Xij / Xit) / (Xnj / Xnt)
5
where X represents exports, i is a country, j is a commodity, t is a set of commodities, and n is a set of countries. RXA is based on observed trade patterns. It measures a country’s exports of a commodity relative to its total exports and to the corresponding export performance of a set of countries, e.g., the EU-15. If RXA > 1, then a comparative export advantage is revealed. Vollrath (1991) offered an alternative specification of revealed comparative advantage, called by the relative trade advantage (RTA), which accounts for exports as well as imports. It is calculated as the difference between relative export advantage (RXA) and its counterpart, relative import penetration advantage (RMA): RTA = RXA – RMA where, RMA = (Mij / Mit) / (Mnj / Mnt) where M represents imports. Thus, RTA = [(Xij / Xit) / (Xnj / Xnt)] – [(Mij / Mit) / (Mnj / Mnt)] If RTA > 0, then a relative comparative trade advantage is revealed, i.e. a sector in which the country is relatively more competitive in terms of its trade. Similarly as the RXA index, the RTA index is based also on observed trade patterns. It measures a country’s exports and imports of a commodity relative to its total merchandise exports and imports, respectively, to the corresponding export and import performance of a set of countries (EU-15), which are used as the benchmark of comparison. We classify RTA index in three categories: RTA < 0 refers to all those product groups with a relative comparative trade disadvantage. RTA = 0 refers to all those product groups in a break even point without relative comparative trade advantage or relative comparative trade disadvantage. RTA > 0 refers to all those product groups with a relative comparative trade advantage. These boundaries are consistent with theoretical interpretation appropriate for cross-country comparisons.
6
To establish comparisons of the relative comparative trade advantage measures with trade competitiveness measures, we also employ the methodological approach that distinguishes between price and quality competition in the matched two-way trade from non-price competition in the one-way trade. Unit values of exports and imports by products have been used for assessing price competition and product quality in two-way matched trade (e.g. Abdel-Rahman, 1991; Aiginger, 1997 and 1998). Aiginger (1997, 1998), Gehlhar and Pick (2002) and Bojnec and Fertő (2007a; 2007b) employ the unit value difference and the trade balance by a product to categorize trade flows in four categories: Category 1. TB( i , j ) > 0 (or X ( i , j ) > M ( i , j ) ) and UVD( i , j ) < 0 (or UV(ix, j ) < UV(mi , j ) ) Category 2. TB( i , j ) < 0 (or X ( i , j ) < M ( i , j ) ) and UVD( i , j ) > 0 (or UV(ix, j ) > UV(mi , j ) ) Category 3. TB( i , j ) > 0 (or X ( i , j ) > M ( i , j ) ) and UVD( i , j ) > 0 (or UV(ix, j ) > UV(mi , j ) ) Category 4. TB( i , j ) < 0 (or X ( i , j ) < M ( i , j ) ) and UVD( i , j ) < 0 (or UV(ix, j ) < UV(mi , j ) ) where the trade balance ( TB( i , j ) ) is calculated as TB( i , j ) = X ( i , j ) - M ( i , j ) where X ( i , j ) is the value of the i-th product exports from a home (domestic) country (CE-5, respectively) to the jth partner country (EU-15) and M ( i , j ) is the value of the i-th product imports to the home country from the j-th partner country. In other words, one country’s exports are another country’s imports, and vice versa. The unit value difference ( UVD( i , j ) ) is calculated as
UVD( i , j ) = UV(ix, j ) - UV(mi , j ) where UV(ix, j ) is the export unit value, which is calculated as UV(ix, j ) = X ( i , j ) / Q(xi , j ) and UV(mi , j ) is the import unit value, which is calculated as UV(mi , j ) = M ( i , j ) / Q(mi , j ) . In these calculations, Q(xi , j ) and Q(mi , j ) are quantities of exports and imports, respectively, between the home country i and the partner country j. Trade balances indicate successful or unsuccessful competition in trade and export-import unit values determine price or quality competition. The four price and quality competition categories approach is applied
7
on the matched two-way trade flows satisfying the simultaneous conditions of the unit value difference and the trade balance by the product. In the matched two-way trade flows in the first and third categories the home country i is successful in price and quality competition, respectively, and vice versa in the second and fourth categories where the home country is unsuccessful in price and quality competition. We disentangle the one-way trade from the two-way matched trade. When the one-way trade occurs then the net direction of trade is either surplus or deficit. Therefore, for the one-
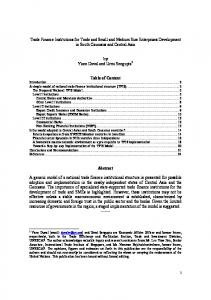
way trade we distinguish the two possible one-way non-price competition categories, i.e. only one-way export category or only one-way import category, that occur when holds the following conditions (Bojnec and Fertő, 2007a; 2007b): Only export category: TB( i , j ) >0 (or X ( i , j ) >0, M ( i , j ) =0) and UV(mi , j ) =0 Only import category: TB( i , j ) 0 Categories 1 and 3, and one-way export Category 1 Category 3 One-way export Hungary RTA > 0 Categories 1 and 3, and one-way export Category 1 Category 3 One-way export Poland RTA > 0 Categories 1 and 3, and one-way export Category 1 Category 3 One-way export Slovakia RTA > 0 Categories 1 and 3, and one-way export Category 1 Category 3 One-way export Slovenia RTA > 0 Categories 1 and 3, and one-way export Category 1 Category 3 One-way export
5 year
9 year
bulk raw commodities
Product groups (9 year) processed consumer-ready intermediates food
horticulture
0.92
0.58
0.07
0.19
0.07
0.04
0.05
0.91 0.91 0.89 0.89
0.55 0.52 0.46 0.44
0.05 0.03 0.01 0.00
0.17 0.12 0.01 0.00
0.04 0.02 0.01 0.00
0.03 0.02 0.01 0.00
0.02 0.01 0.00 0.00
0.94
0.65
0.12
0.29
0.12
0.09
0.07
0.93 0.91 0.90 0.89
0.63 0.56 0.49 0.45
0.12 0.05 0.02 0.00
0.23 0.16 0.01 0.00
0.11 0.04 0.02 0.00
0.12 0.04 0.03 0.00
0.04 0.02 0.02 0.00
0.93
0.61
0.10
0.17
0.06
0.12
0.08
0.92 0.90 0.90 0.89
0.57 0.51 0.49 0.45
0.08 0.03 0.01 0.001
0.11 0.09 0.00 0.00
0.03 0.01 0.01 0.00
0.12 0.04 0.03 0.001
0.04 0.02 0.00 0.00
0.92
0.56
0.06
0.22
0.06
0.02
0.04
0.91 0.90 0.89 0.89
0.55 0.52 0.45 0.45
0.05 0.03 0.00 0.00
0.20 0.14 0.00 0.00
0.04 0.02 0.00 0.00
0.03 0.02 0.00 0.00
0.01 0.01 0.00 0.00
0.91
0.54
0.03
0.07
0.03
0.02
0.01
0.90 0.89 0.89 0.88
0.50 0.47 0.46 0.44
0.01 0.01 0.00 0.00
0.03 0.03 0.00 0.00
0.01 0.00 0.00 0.00
0.02 0.01 0.00 0.00
0.00 0.00 0.00 0.00
Source: Authors’ calculations based on OECD dataset.
Consistency between comparative advantage and trade competitiveness
12
We want to establish complementarities and consistencies between the measures of relative comparative trade advantages, categories of price and quality competition in two-way matched trade, and categories of non-price competition in one-way trade. We first present the mean value of the RTA > 0 and RTA < 0 by trade competition categories (Table 4). The negative RTA’s values are (absolutely) the largest for one-way import, the unsuccessful price competition (category 2) and unsuccessful quality competition (category 4). On the other hand, the positive RTA’s values are the largest for one-way export, the successful price competition (category 1) and successful quality competition (category 3). These results reveal the consistency between the relative comparative trade advantage and the successful price and successful quality competition and one-way exports on one side, and between the relative comparative trade disadvantage and the unsuccessful price and unsuccessful quality competition and one-way imports on the other.
Table 4. Mean of relative trade advantage (RTA) by trade competition categories
Czech Republic RTA < 0 RTA > 0 Hungary RTA < 0 RTA > 0 Poland RTA < 0 RTA > 0 Slovakia RTA < 0 RTA > 0 Slovenia RTA < 0 RTA > 0
Category 1
Category 2
Category 3
Category 4
One-way export
-2.01 7.95
-21.71 0.30
-1.16 8.44
-5.15 0.73
29.65
-1.874 30.432
-4.76 0.27
-4.17 14.03
-4.04 0.30
42.209
-1.139 17.764
-38.30 0.74
-1.03 13.02
-9.54 0.81
175.907
-0.414 9.785
-5.01 0.41
-0.29 2.58
-7.68 0.67
23.035
-2.392 7.857
-12.43 0.67
-0.89 4.47
-13.21 0.89
1.207
One-way import -40.88
-21.41
-34.36
-18.48
-53.43
Source: Authors’ calculations based on OECD dataset.
13
The Cox proportional hazard estimates using the trade competition categories and product groups as a dependent variable are presented in Table 5. Dummy variables for the trade competition categories are defined as one for the successful competition categories and zero otherwise. We present the results as hazard rates. An estimated hazard rate coefficient less than (greater than or equal to) one is interpreted that the variable lowers (increases or has no impact on) hazard rate. The empirical results confirm our expectations that being a competitive product this decreases significantly the hazard rate of the relative comparative trade advantage for the trade competition categories. The hazard rate is found to be lower for trade competition in general than for successful price or non successful price competition, respectively. The lowest hazard rate can be observed for one-way export.
Table 5. Cox proportional hazard estimates for competition categories and product groups Competition groups one-way bulk raw Category 1 Category 3 export commodities 0.16 0.17 0.23 0.00 1.52 0.000 0.000 0.000 0.000 0.000 0.15 0.16 0.26 0.00 1.57 0.000 0.000 0.000 0.000 0.000 0.10 0.08 0.20 0.00 1.26 0.000 0.000 0.000 0.000 0.004 0.13 0.14 0.19 0.00 1.67 0.000 0.000 0.000 0.000 0.000 Total
Czech Republic p-value Hungary p-value Poland p-value Slovakia p-value Slovenia p-value
0.11 0.000
0.18 0.000
0.01 0.000
0.00 0.000
1.16 0.039
Product groups processed consumerintermediates ready food 0.79 1.020 0.000 0.698 1.01 0.811 0.86 0.017 1.12 0.085 1.06 0.268
0.82 0.004 1.03 0.529 0.75 0.000 0.90 0.074
horticulture 0.92 0.418 0.83 0.076 0.89 0.281 0.83 0.061 0.87 0.148
Source: Authors’ calculations based on OECD dataset.
The hazard rates show a mixed result by product groups by the degree of processing. Bulk raw commodities increase the hazard rate significantly for the each of the analyzed countries, while consumer-ready foods, except for Poland, lower the hazard rate. The processed intermediates decrease the hazard rate for Poland, whilst they rise for Slovakia. Horticultural products have significantly effects on decrease the hazard rates for Hungary and Slovakia.
14
IV. CONCLUSIONS The relative comparative trade advantage, price and quality competition in two-way trade, and non-price competition in one-way agro-food trade for the CE-5 countries on the EU-15 markets have been analyzed. The complementarities and consistencies in measures of relative comparative trade advantages and trade competition are clearly confirmed. In our example of agro-food trade between the CE-5 countries and the EU-15 we have found that the CE-5 countries experience greater number of products with relative comparative trade disadvantages and much greater significance of one-way imports. The duration rate to stay with the relative comparative trade advantage is a bit longer than the duration rate to stay the successful price competition category 1 or successful quality competition category 3 or oneway export. This confirms that the relative comparative trade advantage measure captures more stable long-run structural features of the sector and economy than trade competition categories. However, the CE-5 countries as a group are not a homogenous one. Hungary differs from the other CE-4 countries with relative comparative trade advantages for several agro-food products, particularly for bulk raw commodities, processed intermediates, and horticulture, with the greatest significance of successful quality competition category 3 and one-way exports, and the lowest significance of unsuccessful price and unsuccessful quality competition categories 2 and 4, respectively. Finally, our results confirm that irrespective that measures of relative comparative trade advantages and trade competition categories are not the same measure, there is a greater consistency between relative comparative trade advantage and trade competition categories when trade competition categories are decomposed at highly disaggregated trade data. In our specific analyzed case the comparison of measures of relative comparative trade advantages and trade competition and the estimated hazard rates confirm that the relative comparative trade advantage measure is consistent with the one-way export, the successful price and successful quality competition categories 1 and 3, respectively, in
15
two-way trade on one side, and the relative comparative trade disadvantage with the one-way import, the unsuccessful price and unsuccessful quality competition categories 2 and 4, respectively, on the other.
ACKNOWLEDGEMENTS The authors thank the financial support from the bilateral project between the Hungarian and Slovenian Academies of Sciences entitled 'Agro-Food Trade between Central-European Countries and the European Union.' Imre Fertő gratefully acknowledges financial support from the Hungarian Scientific Research Fund No. 37868 ‘The International Agricultural Trade: Theory and Practice’.
REFERENCES Abd-el-Rahman, K. (1991) Firms’ competitive and national comparative advantages as joint determinants of trade composition, Weltwirtschaftliches Archiv, 127, 83-97. Aiginger, K. (1997) The use of unit values to discriminate between price and quality competition, Cambridge Journal of Economics, 21, 571-592. Aiginger, K. (1998) A framework for evaluating the dynamic competitiveness of countries,
Structural Change and Economic Dynamics, 9, 159-188. Amiti, M. (1998) New trade theories and industrial location in the EU, Oxford Review of
Economic Policy, 14, 45-53. Andersen, T.M. and Herbertsson, T.T. (2005) Quantifying globalization, Applied Economics, 37, 1089-1098. Balassa, B. (1965) Trade liberalization and revealed comparative advantage, The Manchester
School of Economic and Social Studies, 33, 99-123. Barkema, A., Drabenstott, M. and Tweeten, L. (1991) The competitiveness of U.S. agriculture in the 1990s in agricultural policies, in The 1990s in Agricultural Policies in the New
Decade, Resources for the Future, (Ed.) K. Allen, National Planning Association, Washington, D.C. Bojnec, Š. (2001) Trade and revealed comparative advantage measures: regional and Central European agricultural trade, Eastern European Economics, 39, 72-98. 16
Bojnec, Š. and Fertő, I. (2007a) Catching-up process of European enlargement: Hungarian and Slovenian agricultural, food and forestry trade. Eastern European Economics, 45, forthcoming. Bojnec, Š. and Fertő, I. (2007b) Hungarian and Slovenian agro-food trade with three main European Union partners, Ekonomický Časopis – Journal of Economics, 55, 345-358. Braddorn, D., and Hartley, K. (2007) The competitiveness of the UK aerospace industry,
Applied Economics, 39, 715-726. Chen, K., Xu, L. and Duan, Y. (2000) Ex-post competitiveness of China's export in agri-food products: 1980-1996, Agribusiness, 16, 281-294. Devadoss, S. and Aguiar, A.H. (2006) Effects of global trade liberalization on softwood lumber markets’, Applied Economics, 38, 2351-2360. EU-Commission (1999) The Agricultural Situation in the European Community, 1998 Report, Brussels. Fertő, I., and Hubbard, L.J. (2003) Revealed comparative advantage and competitiveness in Hungarian agri–food sectors, The World Economy, 26, 247–259. Fontagné, L., Freundenberg, M. and Peridy, N. (1997) Trade Patterns in the Single Market, CEPII, Working paper No 97-07, Paris. Gehlhar, M.J. and Pick, D.H. (2002) Food trade balances and unit values: what can they reveal about price competition?, Agribusiness, 18, 61-79. Greenaway, D., Hine, R.C. and Milner, C.R. (1994) Country-specific factors and the pattern of horizontal and vertical intra-industry trade in the UK, Weltwirtschaftliches Archiv, 130, 77-100. Greenaway, D., Hine, R.C. and Milner, C.R. (1995) Vertical and horizontal intra-industry trade: A cross-industry analysis for the United Kingdom, Economic Journal, 105, 15051518. Grubel, H.G., and Lloyd, P.J. (1975) Intra-Industry Trade: The Theory and Measurement of
International Trade in Differentiated Products, MacMillan, London. Hinloopen, J. and van Marrewijk, C. (2001) On the empirical distribution of the Balassa index, Weltwirtschaftliches Archiv, 137, 1-35. Hinloopen, J. and van Marrewijk, C. (2004) Dynamics of Chinese Comparative Advantage, Tinbergen Institute Working Paper, 2004-034/2, Amsterdam. Hinloopen, J. and van Marrewijk, C. (2006) Comparative Advantage, the Rank-size Rule, and
Zipf’s Law, Tinbergen Institute Discussion Paper, TI 2006-100/1, Amsterdam. Jenkins, S.P. (2005) Survival Analysis, Institute for Social and Economic Research, 17
University of Essex, Colchester. Kennedy, P.L., Harrison, R.W., Kalaitzandonakes, N.G., Peterson, H.C. and Rindfuss, R.P. (1997)
Perspectives
on
evaluating
competitiveness
in
agribusiness
industries,
Agribusiness, 13, 385-392. Krugman, P. (1994) Competitiveness: a dangerous obsession, Foreign Affairs, 73, 28-44. Lafay, G. (1992) The measurement of revealed comparative advantages, in International
Trade Modelling (Eds.) M.G. Dagenais and P-A. Plunet, Chapman & Hall, London, pp. 209-236. Liesner, H.H. (1958) The European Common Market and British industry, Economic Journal, 68, 302-316. Minondo, A. (2007) The disappearance of the border barrier in some European Union countries' bilateral trade, Applied Economics, 39, 119-124. Porter, M. (1990) The Competitive Advantage of Nations, MacMillan, London. Proudman, J. and Redding, S. (2000) Evolving patterns of international trade, Review of
International Economics, 8, 373-396. Redding, S. (2002) Specialization Dynamics, Journal of International Economics, 58, 299334. Vollrath, T.L. (1991) A theoretical evaluation of alternative trade intensity measures of revealed comparative advantage, Weltwirtschaftliches Archiv, 130, 263-279.
18