is fabricated using a Rogers RT/duroid 5880 substrate with thickness h=3.175 mm. The lateral walls are created by me- tallic posts and the structure is excited by ...
REVIEW OF SCIENTIFIC INSTRUMENTS 81, 064704 共2010兲
Complex permittivity measurements using cavity perturbation technique with substrate integrated waveguide cavities Humberto Lobato-Morales, Alonso Corona-Chávez, D. V. B. Murthy, and José L. Olvera-Cervantes National Institute for Astrophysics, Optics, and Electronics, Luis E. Erro No. 1, Tonanzintla, Puebla 72000, Mexico
共Received 5 November 2009; accepted 11 May 2010; published online 11 June 2010兲 Cavity perturbation technique is widely used in the measurements of complex dielectric permittivity of materials due to its accuracy and ease of configuration. This paper presents the theoretical formulas for the evaluation of complex permittivity of materials using cavity perturbation technique with substrate integrated cavity resonators. With the proposed formulas, the use of various planar cavities is possible by taking into account the dielectric characteristics of the substrate in which the cavity is implemented. Simulations and measurements are performed on various dielectric samples to validate the proposed theory. The maximum deviation in the measured dielectric permittivity values is below 6% compared to the literature values. The implemented substrate integrated cavity is then analyzed in terms of sensitivity, showing a good performance. © 2010 American Institute of Physics. 关doi:10.1063/1.3442512兴
I. INTRODUCTION
Complex permittivity 共 = ⬘ − j⬙兲 measurement of materials plays a very important role in several industrial, scientific, and medical applications.1–4 Resonant structures 共coaxial, dielectric, and cavity resonators兲 are most commonly used to characterize materials at microwave frequencies.1,2 Microwave cavities are popular because they present the advantage of high Q factors and good sensitivity.1,2 In cavity perturbation technique 共CPT兲 for complex permittivity measurements, the sample under test is located at a position of maximum electric field E, and it creates a small perturbation that is reflected in variations in the resonant response of the device. The changes in resonance frequency f s and quality factor Qs are related to the properties of the sample through CPT. This characterization method has been widely used due to its accuracy and good sensitivity, and has been exploited by several authors.1–4 Recently, with the development of substrate integrated waveguide 共SIW兲 technology, which is realized from the planar substrate, it is possible to design SIW cavities with the advantages of high Q factor, low profile, and low cost.5 SIW cavities can be employed for material dielectric characterization using CPT. Saeed et al.4 performed complex dielectric permittivity measurements of liquids using a SIW cavity designed with RT/duroid 5880 substrate 共r = 2.2 and tan ␦ = 0.0009兲. The authors4 used conventional expressions of CPT to characterize the binary mixtures of isobutanol and isopropanol, and the results were compared with theoretical data. Conventional formulas of CPT are linear approximations that fit well in a considerable range of sample permittivity values, and are derived assuming that the cavity is air filled.2 In Ref. 4, the dielectric properties of the SIW cavity 共different from that of air兲 were not considered in the characterization analysis. This paper presents the derivation of formulas that can 0034-6748/2010/81共6兲/064704/4/$30.00
be used for CPT with SIW cavities, where the substrates have different permittivity values, and consequently, wider design flexibility in material characterization can be obtained with accurate results. Simulations and measurements are performed to support the theoretical expressions. This paper is organized as follows. Section II presents the theoretical derivation of CPT for SIW formulas. Section III shows the design and simulation of SIW cavities with various sample permittivity values to support the theoretical formulas. Section IV presents experimental measurements and characterization of samples, and sensitivity analysis of the implemented SIW cavity.
II. THEORETICAL CPT FOR SIW
The proposed CPT formulas for permittivity characterization using SIW cavities consider the dielectric properties of the medium filling the cavity. The fundamental expression of CPT for complex permittivity measurements using SIW cavities is
冉
冊
2 − 1 2 − 1 兰兰兰VsEⴱ1 · E2dV , =− 1 21 兰兰兰Vc兩E1兩2dV
共1兲
where 1 and 2 are the complex angular resonant frequencies of the cavity before and after perturbation, respectively, 1 is the complex dielectric coefficient of the medium filling the cavity, 2 is the effective complex dielectric coefficient of the medium after the perturbation, and E1 and E2 represent the electric field before and after the sample perturbation, respectively, inside the cavity. Equation 共1兲 is derived assuming that the sample is located at a maximum E-field position, and the perturbation inside the cavity is small.2 As and are complex values, Eq. 共1兲 can be separated in real and imaginary parts, which are related to the material
81, 064704-1
© 2010 American Institute of Physics
064704-2
Rev. Sci. Instrum. 81, 064704 共2010兲
Lobato-Morales et al.
real permittivity coefficient and dielectric losses, respectively.2 The final expressions for the CPT using SIW cavities are
冉 冊 冉 冊冉
s⬘ =
Ar⬘Vc f 0 − f s + r⬘ , Vs fs
s⬙ =
BVc r⬘2 + r⬙2 Vs r⬘
共2兲
冊
⬘ ⬙ Q0 − Qs + s r, Q 0Q s r⬘
共3兲
where s⬘ and s⬙ correspond to real and imaginary permittivities of the sample, respectively, r⬘ is the substrate relative permittivity, and r⬙ is related to the substrate loss tangent2 as r⬙ = r⬘ tan ␦; f 0 and f s are the resonant frequencies before and after the small perturbation, respectively. A and B are related to the cavity configuration, mode of operation of the cavity, and shape and position of the sample inside the cavity.2,4 As it is difficult to obtain A and B analytically, these parameters are obtained experimentally by using standard samples of known dielectric properties.2,4 III. SIMULATIONS FOR CPT ANALYSIS USING SIW CAVITIES A. Design of SIW cavity
The resonant frequency of a rectangular SIW cavity which is operating in TEm0l mode4,5 is given by f0 =
c
2 冑 r r
冑冉 冊 冉 冊 m aeff
2
+
l
deff
2
共4兲
,
where c is the speed of light in a vacuum, r and r are the dielectric permittivity and permeability constants, respectively, m and l are related to the operating mode, and aeff and deff are the effective width and effective length of the cavity, respectively. As the SIW cavity can be closed by metallic posts,5 aeff and deff are given by aeff = a −
D2 0.95b
and
deff = d −
D2 , 0.95b
共5兲
where a and d are the overall width and length dimensions of the cavity, D is the metallic post diameter, and b is the separation between the center of adjacent posts. For a good performance of the lateral post walls, the following design rules5 are adopted: D ⬍ g / 5 and b ⱕ 2D, where g is a guided wavelength in the medium filling the cavity.
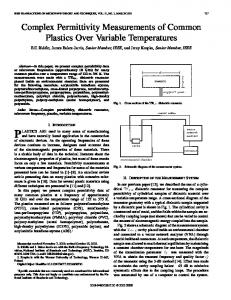
FIG. 1. Layout of the SIW cavity 1.
ity 2 is designed using a RT/duroid 6006 substrate 共r⬘ = 6.15, tan ␦ = 0.0019, and thickness h = 2.5 mm兲, and cavity 3 is designed with a RT/duroid 6010.2LM substrate 共r⬘ = 10.2, tan ␦ = 0.0023, and h = 1.9 mm兲. The sample under test consists of a 2 mm diameter cylinder placed at an E-field maximum position, as shown in Fig. 2. Complex permittivity characterization based on simulations consists of two parts. In the first part, s⬘ characterization is carried out by having no dielectric losses in the sample 共s⬙ = 0兲. In the second part, s⬙ characterization is performed by keeping the parameter s⬘ constant which is equal to 1. Samples of different complex dielectric permittivity values ranging from s⬘ = 1 to 25 and s⬙ = 0 to 0.1 have been chosen for characterization. Resonant frequencies and Q factors for all the samples are obtained. The complex values of the samples are estimated by using the proposed formulas of CPT for SIW 关Eqs. 共2兲 and 共3兲兴. The parameters A and B are obtained by calibration with the introduced standard permittivity quantities a⬘ and tan ␦a. This procedure is followed for all the cavities. Table I tabulates the values of s obtained from the simulations using the proposed formulas of CPT for SIW; the corresponding values of A and B for each characterization are also shown. In Table I, a⬘ and tan ␦a are the introduced values in the simulations, while s⬘ and tan ␦ are referred to the characterized values from the proposed CPT for SIW formulas. From Table I, it can be seen that CPT for SIW gives accurate results. The errors of s⬘ values using CPT for SIW are 3.4%, 1.8%, and 2.7% for cavities 1, 2, and 3, respectively, while for sample tan ␦ quantities the errors are 1.6%, 5.9%, and 2.5%, respectively.
B. CPT analysis for SIW cavities „simulations…
In order to validate the theory, three cavities with different dielectric substrates are designed at 7 GHz with a TE103 resonant mode. Cavity 1 is designed using a RT/duroid 5880 substrate6 with r = 2.2, tan ␦ = 0.0009, and thickness h = 3.175 mm, based on the SIW design criteria. Figure 1 shows the layout of the designed resonant cavity. The dimensions of the cavity are a = 21 mm and d = 63 mm; the metallic posts have D = 1 mm and b = 2 mm. The cavity is excited at one of the E-field maximum position. A coaxial probe is used for the excitation. The cavity is analyzed using a fullwave electromagnetic 共EM兲 simulator.7 The simulated values are f 0 = 7.1884 GHz and Q0 = 392.81, which correspond to the parameters before perturbation of the cavity in CPT. Cav-
FIG. 2. 共Color online兲 E-field distribution of the SIW cavity and allocation of the sample.
064704-3
Rev. Sci. Instrum. 81, 064704 共2010兲
Lobato-Morales et al.
TABLE I. Characterized s values from simulations using CPT for SIW. s⬘ ⬘a 1 7 13 19 25
Cavity 1 A = 0.491 B = 0.291
Cavity 2 A = 0.589 B = 0.315
Cavity 3 A = 0.64 B = 0.289
1.115 7.008 13.375 19.442 25.047
1.002 7.123 13.612 19.284 24.824
1.652 7.309 13.025 19.083 25.357
tan ␦a 0 0.02 0.04 0.06 0.08 0.1
tan ␦ ⫺0.001 0.02 0.04 0.06 0.079 0.104
0.001 0.016 0.04 0.058 0.084 0.101
0 0.021 0.04 0.062 0.08 0.095
FIG. 3. Experimental response of the cavity with various materials.
IV. EXPERIMENTAL MEASUREMENTS A. Fabrication of the cavity
To validate the proposed theory and simulations, cavity 1 is fabricated using a Rogers RT/duroid 5880 substrate with thickness h = 3.175 mm. The lateral walls are created by metallic posts and the structure is excited by means of a coaxial probe at the center of the structure 共maximum E field兲. The cavity is tested using an Agilent-PNA series vector network analyzer 共VNA兲 共E8361A兲. Measured values of resonant frequency and Q factor are 7.17625 GHz and 517.2072, respectively. A 2.4 mm diameter hole, at a position of maximum E field, is chosen for allocation of the sample. B. Characterization of samples
Samples with different permittivity properties are characterized for the resonant frequencies f s and quality factors Qs. The samples are shaped in a cylindrical form 共2.4 mm diameter兲 and are allocated in the hole of the cavity. The samples chosen for characterization are Teflon, acrylic, polyamide, nylon, Rogers RO4003C,6 wood, quartz, Rogers RT/duroid 6010.2LM,6 and Rogers RT/duroid 6010.8LM.6
The samples are introduced in the cavity and their responses are measured using the VNA. Figure 3 shows the measured return losses for the cavity before perturbation, and after perturbation with air, wood, quartz, and RT/duroid 6010.8LM samples. For material characterization, the calibration constants A and B are obtained by using the standard samples of RT/duroid 6010.2LM and 6010.8LM, as their characteristics are well documented.6 It can be observed, from Fig. 3 that samples with higher dielectric permittivity values produce lower resonant frequencies of the SIW cavity. Also it can be noticed that materials with higher losses 共such as wood兲 produce lower Q factors. Table II shows the measured permittivity values s using the proposed CPT for SIW formulas and comparisons are made by using conventional CPT expressions.4 From Table II, it is clear that conventional CPT formulas yield negative results for samples whose s⬘ are lower than that of the substrate. For tan ␦ calculations, using the conventional CPT expression, it generates negative results when the losses of the sample are lower than that of the cavity substrate. It is also noticeable that the calculated s⬘ quantities using conventional CPT formulas only agree for values higher than those of the cavity substrate, while using CPT for SIW the agreement is for the whole linear region. The error for the real permittivity characterization using CPT for SIW
TABLE II. Characterized s values of materials from measurements. tan ␦
s⬘ Sample
Theoretical
Air Teflon Acrylic Polyamide RO4003C Nylon Wood Quartz 6010.2LM 6010.8LM a
Reference 4.
1 2.1 2.7 2.5 3.38 4 3 4.2 10.2 10.8
Proposed CPT for Conventional Proposed CPT for Conventional SIW A = 1.073 CPTa A = 2.98 Theoretical SIW B = 0.027 CPTa B = 0.1 1.0303 1.8509 2.1248 2.2951 2.9637 3.0302 3.1078 4.1986 10.2267 10.7999
⫺1.475 ⫺0.4389 ⫺0.093 0.122 0.9663 0.231 1.1483 2.5256 10.1373 10.8612
0 0.001 0.004 0.0027
0 0.0023 0.0023
0.0015 0.0021 0.0032 0.0024 0.0018 0.0028 0.0217 0.0006 0.0023 0.0023
0.0011 0.002 0.0039 0.0026 0.0015 0.0031 0.0347 ⫺0.0004 0.0023 0.0023
064704-4
Rev. Sci. Instrum. 81, 064704 共2010兲
Lobato-Morales et al.
FIG. 5. Fractional change in resonant frequency vs sample permittivity values.
It is noticeable from Fig. 5 that the fractional change in resonant frequency obtained from simulations is higher than that of experimental measurements. The sensitivity s = dF / ds⬘ from simulations with cavity 1 results of s = 0.2338%, while the experimental sensitivity is of s = 0.1576%. The differences in both the sensitivity values are due to the manufacturing tolerances, sample shape, and position of the sample hole.
V. CONCLUSIONS
FIG. 4. Experimental sensitivity of cavity 1: 共a兲 resonant frequency vs sample dielectric permittivity and 共b兲 3 dB bandwidth vs sample dielectric loss tangent.
is within ⫾6%, while using conventional CPT it results to ⫾46%. C. Sensitivity analysis
It is known2,4 that the shift in resonant frequency increases with the increase in the dielectric constant of material. The experimental variations in resonant frequency versus sample dielectric permittivity and 3 dB bandwidth versus sample dielectric loss tangent are plotted in Fig. 4. It can be observed from Fig. 4 that a change in the sample dielectric permittivity of 0.5 generates a shift of 5.6 MHz in the resonant frequency; also a variation of 5.5 MHz in the 3 dB bandwidth is observed for a change in sample tan ␦ of 0.01, indicating a high sensitivity in the cavity. Figure 5 shows the simulated and experimental fractional change in the resonant frequency F = 共f 0 − f s兲 / f s with the varying dielectric constant of the samples using cavity 1.
The analysis of complex permittivity of materials using CPT for SIW cavity resonator has been presented. With the derivation of CPT formulas for SIW, it is possible to take into account the relative permittivity and the losses of the cavity substrate, while in conventional CPT it is assumed that the cavity is air filled and without losses. Simulations and measurements of different permittivity materials have been performed for the validation of theoretical expressions. Characterization of materials with different permittivity properties using CPT for SIW presented high accuracy for three different permittivity SIW cavities. Sample variations of less than 0.5 and 0.01 in permittivity constant and loss tangent, respectively, can be clearly characterized with the designed SIW cavity. The proposed CPT formulas produce errors of less than 6% using different permittivity SIW cavities. Also, the proposed expressions allow the use of different dielectric permittivity SIW cavities, which provide the advantages of ease of fabrication, lower dimensions, and more flexibility of design and construction in material characterization systems. E. Nyfors, Subsurf. Sens. Tech. Appl. 1, 23 共2000兲. L. F. Chen, C. K. Ong, C. P. Neo, V. V. Varadan, and V. K. Varadan, Microwave Electronics: Measurements and Materials Characterization 共Wiley, New York, 2004兲. 3 V. Subramanian, V. Sivasubramanian, V. R. K. Murthy, and J. Sobhanadri, Rev. Sci. Instrum. 67, 279 共1996兲. 4 K. Saeed, R. D. Polland, and I. C. Hunter, IEEE Trans. Microwave Theory Tech. 56, 2340 共2008兲. 5 K. Wu, D. Deslandes, Y. Cassivi, Proceedings of TELSIKS, 2003, Vol. 1. 6 Rogers Corporation©, High Freq. Laminates. 7 HFSS, ver. 10, Ansoft Corp. 1 2