Vol. 5(10), pp. 278-284, October 2013 DOI: 10.5897/JENE11.010 ISSN 2006-9847 ©2013 Academic Journals http://www.academicjournals.org/JENE
Journal of Ecology and the Natural Environment
Full Length Research Paper
Composition of understory vegetation in tree species of Cholistan desert, Pakistan Muhammad Farrukh Nisar1*, Farrukh Jaleel2, Muhammad Waseem3, Sajil Ismail4 and Muhammad Arfan5 1
College of Bioengineering, Chongqing University, Chongqing 400044, China. College of Chemistry and Chemical Engineering, Chongqing University, Chongqing 400044, China. 3 Department of Biology, Allama Iqbal Open University (AIOU), Islambad (44000), Pakistan. 4 Department of Botany, Govt. Sadiq Egerton (SE) College, Bahawalpur (63100), Pakistan. 5 Department of Biology, Lund University, Sweden.
2
Accepted 18 September, 2013
In the present study the understory vegetation or communities under the canopy of tree species of Cholistan desert (27° 42’ and 29° 45’ North and longitudes 69° 52’ and 75° 24’ East) and the effect of canopy cover on the soil chemistry were studied. Quadrats of 1 m2 were laid to record the different plant species underside the canopy cover of tree species and then frequency, density and plant cover were recorded, whereas relative frequency, relative density, relative cover and IVI for each of the plant species were computed following the standard methods. The study was repeated for three times and field guides were used to identify the plant species. Soil analysis showed that tree species greatly modified the soil chemistry beneath the canopy cover. Stipagrostis plumosa, Salsola baryosma and Cenchrus cilaris were the major plant species that form the understory communities of tree species due to their close association with each other in the Cholistan desert. Other plant species also take part in forming the understory vegetation of tree species but to some less extent as they fail to form any type of association with each other. Key words: Understory, vegetation, Cholistan desert, canopy, quadrat, IVI, soil.
INTRODUCTION The Cholistan desert, a stretch of about 26,000 km 2, situated in the Southern part of the Punjab province, Pakistan. The vegetation is a typical of arid regions and comprises of xerophytic plant species, adapted to extreme seasonal temperature, moisture fluctuation and a wide variety of edaphic conditions (Arshad et al., 2008). Vegetation cover is comparatively better in eastern region (200 mm rainfall zone) than the hyper arid southern region (100 mm rainfall zone) (Nisar et al., 2010). The soil topography and chemical composition is playing an important role in plant distribution in the area. The association of certain plant species to certain soils at different places is very common (Arshad et al., 2008).
It has been recognized that understory biomass increases with an increase in incident solar energy (Zavitkovski, 1976). In fact, the understory layer is affected by a reduction of light, when canopy is closed and stratified and by nutrient availability (Gilliam and Turrill, 1993). The different nutrient requirements of the species in a stand and their relative contributions to the chemistry litter affect soil nutrient availability and other soil properties such as pH and net nitrification (Ste-Marie and Pare, 1999). The relationship between overstory and understory is complex and also dependant on permanent site factors such as surface deposit. It has been demonstrated that canopy type exert its influence on nutrient availability, affects
*Corresponding author. E-mail:
[email protected]. Tel: +92-345-7100555, +86-18875250090.
Nisar et al.
279
Table 1. Soil analysis collected from underside the canopies of tree species of Cholistan desert, Pakistan.
Soil property pH E.C. (ds/m) P (ppm) K (ppm) Ca (meq/L) Mg (meq/L) Na (meq/L) O.M. (%) Texture
Acacia jacquemontii 8.6 1.26 5.5 109.3 0.60 0.27 0.39 0.28 Sandy loam
Prosopis juliflora 8.2 1.62 6.2 123.3 0.98 0.45 0.19 0.34 Sandy loam
understory composition (Legare et al., 2001). Communities in fact are the mirrors of landmass or indicators of land’s biological resources and based upon this information. The plant communities are considered as reliable indicators of environments and economic potentialities of the area (Arshad and Akbar, 2002). The association of certain plant species to certain soils at different places is very common and different plant communities at different soil types have been identified (Arshad et al., 2007, 2008). Arshad (2003) has reported the major parameters that, are responsible for vegetation distribution in Cholistan desert are the salinity and pH. While Rao et al. (1989) are of the view that phytosociological groups are determinant of the soil types as the edaphic factors influence the vegetation more than any other factor. By reviewing the above reports the present study was conducted. The principal objective of this study was to determine the impacts of tree species on composition of understory vegetation and the chemistry of soil under it. MATERIALS AND METHODS The study was conducted in Cholistan desert (27° 42’ and 29° 45’ North and longitudes 69° 52’ and 75° 24’ East) on 10 different sites to determine the understory vegetation composition of five plant species namely Acacia jacquemontii, Prosopis cineraria, Prosopis juliflora, Tamarix aphylla and Acacia nilotica. Quadrat method was used to record understory vegetation (Oosting, 1957; Chul and Moody, 1983). Three quadrats measuring 1 x 1 m 2 were randomly taken from underside of the canopy of each plant species. The study was repeated for three times. The plant species were identified in the field with field guide (Rao et al., 1989). Frequency, density and plant cover were recorded, whereas relative frequency, relative density and relative cover for each of the plant species was computed following the methods described by Hussain (1989). Importance value index (IVI) was calculated by the direct summation of relative frequency, relative density and relative cover of each plant species (Curtis and Mclntosh, 1951; Muller-Dombois and Ellenberg, 1974; Chul and Moody, 1983). The species having the highest IVI were considered as the leading dominant plant species of understory vegetation. Soil samples from underside of each plant were also taken and were transferred to Soil Testing Laboratory, for complete soil assay to judge the effect of plant canopy on the soil enrichment. Chemical analysis conducted included soil pH, organic matter (Walkley-Black method), Phosphorus (Bray-2 method), and exchangeable cations,
Prosopis cineraria 8.3 1.31 4.9 105.6 0.69 0.38 0.23 0.25 Sandy loam
Tamarix aphylla 8.6 4.57 5.03 117.3 1.02 3.09 0.596 0.28 Sandy loam
Acacia nilotica 8.4 1.21 5.2 113.0 0.69 0.47 0.05 0.30 Sandy loam
namely: sodium (Na), potassium (K), calcium (Ca) and magnesium (Mg). The exchangeable cations were extracted by leaching the sample soil with normal ammonium acetate and analyzed spectrophotometrically. The soil chemical analyses were done in triplicate to verify the results.
RESULTS AND DISCUSSION The results of soil samples collected from underside the canopies of P. cineraria, P. juliflora, T. aphylla and A. nilotica are presented in Table 1. The texture of the soil was sandy and the soil was found to be moderately alkaline with the highest pH 8.6 in the soil collected from underside the canopy of T. aphylla, while minimum pH 8.2 was recorded in the soil samples collected from underside the canopy cover of P. juliflora (Table 1). The pH of the soil samples collected from underside the canopies of A. nilotica and P. cineraria were 8.4 and 8.3, respectively. The electrical conductivity (E.C.) was maximum (4.57 ds/m) in the soil samples from underside the canopy of T. aphylla. This increase of E.C. may be due to addition of salt accumulated leaves of this plant. Minimum E.C. 1.21 ds/m was recorded in the soils from underside the canopy of A. nilotica. The concentration of E.C. in the soils collected from underside the canopy P. juliflora and P. cineraria was 1.31 ds/m and 1.26 ds/m. The soil samples collected from underside the canopy of trees in Cholistan desert were analyzed for soluble ions (Table 1). The maximum phosphorus contents (6.2 ppm) were recorded in the soil collected from underside the canopy cover of P. juliflora, while minimum phosphorus contents (4.9 ppm) was noted in the soil sample from underside the canopy of P. cineraria. Phosphorus contents in the soil underside the canopy of T. aphylla and A. nilotica was 5.03 ppm and 5.2 ppm, respectively. Similar results were observed for Potassium contents in soil samples. Maximum potassium contents (123.3 ppm) were recorded in soil samples underside the canopy of P. juliflora and minimum 105.6 ppm underside the canopy of P. cineraria. While potassium contents in soil samples collected from underside the canopy cover of T. aphylla and A. nilotica was 117.3 ppm and 113.0 ppm.
280
J. Ecol. Nat. Environ.
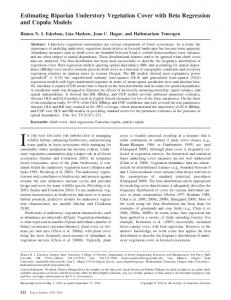
The results of the exchangeable cations (Na, Mg, Ca) measured in the different soil samples collected from underside the canopy cover of P. juliflora, P. cineraria, T. aphylla and A. nilotica varied greatly (Table 1). The maximum amount of these exchangeable cations was noted in the soil underside the canopy of T. aphylla namely: Ca (1.02 meq/L), Mg (3.09 meq/L) and Na (0.596 meq/L), while minimum amount of Ca (0.69 meq/L) was recorded in the soils from A. nilotica and P. cineraria. Calcium contents in the soils from the underside canopy cover of P. juliflora was 0.98 meq/L. Magnesium ions in soil samples from underside the canopy cover of P. cineraria were 0.38 meq/L, P. juliflora 0.45 meq/L and A. nilotica 0.47 meq/L. Minimum amount of Na (0.05 meq/L) was recorded in soil sample from underside the canopy of A. nilotica while soil samples from underside the canopy cover of P. juliflora and P. cineraria showed 0.19 and 0.23 meq/L of Na ions, respectively. The accumulation of organic matter was meager in all the soil samples collected underside the canopies of studied tree species (Table 1). Highest organic matter (0.34 %) was recorded in the soil from underside the canopy cover of P. juliflora and minimum (0.25%) under P. cineraria. In the soil from A. nilotica and T. aphylla organic matter was 0.30 and 0.28%, respectively. Plant density Number of plant species recorded under the canopy of P. juliflora, P. cineraria, T. aphylla and A. nilotica varied greatly from one plant species to other species (Figure 1). Under the canopy cover of P. juliflora nine plant spe-cies were recorded. S. plumosa appeared as the domi-nant plant species having maximum plant density (23.55), whereas minimum plant density (0.11) was recorded by Panicum antidotale, Lasiurus scindicus and Leptadenia pyrotechnica. The density of Cenchrus ciliaris was 2.22, Haloxylon salicornicum 2.11, Salsola baryosma 1.88, Tribulus terristris 0.44 and Suaeda fruiticosa 0.22. Eleven plant species were recorded under the canopy of P. cineraria. S. plumosa again appeared as dominant plant having maximum density (15.00), while the lowest plant density was attained by Launea procumbens (0.11). Plant density of C. ciliaris and S. baryosma was 10.77 and 9.33. However the density in other plant species ranged between 0.22 to 1.00. Thirteen plant species were recorded growing under the canopy of T. aphylla. Maximum density (12.77) was scored by S. plumosa closely followed by S. baryosma (11.20). Minimum plant density was attained by P. cineraria (0.11). Density of other plant species including Chenopodium album, Sonchus asper, L. scindicus, P. antidotale, Alhaji morarum, Launea nudicaulis, C. ciliaris, Ochthocloa compressa, L. procumbens and Cynodon dactylon ranged from 0.22-8.11. Under the canopy cover of A. nilotica thirteen plant species were noted. Out of which S. plumosa attained the highest density (6.66). Both Calligonum poly-
gonoides and H. salicornicum scored minimum plant density (0.11). The range of plant density in P. juliflora, L. pyrotechnica, S. fruiticosa, L. nudicaulis, L. scindicus, A. nilotica, O. compressa, S. baryosma, L. procumbens and C. ciliaris was 0.22 to 5.88. Plant frequency percentage Plant frequency recorded under the canopy of P. juliflora, P. cineraria, T. aphylla and A. nilotica varied from one species to the other (Figure 2). Under the canopy of P. juliflora, S. baryosma and C. ciliaris appeared as commonly occurring plants having maximum plant frequency (55.55%). Whereas minimum plant frequency (11.11%) was recorded by L. scindicus, L. pyrotechnica, P. antidotale, S. fruiticosa and T. terristris. Frequency of Stipagrostis plumosa and H. salicornicum was 33.33 and 44.44%. Underside the canopy cover of P. cineraria highest plant frequency was noted by S. baryosma and minimum plant frequency (11.11%) was recorded by L. procumbens, Citrulus colocynthis, C. setigerus, Sesuvium sesuvioides and O. compressa. C. polygonoides and C. ciliaris scored plant frequency 22.22% and 77.78%. Plant frequency percentage varied under the canopy cover of T. aphylla. Maximum plant frequency (55.55%) was shown by L. procumbens and minimum (11.11%) was recorded by S. plumosa, Chenopodium album, P. cineraria and Sonchus asper. The range of plant frequency in other plant species was between 22.22 to 44.44%. Underside the canopy of A. nilotica highest plant frequency (88.89) was recorded by C. ciliaris and minimum (11.11%) was scored by H. salicornicum. C. polygonoides, A. nilotica, L. pyrotechnica and P. cineraria. Plant frequency in other plants ranged between 22.22 and 55.55%. Importance value Figure 3 shows the pattern of change in the importance value of understory plant species growing as common associates under the canopy cover of tree species. According to the importance value (92.75) S. plumosa appeared as dominant plant species, whereas T. terristris appeared as the rare plant with importance value 8.56. Importance value of associated plants such as S. baryosma, H. salicornicum, C. ciliaris, P. antidotale, L. pyrotechnica, S. fruiticosa and L. scindicus was 45.61, 41.78, 36.39, 21.64, 21.64, 15.99 and 15.63, respectively. Under the canopy of P. cineraria, S. baryosma and S. plumosa appeared as the dominant plant species, scoring importance value 63.81 and 60.16. While the rare plant species under the canopy of P. cineraria was L. procumbens having importance value 3.82. The importance value of other associated plant species such as C. ciliaris, P. cineraria, C. polygonoides, O. compressa, T. terristris, Ctrulus colocynthis, Cenchrus setigerus and Sessuvium sessuvioides was 50.03, 42.88, 32.58, 13.44, 10.58, 8.59, 7.44 and 4.69, respectively.
25
16 14
10
10
9.33
Density (D)
Density (D)
12
Prosopis juliflora
Prosopis cineraria
10.77
20
15
281
15
23.55
Nisar et al.
8 6
0.22
0.33
Cp
0.44
1
Pc
0.22
0.33
Oc
Ss
Cs
Ccol
Cc
Stp
Sb
Plant species under Prosopis juliflora
Lp
0
Lp
Sf
Ls
Tt
Pa
Cc
Hs
Stp
Sb
0
Tt
0.11
2
0.66
0.11
0.11
0.44
0.11
0.22
4
2.22
2.11
1.88
5
Acacia nilotica
6
Density (D)
8.11 7.11
2.88
4
3
8
3.88
5
10
0.22
0.88 0.22
0.11 Cp
1.11 0.11
0.11
0.33
1
Hs
1.77
2
0.33
3.66 0.22
2
1.11
1.44
2.55
4
1.55
3
6
0.88
Pj
Ln
Lp
Lp
Can
Sf
Oc
Ls
Sa
Pc
Cd
Oc
Ln
Pa
Ls
Am
Lp
Ca
Cc
Sb
Stp
Plant species under Tamarix aphylla
Cc
0
0
Stp
Density (D)
5.88
Tamarix aphylla
Sb
12
7
11.2
14
6.66
12.77
Plant species under Prosopis cineraria
Plant species under Acacia nilotica
Figure 1. Density of the plant species forming the under-story vegetation of major tree species of Cholistan desert. Sb, Salsola baryosma; Stp, Stipagrostis; Hs, Haloxylon salicornicum; Cc, Cenchrus ciliaris; Aj, Aerva javanica; Tt, Tribulus terristris; Acj, Acacia jacquemontii; Cp, Calligonum polygonoides; Dg, Dipterygium glaucum; Pa, Panicum antidotale; Ls, Lasiurus scindicus; Sf, Suaed a fruiticosa; Lp, Leptadenia pyrotechnica; Ccol, Citrulus colocynthis; Pc, Prosopis cineraria; Ss, Sessuvium sesuvioides; Oc, Ochthocloa compressa; Ca, Chenopodium album; Lp, Launea procumbens; Ln, Launea nudicaulis; Am, Alhagi morarum; Cd, Cynodon dactylon; Sa, Sonchus asper; Can, Acacia nilotica; Pj, Prosopis juliflora; Cs, Cenchrus setigerus.
Under the canopy of T. aphylla, S. baryosma was dominant plant with maximum importance value 63.81 while minimum (6.86) importance value was scored by P. cineraria. Under the canopy of A. nilotica, C. ciliaris was recorded as the dominant plant with importance value 66.19. While minimum importance value (6.84) was scored by H. salicornicum and C. polygonoides. The associated plants under the canopy of A. nilotica were S. baryosma, S. plumosa, S. fruiticosa, L. procumbens, O. compressa, L. scindicus, L. nudicaulis, A. nilotica, L. pyrotechnica and P. juliflora having importance value 44.02, 42.64, 28.38, 26.60, 25.74, 13.41, 12.58, 12.22, 7.24 and 7.26, respectively.
The tree species in the present study were of the same height and age but this introduces a bias while comparing the effect of the tree canopies on the understory vegetation. The composition of understory vegetation underside the canopy cover may differ from one tree species to another one as the canopy of tree species had a great influence on shrub and herb cover underside it (Klinka et al., 1996). This may be due the fact that there occurs competition among understory plant species for soil moisture, soil nutrients or may be to escape high solar radiation and heat stress to avoid excessive transpiration as there is already scarcity of water in deserts. Soil characteristics were the most striking factors which
77.78 66.67
55.55
70 60 50
11.11
11.11
20
10
11.11
30
22.22
40 22.22
11.11
11.11
11.11
11.11
20
11.11
30
Prosopis cineraria
11.11
Prosopis juliflora
80
11.11
40
Frequency percentage
90
44.44
50
88.89
100
33.33
Frequency percentage
60
55.55
J. Ecol. Nat. Environ.
55.55
282
10 0
Oc
Ss
Cs
Cp
Pc
Tt
Cc
60
33.33 11.11 Lp
22.22 11.11 Can
11.11 Cp
20
10
11.11
30
22.22
22.22
40
11.11
50
44.44
55.55
70
Hs
11.11
11.11
Acacia nilotica
80
44.44
22.22
22.22
20
11.11
Lp
90
Frequency percentage
44.44
33.33
33.33
33.33
44.44
30
11.11
88.89
100
Tamarix aphylla
33.33
Frequency percentage
50
40
Plant species under Prosopis cineraria
55.55
60
Ccol
Plant species under Prosopis juliflora
Stp
Sb
Lp
Sf
Ls
Tt
Pa
Cc
Sb
Stp
Hs
0
10
Pj
Ln
Lp
Sf
Oc
Ls
Cc
Stp
Sa
Cd
Pc
Oc
Ln
Pa
Ls
Am
Lp
Ca
Cc
Stp
Sb
Plant species under Tamarix aphylla
Sb
0
0
Plant species under Acacia nilotica
Figure 2. Frequency percentage of plant species forming the under-story vegetation of major tree species of Cholistan desert. Sb, Salsola baryosma; Stp, Stipagrostis; Hs, Haloxylon salicornicum; Cc, Cenchrus ciliaris; Aj, Aerva javanica; Tt, Tribulus terristris; Acj, Acacia jacquemontii; Cp, Calligonum polygonoides; Dg, Dipterygium glaucum; Pa, Panicum antidotale; Ls, Lasiurus scindicus; Sf, Suaed a fruiticosa; Lp, Leptadenia pyrotechnica; Ccol, Citrulus colocynthis; Pc, Prosopis cineraria; Ss, Sessuvium sesuvioides; Oc, Ochthocloa compressa; Ca, Chenopodium album; Lp, Launea procumbens; Ln, Launea nudicaulis; Am, Alhagi morarum; Cd, Cynodon dactylon; Sa, Sonchus asper; Can, Acacia nilotica; Pj, Prosopis juliflora; Cs, Cenchrus setigerus.
best explained the composition of ground flora underside the tree canopy. More precisely the organic matter availability of soil best explained the vegetation composition (Missin et al., 2001; Hutchinson et al., 1999). P. cineraria had high amount of soil organic matter under its canopy as compared to other tree species and this was due the reason that the leaves of P. cineraria are smaller and can easily be decomposed, as the result much litter was produced (Gower and Son, 1992). Top soil pH and other earth-alkaline cations (Na, Mg, Ca) were highest in the soil samples underside the canopy of T. aphylla. It was
explained that T. aphylla was a highly salt tolerant and incorporate these salts in its metabolism and finally these salts ooze out through salt glands present in the leaves. The highest phosphorus and potassium contents were observed under P. cineraria while all other tree species were intermediate. The species richness and diversity was much higher underside the canopy cover of A. nilotica (13 plant species) and T. aphylla (13 plant species) very closely followed by P. cineraria (11 plant spp.) and 9 plant species were recorded underside the canopy of P. juliflora.
52.03
90
60
Prosopis cineraria 42.88
80
50
70
36.39
IVI
40
0
Tamarix aphylla
13.44 4.69
Ss
Oc
Cs
Cp
12.58
26.6 12.22
7.26
6.84 Cp
7.26
6.84 Hs
7.29
10 0
28.38
13.41
13.13
20
6.86
Pc
Tt
Ccol
Cc
Lp
40
25.74
IVI
25.47
28.3 20.29 14.43
10
Acacia nilotica
30
7.07
20
42.64
38.04 32.16
31.53
30
44.02
60
50
20.94
Plant species under Tamarix aphylla
Pj
Ln
Lp
Lp
Can
Sf
Oc
Cc
Stp
Sb
Sa
Cd
Pc
Oc
Ln
Pa
Ls
Am
Lp
Ca
Cc
Sb
Stp
0
Ls
IVI
66.19
55.44
Plant species under Prosopis cineraria 70
50
40
Stp
Sb
Lp
Sf
Ls
Tt
Pa
Cc
Hs
Stp
Sb
0
Plant species under Prosopis juliflora 60
7.44
10
10
10.58
20 8.59
15.99
8.56
20
15.63
30
21.64
30 21.64
40
3.82
41.78
45.61
IVI
50
32.58
Prosopis juliflora 60
283
60.16
70
92.75
100
63.81
Nisar et al.
Plant species under Acacia nilotica
Figure 3. IVI of the plant species forming the under-story vegetation of major tree species of Cholistan desert. Sb, Salsola baryosma; Stp, Stipagrostis; Hs, Haloxylon salicornicum; Cc, Cenchrus ciliaris; Aj, Aerva javanica; Tt, Tribulus terristris; Acj, Acacia jacquemontii; Cp, Calligonum polygonoides; Dg, Dipterygium glaucum; Pa, Panicum antidotale; Ls, Lasiurus scindicus; Sf, Suaeda fruiticosa; Lp, Leptadenia pyrotechnica; Ccol, Citrulus colocynthis; Pc, Prosopis cineraria; Ss, Sessuvium sesuvioides; Oc, Ochthocloa compressa; Ca, Chenopodium album; Lp, Launea procumbens; Ln, Launea nudicaulis; Am, Alhagi morarum; Cd, Cynodon dactylon; Sa, Sonchus asper; Can, Acacia nilotica; Pj, Prosopis juliflora; Cs, Cenchrus setigerus.
S. plumosa, S. baryosma and C. ciliaris appeared as the most frequently and abundantly occurring plant species forming the understory composition of vegetation. Some scientists reported the same canopy cover effects on understory vegetation (Callaway et al., 1991) while many others reported that the effect of tree canopy cover on understory vegetation diversity was much low (Whitney and Foster, 1988; Hong et al., 1997). The variation in the understory flora was may be due to the presence of thick litter layers or some plant species were sensitive to thick litter layers (Sydes and Grime, 1981 a, b; Holderegger, 1996). It is concluded from the present study that tree species greatly modified the soil chemistry beneath the canopy
cover. S. plumosa, S. baryosma and C. cilaris were the major plant species that form the understory flora of tree species due to their close association with each other in the Cholistan desert. Other plant species also take part in forming the understory vegetation of tree species but to some less extent as they fail to form any type of association with each other. REFRENCES Arshad M, Akbar G (2002). Benchmark of plant communities of Cholistan desert. Pak. J. Biol. Sci. 5: 1110-1113. Arshad M (2003). Cholistan desert ecosystem monitoring for future management. Annual Technical report of a project sponsored by WWF-Pakistan. (Unpublished)
284
J. Ecol. Nat. Environ.
Arshad M, Hussain A, Ashraf MY, Naureen S, Moazzam M (2008). Edaphic factors and distribution of vegetation in the Cholistan desert, Pakistan. Pak. J. Bot. 40(5):1923-1931. Arshad M, Ashraf MY, Ahmad M, Zaman F (2007). Morpho-genetic variability potential of Cenchrus ciliaris L., from Cholistan desert, Pakistan. Pak. J. Bot. 39: 1481-1488. Callaway RM, Cipollini D, Barto K, Thelen GC, Hallett SG, Prati D, Stinson K, Klironomos J (1991). Novel Weapons: Invasive plant suppresses fungal mutualists in America but not in its native Europe. Ecology 89(4):1043-1055. Chul KS, Moody K (1983). Comparison of some methodologies for vegetation analysis in transplanted rice. Korean J. Crop Sci. 28: 310318. Curtis JT, Mclntosh RP (1951). An upland forests continues in the prairie forest border region of Wisconsin. Ecology 32: 476-449. Gilliam FS, Turrill NL (1993). Herbaceous layer cover and biomass in a young versus a mature stand of a central Appalachian hardwood forest. Bulletin of the Torrey Botanical Club 120:445-450. Gower ST, Son Y (1992). Differences in soil and leaf litterfall nitrogen dynamics for five forest plantations. Soil Sci. Soc. Am. J. 56: 19591966. Holderegger R (1996). Effects of litter removal on the germination of Anemone nemorosa L. Flora 191: 175-178. Hong Q, Klinka K, Sivak B (1997). Diversity of the understory vascular vegetation in 40 year old and old growth forest stands on Vancover Island, British Columbia. J. Veg. Sci. 8: 778-780. Hussain F (1989). Field and Laboratory Manual of Plant Ecology. National Academy of Higher Education, University Grants Commission, Islamabad, Pakistan. Hutchinson TF, Boerner EJ, Iverson LR, Sutherland S, Sutherland EK (1999). Landscape patterns of understory composition and richness across a moisture and nitrogen mineralization gradient in Ohio (USA) Quercus forests. Plant Ecol. 144:177-189. Klinka K, Chen HYH, Wang Q, de Montigny L (1996). Forest canopies and their influence on understory vegetation in early seral stands on West Vancouver Island. Northwest Sci. 70:193-200. Legare S, Bergeron Y, Pare D (2001). Comparison of the understory vegetation in boreal forest types of southwest Quebec. Can. J. Bot. 79:1019-1027.
Missin L, Du Bus de Warnaffe G, Jonard M (2001). Effects of fertilization on the vascular ground vegetation of European beech (Fagus sylvatica L.) and sessile oak (Quercus petraea (Matt.) Lieb.) stands. Ann. For. Sci. 58: 829-842. Muller-Dombois D, Ellenberg H (1974). Aims and methods of vegetation ecology. John Willey and Sons. Inc., New York. Nisar MF, Iram S, Akhtar Y, Majeed A, Ismail S, Lin F (2010). AFLP based analysis of genetic diversity in buffle grass. World Appl. Sci. J. 10(5):560-567. nd Oosting HJ (1957). Study of plant community. Freeman Co., 2 Ed. 6264, 3050. Rao AR, Arshad M, Shafiq M (1989). Perennial grass germplasm of Cholistan desert and their phytosociology. Cholistan Institute of Desert Studies, Islamia University of Bahawalpur. pp. 84. Ste-Marie C, Pare D (1999). Soil, pH, and N availability effects on net nitrification in the forest floors of a range of boreal forest stands. Soil Biol. Biochem. 31:1579-1589. Sydes C, Grime JP (1981a). Effects of tree leaf litter on herbaceous vegetation in deciduous woodland. I- Field Investigation. J. Ecol. 69: 237-248. Sydes C, Grime JP (1981b). Effects of tree leaf litter on herbaceous vegetation in deciduous woodland. II – An Experimental Investigation. J. Ecol. 69:249-262. Whitney GG, Foster DR (1988). Overstory composition and age as determinants of the understory flora of woods of central New England. J. Ecol. 76: 867-876. Zavitkovski J (1976). Ground vegetation biomass, production and efficiency of energy utilization in some northern Wisconsin forest ecosystems. Ecology 57:694-706.