Hindawi Publishing Corporation Stem Cells International Volume 2012, Article ID 658356, 13 pages doi:10.1155/2012/658356
Research Article Comprehensive Characterization of Mesenchymal Stem Cells from Human Placenta and Fetal Membrane and Their Response to Osteoactivin Stimulation C. M. Raynaud,1, 2 M. Maleki,1 R. Lis,1 B. Ahmed,3 I. Al-Azwani,4 J. Malek,4 F. F. Safadi,5, 6 and A. Rafii1, 2 1 Stem
Cell and Microenvironment Laboratory, Weill Cornell Medical College in Qatar, Qatar Foundation, Doha 24144, Qatar of Genetic Medicine and Obstetrics and Gynecology, Weill Cornell Medical College, New York, NY 10065, USA 3 Maternal and Fetal Unit, Women Hospital, Hamad Medical Corporation, Doha 3050, Qatar 4 Genomic Core, Weill Cornell Medical College in Qatar, Qatar Foundation, Doha 24144, Qatar 5 Departments of Anatomy and Cell Biology, Orthopaedic Surgery and Sport Medicine, Temple University School of Medicine, Philadelphia, PA 19140, USA 6 Department of Cell and Developmental Biology, Weill Cornell Medical College, Doha 24144, Qatar 2 Departments
Correspondence should be addressed to A. Rafii,
[email protected] Received 9 January 2012; Revised 12 March 2012; Accepted 30 March 2012 Academic Editor: Toshio Nikaido Copyright © 2012 C. M. Raynaud et al. This is an open access article distributed under the Creative Commons Attribution License, which permits unrestricted use, distribution, and reproduction in any medium, provided the original work is properly cited. Mesenchymal stem cells (MSCs) are the most promising seed cells for cell therapy and can be isolated from various sources of human adult tissues such as bone marrow (BM-MSC) and adipose tissue. However, cells from these tissues must be obtained through invasive procedures. We, therefore, characterized MSCs isolated from fresh placenta (Pl-MSC) and fetal membrane (MbMSC) through morphological and fluorescent-activated cell sorting (FACS). MSC frequency is higher in membrane than placenta (2.14% ± 0.65 versus 15.67% ± 0.29%). Pl/Mb-MSCs in vitro expansion potential was significantly higher than BM-MSCs. We demonstrated that one of the MSC-specific marker is sufficient for MSC isolation and that culture in specific media is the optimal way for selecting very homogenous MSC population. These MSCs could be differentiated into mesodermal cells expressing cell markers and cytologic staining consistent with mature osteoblasts and adipocytes. Transcriptomic analysis and cytokine arrays demonstrated broad similarity between placenta- and membrane-derived MSCs and only discrete differences with BM-MSCs with enrichment of networks involved in bone differentiation. Pl/Mb-MSCs displayed higher osteogenic differentiation potential than BM-MSC when their response to osteoactivin was evaluated. Fetal-tissue-derived mesenchymal cells may, therefore, be considered as a major source of MSCs to reach clinical scale banking in particular for bone regeneration.
1. Introduction Multipotent mesenchymal stem cells (MSCs) are able to selfrenewed and differentiate into mesodermal lineages such as adipogenic, chondrogenic, osteogenic, myogenic, and angiogenic cells [1]. MSCs were initially isolated from bone marrow by Haynesworth et al. [2]. In the bone marrow, they provide support for hematopoiesis [3]. They also secrete several growth factors important in angiogenesis including vascular endothelial growth factors [4]. Therefore, they represent one of the most promising cell types for cell therapies and tissue engineering or trauma repair. Indeed, different
preclinical experiments using MSCs have been performed demonstrating their ability to improve myocardial or cerebral function after ischemic stress, or liver and joint damage after traumatic or surgical injuries [5–8]. They might also be optimal for cellular therapy by inducing immune tolerance. Indeed, they can generally be transplanted even in large outbreed animals across major histocompatibility complex (MHC) barriers without need for immune suppression [9]. The bone marrow is the traditional source of human MSCs, but they have been isolated from a wide variety of human adult tissues such as adipose tissue [10], lung [11], and liver [12]. However, cells from most of these tissues must
2 be obtained through invasive procedures, and the interindividual variability is hard to control. Several studies describe the isolations of MSCs from fetal tissues such as umbilical cord blood [13], placenta [14–16], amniotic membrane [17, 18], and amniotic fluid [19], and they have described their MSCs characteristics. Osteoactivin (OA) has the ability to regulate cell proliferation, adhesion, differentiation, and synthesis of extracellular matrix proteins in various cell types [20–30]. OA messenger ribonucleic acid (mRNA) and protein are expressed by human and rodent osteoblasts [29, 30]. OA downregulation decreases osteoblast differentiation and function [31]. Osteoblast cells express increasing levels of OA protein during their differentiation. OA has been demonstrated as essential for the differentiation and functioning of osteoblast cells [32]. We previously demonstrated that OA induces similar osteoblastic differentiation than BMP2 in mice MSC suggesting that OA may be a novel osteoinductive agent [29, 31, 32]. In this study, we optimized the isolation of placental and amniotic membrane MSC and compared their proliferative and differentiation potential to BM-MSCs. We isolated through different methods MSCs from placenta and fetal membranes, and we qualified them according to the standardize protocols from the international society for cellular therapy (ISCT) [33]. We further investigated and demonstrated that OA triggers osteoblastic differentiation in human MSCs and that the differentiation was even more important in fetal MSCs as compared to BM-MSCs. We illustrate that fetal tissues derived MSCs are more prone than BM-MSCs to differentiate into osteoblasts.
2. Materials and Methods 2.1. Placenta and Fetal Membranes Collection. Following approval from the Internal Review Board (HMC-IRB Protocol 9109/09, Weill Cornell Medical College in Qatar), placentas and fetal membranes were collected from donors at Woman’s Hospital at Hamad Medical Corporation immediately after elective caesarean section at term in the absence of labor, preterm rupture of membrane, chorioamnionitis, preeclampsia, intrauterine growth retardation, or chromosomal abnormalities. The specimen were completely deidentified and considered as biological waste. Therefore, no consent form was taken from the patients. 2.2. Mesenchymal Stem Cell Isolation. Supplementary Figure 1 (available at doi:10.1155/2012/658356) depicts the isolation procedures used in this study. For placenta, the decidua basalis was removed prior to harvesting the placental tissues. The placenta parts were free of any fetal membrane. For fetal membrane, we decided not to separate the amnion and chorion parts to illustrate the most direct workflow for MSCs isolation. The harvested pieces of tissues were washed in phosphate buffer saline (PBS, PH 7.4), mechanically minced into pieces of approximately 1 mm2 , and subsequently digested with dispase (1 mg/mL, Hyclone), collagenase (300 U/mL) (Hyclone), hyalluronidase
Stem Cells International (100 U/mL, Hyclone), and DNAse I (80 U/mL, Roche) for 1 h at 37◦ C under agitation (150 rpm). The homogenate was subsequently washed in PBS. Cells were then filtered on a 100 μm cells strainer. Red blood cells and aggregates were eliminated on a Ficoll gradient. The mononucleated fraction was collected for further analysis. Two million viable cells were then either directly plated in MSCs culture media (DMEM low glucose with 20% FBS, 2 mM L-Glutamin, and 1% penicillin/streptomycin [16]) or sorted through SORP FACS Aria II (BD Biosciences) and then plated in the MSC culture media in 24 well plates. Cultures were incubated in humidified 5% CO2 incubators and the media was replaced every 3 days. Several bone marrows MSCs from different donors (BM-MSCs) were purchased from Stem Cell Inc. (number MSC-001F, Stem Cell Inc.) and PromoCell (number 12974, PromoCell) and maintained in the same culture conditions as placenta-/membrane-derived MSCs (Pl/Mb-MSCs). We performed all analysis at the 4th passages in order to obtain a homogenous cell population and sufficient number of cells to perform all analysis in parallel. 2.3. Immunostaining and Fluorescence-Activated Cell Sorting (FACS) Analysis. For flow analysis of cell surface antigens and cell sorting, MSCs were stained for the expression of CD45, CD34, CD73, CD105, CD90, and CD29 using Mouse anti-human CD45 antibody (BD Biosciences, number 339192, clone 2D1) coupled with Amcyan, Mouse antihuman CD34 (BD Biosciences, number 555821, clone 581) coupled with FITC, Mouse anti-human CD105 (biolegend, number 323212, clone 43A3) coupled with AF647, Mouse anti-human CD73 (BD Biosciences, number 550257, clone AD2) coupled with PE, Mouse anti-human CD29 (biolegend, number 323212, clone TS2/16) coupled with APCCy7, and Mouse anti-human CD90 (BD Biosciences, number 550402, clone 5E10) coupled with AF700. Briefly, 1.106 cells were harvested and nonspecific sites were blocked in PBS-5%FBS-1%BSA-10%FcR Blocking Reagent (Myltenyi Biotec) for 30 minutes on ice. Cell suspension was incubated with specific antibodies for 45 minutes on ice. After washes in PBS and filtration on 45 μm strainer, cells were analyzed by fluorescence activated-cell sorting (FACS) on a SORP FACSAriaII (BD Biosciences) as described later. Data were processed with FACSDiva 6.3 software (BD Biosciences). Doublets were excluded by FSC-W × FSC-H and SSC-W × SSC-H analyses, single-stained channels were used for compensation, and fluorophore minus one (FMO) controls were used for gating, 500 000 events were acquired per sample [34]. 2.4. Immunocytochemistry. Cells in culture were grown on 8 chamber slides (BD falcon, number 354102) and stained as follows. The antibodies used were Mouse anti-human CD29FITC (biolegend, number 303016, clone TS2/16), CD73-PE (BD Biosciences, number 550257, clone AD2), CD90-AF568 (BD Biosciences, number 550402, clone 5E10), CD34-PE
Stem Cells International (BD Biosciences, number 555822, clone 581), CD45-Amcyan (BD Biosciences, number 339192, clone 2D1), unconjugated, and CD105 (BD Biosciences, number 555690, clone 266) revealed by a secondary goat anti mouse IgG1 antibody (invitrogen, number A-21121). Briefly, nonspecific sites and Fc receptors were blocked with PBS/0.3% bovine serum albumin/0.5% HS for 30 minutes and FcR blocking reagent (Miltenyi, number 120000-442). Sections were incubated with primary antibodies (1 hour 30 minutes), washed twice in PBS/0.5% Tween 20 (Sigma-Aldrich), and if necessary incubated with secondary antibodies (1 hour, AF488 goat anti-mouse IgG1 at 0.5 μg/mL). Nuclei were counterstained with 4-,6-diamidino-2-phenylindole (Invitrogen). Slides were mounted with the Fluoromount Kit (Invitrogen). Sections were analyzed with a Zeiss confocal microscope Laser Scanning Microscope 710 (Carl Zeiss). Pictures were analyzed with Zen 2008 V5,0,0228 software (Carl Zeiss). 2.5. Mesodermal Lineage Differentiation 2.5.1. Adipogenic Lineage. Adipogenic differentiation was induced by culturing 80% confluent MSC for 3 weeks in DMEM-HG, 1 μM dexamethasone, 5 μg/mL insulin (Sigma), 60 μM indomethacin (Sigma; catalogue number: 17378-5G), and 0.5 mM 3-Isobutyl-1-methylxanthine (IBMX; Sigma; catalogue number: I5879) [35]. Adipogenic differentiation was assessed by staining cells in wells with Oil Red O. 2.5.2. Osteogenic Lineage. Osteogenic differentiation was induced by culturing 90% confluent MSC for 3 weeks in DMEM-LG, 10% FCS, 0.1 μM dexamethasone (Sigma; Australia Register Number: 16375; Melbourne, Victoria, Australia), 50 μM L-ascorbic acid-2-phosphate (Sigma; catalogue number: A8960-5G; Castle Hill, New South Wales, Australia), 10 mM β-glycerol phosphate disodium salt pentahydrate (Sigma; catalogue number: 50020), and 0.3 mM inorganic (sodium) phosphate (Sigma) [35, 36]. Osteogenic differentiation was assessed by staining with Alizarin Red S. 2.5.3. Osteoactivin Stimulation. Three days after MSCs plating (50% confluence), recombinant human osteoactivin was delivered in a single dose of 100 ng/mL in differentiation media DMEM-LG, 10% FCS, 0.1 μM dexamethasone, 50 μM L-ascorbic acid-2-phosphate, 10 mM β-glycerol phosphate disodium salt pentahydrate, and 0.3 mM inorganic (sodium) phosphate. Controls were carried out in regular cell culture media described above. The osteogenic differentiation was then assessed at day 7, 14, and 21 after OA treatment by staining with Alizarin Red S. Following treatment, color phase contrast microscopy pictures were acquired at different time points. Analysis of the red channel was performed using image J (NIH). Normalization for cell number was done using the blue channel. 2.6. Transcriptomic Analysis. RNA was isolated using Trizol reagent followed by additional purification using RNAeasy extraction kit from Qiagen (QIAGEN, number 74106) with
3 RNA yields that produces satisfactory microarray data. Two quality control measures were carried out: (1) a spectrophotometric analysis and (2) a size fractionation procedure using a microfluidics instrument (Agilent Technologies). 200 ng of total RNA were analyzed on Affymetrix GeneChip Human Genome U133 Plus 2.0 Array. Data were analyzed using Parteck Software (V6.09.1110-6; Affimetrix). Class comparison between BM-MSCs and Pl/Mb-MSCs (three biological replicates of each) was performed to identify gene expression changes with a significant expression differences (P < 0.05) and 2-fold increase or decrease expression. Parteck Software gene ontology tools were used to determine gene enrichment [37]. We used Ingenuity Pathway Analysis software (Ingenuity Systems, Redwood City, CA) to identify and analyze relevant pathways from the gene lists obtained after comparison of BM-MSC and Mb/Pl-MSC. Networks were constructed by overlaying the genes in the gene list onto a global molecular network developed from information contained in the Ingenuity Pathways Knowledge database using keywords such as organ formation and osteoblast differentiation. Networks of the genes up- or downregulated Pl/Mb-MSCs as compared to BM-MSCs were then algorithmically generated based on their connectivity. A network is a graphical representation of the molecular relationships between genes. Genes are represented as nodes, and the biological relationship between two nodes is represented as a line. All edges are supported by at least one reference from the literature, from a textbook, or from canonical information stored in the Ingenuity Pathways knowledge database. P values for the enrichment of canonical pathways were then generated based on the hypergeometric distribution and calculated with the righttailed Fisher’s exact t-test for 2 × 2 contingency tables. 2.7. Phospho-Kinase Array. MSCs were cultivated in differentiation or control media in presence or absence of OA for 4 h. Cells were harvested and proteins extracted as recommended and quantified based on sample absorbance at 280 nm using nanodrop device (Thermo-Scientific). 200 μg of protein was loaded on R&D system Human Phosphokinase Antibody Array (R&D system, number ARY003) according to manufacturer’s instructions. Arrays were revealed using HorseRadish Peroxidase (HRP) and SuperSignal West Pico Chemiluminescent Substrate (Thermo Scientific). Data were collected using Geliance CCD camera (Perkin Elmer) and extracted using Image J software (NIH). Briefly, arrays’ pictures were inverted and background subtracted. We defined a 120-micron diameter area for signal capture. Median pixel density was used to evaluate the signal. For comparison, independent array values were normalized on their positive control intensity values. 2.8. Cytokine Array. MSCs were cultivated in serum free media for 72 hours as previously published [38]. Supernatant was collected and proteins quantified based on sample absorbance at 280 nm using nanodrop device (ThermoScientific). 200 μg of protein was loaded on R&D system
4 Human Cytokine Antibody Array panel A (R&D system, number ARY005) according to manufacturer’s instructions. Arrays were analyzed as described above. 2.9. Statistical Analysis. Student-t, Fisher exact, or chi-square tests were performed as appropriate. All P-values are twosided with statistical significance evaluated at the 0.05 alpha level. All statistical analysis were done using the data analysis plug-in shipped into the Excel 2008 for Mac (Microsoft). We first calculated the variance of two paired. Mean ± SEM are shown on the graphs. All results are representative of the indicated number of independent experiments.
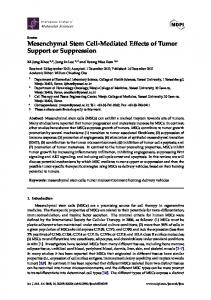
3. Results 3.1. MSCs Isolation Methods. Supplementary Figure 1 depicts the workflow chart of the enzyme-mediated cell isolation of human term placenta/membrane, by direct culture or cell sorting, for derivation of fibroblast-like cells, that we characterized as multipotent mesenchymal stem cells (MSCs). Two methods were used to isolate MSCs. (i) selection in specific MSC media after direct culture of cell suspension obtained following tissue digestion, (ii) fluorescent-activated cell sorting according to expression of specific MSCs markers as defined by the international society for cellular therapy (ISCT, positive for CD105, CD73, CD90, CD29, and negative for CD45 and CD34) [39]. 15 different amniotic membranes and placentas were used in this study. We were able to differentiate MSCs from all of these specimens, all analyses are representative of 3 different samples. 3.2. MSCs Are More Abundant in Membrane Than Placenta. We quantified the number of MSCs in fetal membrane and placenta using polyvariate flow cytometry. CD45− , CD34− cells were selected and analyzed for the expression of CD105, CD73, CD90, and CD29. MSCs as defined by these 4 markers were significantly more abundant in the membrane, MbMSC 15.67% (±0.29%) than the placenta, Pl-MSC 2.14% (±0.65%, Figure 1(a)). The same results were found when 2 million cells were directly plated after tissue digestion. The number of adherent cells was significantly higher at day 1 in the membrane compare to the placenta (Figure 1(b)). 3.3. Placenta or Membrane Isolated MSCs Have Greater Proliferation Ability Than Bone Marrow MSCs. Growth kinetic of Mb-MSCs and Pl-MSCs were compared with BM-MSCs at the same passage. The proliferation rate of Pl/Mb MSCs was significantly higher than BM-MSCs (Figure 1(c)). Moreover, Mb-MSCs and Pl-MSCs were expandable up to passage 15 without modification of their morphology or proliferation rate as described in other studies however BM-MSC stopped proliferating after passages 7 to 8 [14]. 3.4. Analysis of Subpopulations Based on CD90 and CD29 Expression. We first defined our cell population as being negative for CD45 and CD34. In all our independent
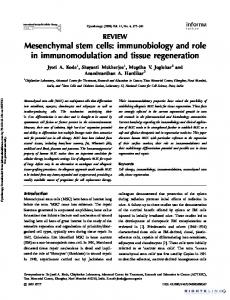
Stem Cells International experiences, the vast majority if not all (85% to 99%) of CD73+ , CD105+ cells was also expressing CD90 and CD29 reaching the canonical definition of MSCs [33, 39]. However, the number of CD90+ , CD29+ cells positive for CD73 and CD105 was lower ranging from 65% To 85% (Figure 2). We, therefore, decided to further analyze the populations characterized by CD90/CD29 expression. We wondered our ability to derive MSCs from these different cell populations. We sorted 4 subpopulations based on the expression of those markers: CD90+ CD29+ ; CD90− CD29+ ; CD90+ CD29− ; CD90− CD29− in placentas and fetal membranes (Figure 2 and Supplementary Figure 2). We performed all experiences on 3 independent donors. The purity of the sort was assured by applying the purity mask and controlling for the purity of the different cell populations sorted. None of the CD90− CD29− cells were able to grow in MSCs media. The CD29− CD90− is actually a very homogenous population containing mostly CD73− CD105− cells (Supplementary Figure 2). In contrast, we were able to derive mesenchymal like cells from the 3 other sorted subpopulations. This indicates that expression of at least one of these 2 markers is indispensable for MSCs isolation and qualification. After 4 passages, the large majority of the cells sorted expressed CD90 and CD29. (Table 1 and Supplementary Figure 3). At this stage, the large majority displayed a CD73+ CD105+ profile. We confirmed the expression of all markers by immunofluorescence staining (Supplementary Figure 4). 3.5. Differentiation Assay of Placenta and Membrane MSCs. Specific induction of adipogenic and osteogenic differentiation was performed on Mb/Pl MSCs sorted based on CD29 and CD90 expression or directly plated after isolation and compared to BM-MSCs differentiation (Figure 3(a)). All different cell populations from placenta or membrane regardless of the isolation protocol were identically able to differentiate into adipocytes and osteoblasts confirming their phenotypic and functional similarity (data not shown). 3.6. Cytokines Secretion of MSCs. Cytokine secretion profile was highly similar between fetal and BM-MSCs with strong secretion of GROα (CXCL1), IL-6, IL-8 (CXCL8), MCP1 (CCL2), MIF (GIF, DER6), and serpin E1 (PAI-1), see Figures 3(b) and 3(c). Only discrete differences were noted, GROα (CXCL1) secretion by the BM-MSCs was higher than its expression in the fetal MSCs, whereas the expression of IL-6 and MCP-1 in the BM-MSCs was comparatively lower than in fetal MSCs. 3.7. Transcriptomic Comparison of Fetal and Bone Marrow MSCs. We first analyzed differences between membranederived and placenta-derived MSCs. As demonstrated by our PCA analysis, MSCs derived from membrane or placenta could not be differentiated based upon their transcriptomic profile (Figure 4(a)). We then analyzed the different subpopulations defined by CD90 and CD29 expression. They also displayed similar transcriptomic profile (Figures 4(b) and 4(c)).
Stem Cells International
5
Table 1: Proportion of cell expressing MSCs specific markers. After 4 passages, every cell sorted subtype and bone marrow MSCs were stained for CD45, CD34, CD90, CD29, CD105, and CD73. 99% of the cells were CD34 and CD45 negative and more than 80% positive for the MSCs makers. Bone marrow Membrane Membrane CD29+ CD90+ Membrane CD29+ CD90− Membrane CD29− CD90+ Placenta Placenta CD29+ CD90+ Placenta CD29− CD90+
CD90+ 97.6% 87.6% 79.3% 91.8% 85.2% 91.1% 79.1% 84.7%
When compared to BM-MSCs, 145 genes were significantly upregulated and 267 genes were downregulated in Mb-MSCs compared to BM-MSCs (Supplementary Table 1 and Supplementary Figure 5). Similarly, 154 genes were significantly upregulated (133 overlapping with Mb-MSCs upregulated genes) and 272 genes were downregulated (238 overlapping with Mb-MSCs downregulated genes) in the PlMSCs compared to BM-MSCs (Supplementary Table 2 and Supplementary Figure 5). By ingenuity and David analysis, we were able to define several pathways and genes implicated in embryonic morphogenesis and organ development upregulated in the Pl and Mb-MSC compared to BM-MSC (Figure 4(d) and Supplementary Table 3). Several genes implicated in extracellular matrix organization, the skeletal system development and vasculature development were upregulated in the BMMSC compared to Pl and Mb-MSC (Supplementary Table 4). We then performed ingenuity pathway analysis building organ formation and osteoblast differentiation molecular networks. We found 14 genes upregulated in Pl/Mb MSC implicated in osteogenic differentiation in literature such as BMP, IGFBP4, IL6, HGF, and PTGS2 (Figure 4(e)). 3.8. Osteoactivin-Derived Osteoblast Differentiation. Amniotic-membrane-derived MSCs (Mb-MSCs) were used for this part of the study as they are similar to the MSCs derived from the placenta and more abundant. In our cell culture and differentiation settings, the Mb/Pl MSCs displayed no differences in their ability to differentiate toward osteoblasts compare to BM-MSCs. OA treatment increased the differentiation for both Mb-MSC and BM-MSC at days 14 and 21 as demonstrated by Alizarin red staining, with Mb-MSCs displaying significantly increased osteogenic differentiation (Figures 5(a) and 5(b)). We noticed that the addition of OA to the differentiation media accelerated osteogenic differentiation with positive Alizarin staining from day 7 for Mb-MSC and day 14 for BM-MSC (data not shown). 3.9. Phosphokinase Array Analysis of Differentiating Cells. We analyzed the phosphorylation pattern of a range of phosphokinase after 4 h of OA stimulation in Pl-MSCs
CD29+ 90.9% 99.8% 99.7% 98% 99.9% 99.8% 99.9% 99.6%
CD105+ 99.7% 96.7% 96.4% 98.1% 98.5% 99.2% 99.1% 99.8%
CD73+ 98.7% 99.8% 99.5% 97.8% 99.4% 99.5% 99.9% 99.5%
and BM-MSCs (Figures 6(a) and 6(b)). For both cell lines, there is a phosphorylation of Chk2 compatible with reduced proliferation during the differentiation process. While CREB is phosphorylated in BM-MSC, OA triggers ERK1/2 phosphorylation in Pl-MSCs. ERK activation was already previously described by Furochi et al. [40] as activated through OA. Those previous findings together with our datas lead us to stand for an OA activation role in osteogenic differentiation notably through ERK1/2 pathway activation in fetal-derived MSCs.
4. Discussion MSCs are thought to have great therapeutic potential due to their capacity for self-renewal and multilineage differentiation [4, 41]. For example, they support hematopoiesis and enhance engraftment of hematopoietic stem cells after cotransplantation [3, 42]. Experimental and clinical data have demonstrated an immune-regulatory function of BMderived MSCs that may contribute to the reduction of graft-versus-host disease following hematopoietic stem cell transplantation [43, 44]. Furthermore, even if clinical studies remain anecdotal, BM-MSCs have been reported to exert beneficial effects in the healing of a limited number of patients with bone nonunions [45–50]. MSCs initiate the fracture repair process leading to the formation of a cartilaginous template (callus) that is then replaced by new bone that fills the gap [6]. Limitation in MSC number and/or functions is hypothesized to play a critical role in the pathogenesis of post fracture nonunions. Currently, the bone marrow is perceived as the major source of MSCs for cell therapy. However, aspiration of BM involves invasive procedures. The frequency, differentiation, and growth potential of BM-MSCs decrease significantly with age [51]. Thus, the search for alternative consistent sources of MSCs is of significant value. Indeed, when we consider therapeutic application, it will be mandatory to access cell banks displaying a large variety of HLA types. It has been reported that MSCs could be isolated from various tissues [11, 52]. Among these sources, placenta and membrane may be ideal sources due to their accessibility, painless donor procurement, promising sources for autologous cell therapy, and lower risk of viral contamination. The
6
Stem Cells International
∗∗
18
Placenta
16 14
(%)
12 10 8 Membrane
6 4 2 0 MSC placenta MSC membrane (a)
(b)
70000 60000
Cell count
50000 40000 30000 20000 10000 0 24 h
48 h
72 h
Placenta MSCs P = 5 Placenta MSCs P = 10 Placenta MSCs P = 15 Membrane MSCs P = 5 Membrane MSCs P = 10 Membrane MSCs P = 15 Bone marrow MSCs P = 5 (c)
Figure 1: Higher proportion of MSCs can be isolated from the membrane compare to the placenta. Fetal tissue derived MSCs display greater proliferation kinetic than bone marrow derived MSCs. (a) MSCs were defined as CD45− , CD34− , CD29+ , CD90+ , CD73+ , and CD105+ . Their proportion was then calculated in freshly digested placenta specimens and fetal membranes form 3 different donors. MSCs represented 15.67% (±0.29%) and 2.14% (±0.65%) of cells isolated from the membrane and placenta, respectively (∗∗ P = 9.25 · 10−4 ). (b) Day 1 phase contrast microscopy of adherent cells from placenta and membrane directly plated after tissue digestion in MSCs media. We can see significantly more adherent cells from digested membrane compared to placenta. (c) MSCs derived from placenta and membranes were expanded up to passage 15 without changes of their morphology or proliferation rate. Proliferation rate was assessed by cell counting at different passages. It was similar in placenta- and membrane-derived MSCs with no differences between early and late passages. However, proliferation rate was significantly higher than proliferation rate of bone-marrow-derived MSCs.
7 ×103
×103
Stem Cells International
200
150
SSC-A
200
SSC-A
27%
250
250
97%
150
100
100
50
50
M 50
100
150
200
−671
250
103
104
105
CD45
×103
FSC-A 250
200
−102 0 102
×103
105
CD29− CD90+
2%
91%
105
CD29+ CD90+
70% CD73
CD90
SSC-A
0 50
25%
−103
−304
3% CD29+ CD90−
−2.303 CD29 − CD90 −
M −102 0 102
103
104
105
−102 0 102
−1.639
103
104
105
103
102 0
CD73 − CD105+
−537
CD73+ CD105+
105
5% CD73− CD105+
CD73− CD105− −103 −1.806
0
103
104
CD29 − CD90 +
CD29+ CD90+
99%
59%
7%
105
CD105
1%
104
104
CD90
CD73
4%
−102
CD29
CD34 105
85%
104
103
100
CD73+ CD105+
6%
104 150
CD73 + CD105 −
103
102 0
102 0
29%
−102 −537
5% CD73 − CD105+
CD73 − CD105 − −103 −1.806
0
103
104
CD105
105
−102
0%
−2.201
CD29 − CD90 −
M
2 2 −1.494 −10 0 10
0% CD29+ CD90− 103
104
105
CD29
Figure 2: The Cell analysis strategy allows the isolation of 4 different cell populations. Cells were stained with mouse anti human CD45Amcyan, CD34-FITC, CD29-APC-CY7, CD90-AF700, CD73-PE, CD105-AF647. After FSC-A/SSC-A selection, only CD45− and CD34− cells were considered. CD73, CD105, CD90, and CD29 profiles were then analyzed. CD73+ CD105+ cells were more than 85% to 98% positive for CD90 and CD29 (lower panel). However, CD90+ CD29+ represented a more heterogenous population when looking at CD73, CD105 stainings. We defined different cell populations based on CD90 and CD29 subpopulation: CD90+ CD29+ ; CD90− CD29+ ; CD90+ CD29− ; CD90− CD29− (middle panel).
accessibility of these tissues will allow constituting clinically relevant banking program. In this study, we have isolated MSCs from placenta and fetal membrane using very simple isolation technique with the same great purity yield (more than 95%) than initial FACS sorting methods [53]. Moreover, no difference was found between different MSCs subpopulation of placenta and membrane considering phenotypic characteristics, growth kinetic, markers expression, differentiation assays, and transcriptomic profile. This suggests the plasticity of certain MSC markers. We indeed illustrate that the surface markers used for MSCs cell sorting have limited interest in fetal mesenchymal stem cell tissues isolation. We demonstrate that the yield of MSCs retrieval is 6–8 fold superior
in the fetal membranes than in placenta. In addition, others already demonstrated through cytogenetic analysis that placenta-derived MSCs maintained a normal karyotype for 30–40 passages in vitro [54]. Indeed, we demonstrate that the Mb/Pl MSCs retain even at high number of passages significantly better proliferation ability than BM-MSCs. We finally demonstrate that these fetal MSC share close transcriptomic profiles with BM-MSC. Currently, bone morphogenetic protein-2 and -7 (BMP2 and -7) are the only biologic modifiers that have received the United States Food and Drug Administration (US-FDA) approval for clinical applications in orthopedic surgery. The BMPs low biologic activity is demonstrated by the doses of tens of milligrams of commercial BMP-2- and -7-containing
8
Stem Cells International
BM-MSCs Osteodifferentiation
BM-MSCs Adipodifferentiation
Pl/Mb-MSCs Osteodifferentiation
Pl/Mb-MSCs Adipodifferentiation
Differentiation
a
c
e
g
Control
b
d
f
h
(a) 20000 G-CSF
GRO
18000
IL6 IL8 MCP-1 MIF Rante
14000
s Pixel density GRO
MCP-1 MIF
8000
C+ IL6 IL8
6000 4000
Serpin E1
0 (b)
sTREM-1
2000
C+
Serpi E1
BM-MSC
10000
MCP-1
C+
12000
IL-6
C+
16000
Serpin E1
GRO
Mb-MSC
G-CSF
C+
C+
Cytokines BM-MSC Mb-MSC (c)
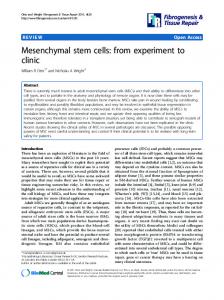
Figure 3: Differentiation assay of Pl/Mb-MSCs in comparison to BM-MSCs and cytokines expression. (a) Representative differentiation of Pl/Mb-MSCs passage 4 is shown. Cells were kept in induction medium (differentiation) or control standard medium (control). (a–d) Osteogenic and adipocyte differentiation and control for BM-MSCs. (f–h) Osteogenic and adipocyte differentiation and control for MbMSCs. (b) Cytokine expressions of Mb-MSCs and BM-MSCs using the proteome profiler. (c) Quantification of cytokine optical density. Measurements were obtained with image J software (NIH).
PC no. 3 9.91%
PC no. 3 12.2%
PC no. 2
.8% PC no. 2 12
PC no. 3 12.2%
14.2%
9
PC no. 2 14.9%
Stem Cells International
PC no . 1 14
.7%
PC no. 1 20.9%
BM-MSC Mb-MSC Pl-MSC
PC no. 1
Pl−MSC CD90+ CD29− Pl−MSC CD90+ CD29+ Pl−MSC directly plated
Mb−MSC CD90+ CD29− Mb−MSC CD90+ CD29+ Mb−MSC CD90− CD29+ Mb−MSC directly plated (a)
17%
(b)
(c) STC1∗
GJA1 VEGFA HGF
IGFBP4
Collagen
PTGS2
CTGF IL6 BMP GREM1∗ OSR2
Twist1 SMAD6∗
HTR2B ZNF423 BGN∗ PITX2 PRRX2 (d)
(e)
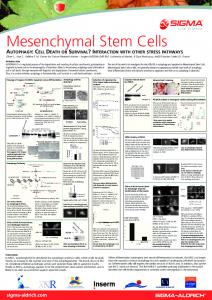
Figure 4: PCA representation of transcriptomic comparison of Pl-MSCs, Mb-MSCs and BM-MSCs and ingenuity pathways analysis. (a) Mb-MSCs (red) and Pl-MSCs (green) are overlapping clearly indicating the impossibility to differentiate these MSCs at a transcriptional level. They can clearly be differentiated from bone marrow MSCs (blue). (b) The PCA overlapping between every cell sorted sub-population from membrane (CD29+ CD90+ red; CD29− CD90+ blue; CD90− CD29+ green) or nonsorted cells (Mb-MSCs purple) indicate the impossibility to discriminate the different MSCs subpopulation at a transcriptional level. (c) PCA of different MSC subpopulation from placenta (CD29+ CD90+ red; CD29− CD90+ blue) or directly isolated cells (Pl-MSCs blue) indicate the impossibility to discriminate these MSCs subpopulation at a transcriptional level. (d) Ingenuity pathway analysis was able to define enriched pathways implicated in embryonic morphogenesis and organ development in fetal MSCs compared to BM-MSCs. (e) Ingenuity pathway analysis using organ formation and osteoblast differentiation molecular network shows an enrichment in proosteogenic genes in fetal MSCs compared to BM-MSCs.
10
Stem Cells International
Pl-MSC D21
BM-MSC
−OA
+OA
Negative control
(a) ∗∗ ∗∗
60 50 40 30 20 10 0 Diff media
Diff media + OA Negative control
− 10
BM-MSC Pl-MSC (b)
Figure 5: Osteoactivin trigger increased osteogenic differentiation in human fetal and bone marrow MSCs. (a) Illustration of increased osteogenic differentiation with OA compared to control (without OA) after 21 days in Mb-MSCs and BM-MSCs. (b) Quantification of osteogenic differentiation with or without Osteoactivin (∗∗ P < 0.05).
products, whereas BMPs concentrations in vivo are around several micrograms per kilogram of bone [55, 56]. BMP therapeutic doses in preclinical and clinical trials varied by factors up to 100 folds, demonstrating low consistency on bone repair [57]. Noteworthy, we have characterized the mesenchymal stem cells by the criteria used by the ISCT [33]. We would like to point a limitation emphasized by the plasticity of the phenotypic markers. First, the true stemness ablity (selfrenewal) of our MSCs was not demonstrated and should be further documented in studies looking at clonality of the cell lines. Therefore, while they have a real ability to differentiate in different lineage, it is impossible to say if a single cell can indeed differentiate in different lineages. Moreover, the role of this cell types in vivo remains still not clearly define by lack of specific targeting of the mesenchymal stem cells.
We recently demonstrated that OA acts downstream of BMP-2, and our results indicate that OA may have similar osteoinductive effects to BMP-2 in mice. We investigated the response of fetal MSCs to OA as compared to BM-MSCs. We demonstrate that OA can induce osteogenic differentiation in human MSCs. More interestingly, fetal-derived MSCs display better response to OA than BM-MSCs. We finally demonstrate that OA can also be used as a complement for osteogenic-induced differentiation with fetal MSCs. Finally, in accordance with the literature, we document that the induction of osteogenic differentiation following OA stimulation involved ERK1/2 pathway activation. Considering that MSCs are way more abundant in membrane compared to placenta, we, therefore, stand that fetal membranes could be used to build MSCs banking
Stem Cells International
11 Pl-MSC 6
9
C 10
Pl-MSC + OA
7 8
C C 9 1 10 2
4
C C 9 1 10 2
6 4
7 8
3 11
BM-MSC 6
BM-MSC + OA
CC 9 4 1 10 2
7 8
5
7 8
C 1 2
4
3
3 11
6
11
5
3 11
5
5
1:p38; 2:ERK1/2; 3:JNKpan; 4:MSK1/2; 5:Akt; 6:CREB; 7:HSP27; 8:Src; 9:Fyn; 10:Chk2; 11:STAT5a/b (a)
Phosphokinase array
15000 13000
Level of intensity (AU)
11000 9000 7000 5000 3000
STAT5a/b
Chk-2
Fyn
Src
HSP27
CREB
Akt
MSK1/2
JNK pan
ERK1/2
− 1000
P38
1000
Phosphoproteins Pl-MSC Pl-MSC + OA BM-MSC BM-MSC + OA (b)
Figure 6: Phosphokinase array analysis 4 h after osteoactivin stimulation. After 4 h of OA stimulation, cells were harvested and protein extracts analyzed with the human Phosphokinase array from R&D system. (a) Phosphokinase profile in Pl-MSCs and BM-MSCs using the proteome profiler. (b) Quantification of phosphokinase optical density. Measurements were obtained with image J software (NIH). ERK2 is activated in placental MSCs when submitted to osteoactivin stimulation.
program in order to meet clinical threshold in bone fracture reparation. Isolation of Mb-MSCs through selective culture in DMEM-low glucose supplemented with 20% serum and antibiotics seems to be the most efficient process. This process is very adapted for automation compatible with large cell banking programs. Moreover, the increased capacity of response to osteogenic differentiation upon osteoactivin treatment prompts us to study the role of fetal membrane MSCs in experimental preclinical model of bone regeneration. Indeed, critical animal studies would be necessary to determine how MSCs
are recruited and survive at the fracture site, their repair effectiveness, and the mechanisms through which they exert their actions.
Funding This work was funded by Qatar Foundation NPRP Grant 08-663—3-140 and NPRP 09-1099-3-279 Qatar Foundation UREP Grant 06-116-1-023, Qatar Foundation, Qatar Technology Transfer Grant.
12
Stem Cells International
References [1] G. Brooke, M. Cook, C. Blair et al., “Therapeutic applications of mesenchymal stromal cells,” Seminars in Cell and Developmental Biology, vol. 18, no. 6, pp. 846–858, 2007. [2] S. E. Haynesworth, J. Goshima, V. M. Goldberg, and A. I. Caplan, “Characterization of cells with osteogenic potential from human marrow,” Bone, vol. 13, no. 1, pp. 81–88, 1992. [3] W. A. Noort, A. B. Kruisselbrink, P. S. In’t Anker et al., “Mesenchymal stem cells promote engraftment of human umbilical cord blood-derived CD34+ cells in NOD/SCID mice,” Experimental Hematology, vol. 30, no. 8, pp. 870–878, 2002. [4] M. F. Pittenger, A. M. Mackay, S. C. Beck et al., “Multilineage potential of adult human mesenchymal stem cells,” Science, vol. 284, no. 5411, pp. 143–147, 1999. [5] L. R. Zhao, W. M. Duan, M. Reyes, C. D. Keene, C. M. Verfaillie, and W. C. Low, “Human bone marrow stem cells exhibit neural phenotypes and ameliorate neurological deficits after grafting into the ischemic brain of rats,” Experimental Neurology, vol. 174, no. 1, pp. 11–20, 2002. [6] D. Orlic, J. Kajstura, S. Chimenti et al., “Mobilized bone marrow cells repair the infarcted heart, improving function and survival,” Proceedings of the National Academy of Sciences of the United States of America, vol. 98, no. 18, pp. 10344– 10349, 2001. [7] B. Fang, M. Shi, L. Liao, S. Yang, Y. Liu, and R. C. Zhao, “Systemic infusion of FLK1+ mesenchymal stem cells ameliorate carbon tetrachloride-induced liver fibrosis in mice,” Transplantation, vol. 78, no. 1, pp. 83–88, 2004. [8] J. M. Murphy, D. J. Fink, E. B. Hunziker, and F. P. Barry, “Stem cell therapy in a Caprine model of osteoarthritis,” Arthritis and Rheumatism, vol. 48, no. 12, pp. 3464–3474, 2003. [9] M. K. Majumdar, M. Keane-Moore, D. Buyaner et al., “Characterization and functionality of cell surface molecules on human mesenchymal stem cells,” Journal of Biomedical Science, vol. 10, no. 2, pp. 228–241, 2003. [10] B. Fang, Y. P. Song, L. M. Liao, Q. Han, and R. C. Zhao, “Treatment of severe therapy-resistant acute graft-versus-host disease with human adipose tissue-derived mesenchymal stem cells,” Bone Marrow Transplantation, vol. 38, no. 5, pp. 389– 390, 2006. [11] P. S. In ’t Anker, W. A. Noort, S. A. Scherjon et al., “Mesenchymal stem cells in human second-trimester bone marrow, liver, lung, and spleen exhibit a similar immunophenotype but a heterogeneous multilineage differentiation potential,” Haematologica, vol. 88, no. 8, pp. 845–852, 2003. [12] K. Le Blanc, C. G¨otherstr¨om, O. Ringd´en et al., “Fetal mesenchymal stem-cell engraftment in bone after in utero transplantation in a patient with severe osteogenesis imperfecta,” Transplantation, vol. 79, no. 11, pp. 1607–1614, 2005. [13] G. K¨ogler, S. Sensken, J. A. Airey et al., “A new human somatic stem cell from placental cord blood with intrinsic pluripotent differentiation potential,” Journal of Experimental Medicine, vol. 200, no. 2, pp. 123–135, 2004. [14] O. V. Semenov, S. Koestenbauer, M. Riegel et al., “Multipotent mesenchymal stem cells from human placenta: critical parameters for isolation and maintenance of stemness after isolation,” American Journal of Obstetrics and Gynecology, vol. 202, no. 2, pp. 193-e1–193-e13, 2010. [15] G. G. Wulf, V. Viereck, B. Hemmerlein et al., “Mesengenic progenitor cells derived from human placenta,” Tissue Engineering, vol. 10, no. 7-8, pp. 1136–1147, 2004. [16] S. Barlow, G. Brooke, K. Chatterjee et al., “Comparison of human placenta- and bone marrow-derived multipotent
[17]
[18]
[19]
[20]
[21]
[22]
[23]
[24]
[25]
[26]
[27]
[28]
[29]
[30]
[31]
mesenchymal stem cells,” Stem Cells and Development, vol. 17, no. 6, pp. 1095–1107, 2008. M. Bailo, M. Soncini, E. Vertua et al., “Engraftment potential of human amnion and chorion cells derived from term placenta,” Transplantation, vol. 78, no. 10, pp. 1439–1448, 2004. C. L. Insausti, M. Blanquer, P. Bleda et al., “The amniotic membrane as a source of stem cells,” Histology and Histopathology, vol. 25, no. 1, pp. 91–98, 2010. P. De Coppi, G. Bartsch, M. M. Siddiqui et al., “Isolation of amniotic stem cell lines with potential for therapy,” Nature Biotechnology, vol. 25, no. 1, pp. 100–106, 2007. H. Abe, H. Uto, Y. Takami et al., “Transgenic expression of osteoactivin in the liver attenuates hepatic fibrosis in rats,” Biochemical and Biophysical Research Communications, vol. 356, no. 3, pp. 610–615, 2007. G. Anderson, M. Gries, N. Kurihara et al., “Thalidomide derivative CC-4047 inhibits osteoclast formation by downregulation of PU.1,” Blood, vol. 107, no. 8, pp. 3098–3105, 2006. H. C. Anderson, P. R. Reynolds, H. H. T. Hsu et al., “Selective synthesis of bone morphogenetic proteins-1, -3, -4 and bone sialoprotein may be important for osteoinduction by Saos-2 cells,” Journal of Bone and Mineral Metabolism, vol. 20, no. 2, pp. 73–82, 2002. P. Boissy, T. L. Andersen, B. M. Abdallah, M. Kassem, T. Plesner, and J. M. Delaiss´e, “Resveratrol inhibits myeloma cell growth, prevents osteoclast formation, and promotes osteoblast differentiation,” Cancer Research, vol. 65, no. 21, pp. 9943–9952, 2005. A. Helip-Wooley, W. Westbroek, H. M. Dorward et al., “Improper trafficking of melanocyte-specific proteins in Hermansky-Pudlak syndrome type-5,” Journal of Investigative Dermatology, vol. 127, no. 6, pp. 1471–1478, 2007. T. Hoashi, J. Muller, W. D. Vieira et al., “The repeat domain of the melanosomal matrix protein PMEL17/GP100 is required for the formation of organellar fibers,” Journal of Biological Chemistry, vol. 281, no. 30, pp. 21198–21208, 2006. A. Nakamura, A. Ishii, C. Ohata, and T. Komurasaki, “Early induction of osteoactivin expression in rat renal tubular epithelial cells after unilateral ureteral obstruction,” Experimental and Toxicologic Pathology, vol. 59, no. 1, pp. 53–59, 2007. T. Ogawa, T. Nikawa, H. Furochi et al., “Osteoactivin upregulates expression of MMP-3 and MMP-9 in fibroblasts infiltrated into denervated skeletal muscle in mice,” American Journal of Physiology—Cell Physiology, vol. 289, no. 3, pp. C697–C707, 2005. M. Onaga, A. Ido, S. Hasuike et al., “Osteoactivin expressed during cirrhosis development in rats fed a choline-deficient, L-amino acid-defined diet, accelerates motility of hepatoma cells,” Journal of Hepatology, vol. 39, no. 5, pp. 779–785, 2003. F. F. Safadi, J. Xu, S. L. Smock, M. C. Rico, T. A. Owen, and S. N. Popoff, “Cloning and characterization of osteoactivin, a novel cDNA expressed in osteoblasts,” Journal of Cellular Biochemistry, vol. 84, no. 1, pp. 12–26, 2001. T. A. Owen, S. L. Smock, S. Prakash et al., “Identification and characterization of the genes encoding human and mouse osteoactivin,” Critical Reviews in Eukaryotic Gene Expression, vol. 13, no. 2-4, pp. 205–220, 2003. S. M. Abdelmagid, M. F. Barbe, I. Arango-Hisijara, T. A. Owen, S. N. Popoff, and F. F. Safadi, “Osteoactivin acts as downstream mediator of BMP-2 effects on osteoblast function,” Journal of Cellular Physiology, vol. 210, no. 1, pp. 26–37, 2007.
Stem Cells International [32] S. M. Abdelmagid, M. F. Barbe, M. C. Rico et al., “Osteoactivin, an anabolic factor that regulates osteoblast differentiation and function,” Experimental Cell Research, vol. 314, no. 13, pp. 2334–2351, 2008. [33] M. Dominici, K. Le Blanc, I. Mueller et al., “Minimal criteria for defining multipotent mesenchymal stromal cells. The International Society for Cellular Therapy position statement,” Cytotherapy, vol. 8, no. 4, pp. 315–317, 2006. [34] S. P. Perfetto, P. K. Chattopadhyay, and M. Roederer, “Seventeen-colour flow cytometry: unravelling the immune system,” Nature Reviews Immunology, vol. 4, no. 8, pp. 648–655, 2004. [35] A. Erices, P. Conget, and J. J. Minguell, “Mesenchymal progenitor cells in human umbilical cord blood,” British Journal of Haematology, vol. 109, no. 1, pp. 235–242, 2000. [36] E. H. Javazon, D. C. Colter, E. J. Schwarz, and D. J. Prockop, “Rat marrow stromal cells are more sensitive to plating density and expand more rapidly from single-cell-derived colonies than human marrow stromal cells,” Stem Cells, vol. 19, no. 3, pp. 219–225, 2001. [37] G. Dennis Jr., B. T. Sherman, D. A. Hosack et al., “DAVID: database for annotation, visualization, and integrated discovery,” Genome Biology, vol. 4, no. 5, p. P3, 2003. [38] J. H. Hwang, S. S. Shim, O. S. Seok et al., “Comparison of cytokine expression in mesenchymal stem cells from human placenta, cord blood, and bone marrow,” Journal of Korean Medical Science, vol. 24, no. 4, pp. 547–554, 2009. [39] C. M. Kolf, E. Cho, and R. S. Tuan, “Mesenchymal stromal cells. Biology of adult mesenchymal stem cells: regulation of niche, self-renewal and differentiation,” Arthritis Research and Therapy, vol. 9, no. 1, article no. 204, 2007. [40] H. Furochi, S. Tamura, M. Mameoka et al., “Osteoactivin fragments produced by ectodomain shedding induce MMP3 expression via ERK pathway in mouse NIH-3T3 fibroblasts,” FEBS Letters, vol. 581, no. 30, pp. 5743–5750, 2007. [41] Y. Jiang, B. N. Jahagirdar, R. L. Reinhardt et al., “Pluripotency of mesenchymal stem cells derived from adult marrow,” Nature, vol. 418, no. 6893, pp. 41–49, 2002. [42] M. Angelopoulou, E. Novelli, J. E. Grove et al., “Cotransplantation of human mesenchymal stem cells enhances human myelopoiesis and megakaryocytopoiesis in NOD/SCID mice,” Experimental Hematology, vol. 31, no. 5, pp. 413–420, 2003. [43] M. H. Frank and M. H. Sayegh, “Immunomodulatory functions of mesenchymal stem cells,” Lancet, vol. 363, no. 9419, pp. 1411–1412, 2004. [44] K. Le Blanc, I. Rasmusson, B. Sundberg et al., “Treatment of severe acute graft-versus-host disease with third party haploidentical mesenchymal stem cells,” Lancet, vol. 363, no. 9419, pp. 1439–1441, 2004. ´ J. A. Weis, M. I. Miga et al., “Regenerative [45] F. Granero-Molto, effects of transplanted mesenchymal stem cells in fracture healing,” Stem Cells, vol. 27, no. 8, pp. 1887–1898, 2009. [46] M. Marcacci, E. Kon, V. Moukhachev et al., “Stem cells associated with macroporous bioceramics for long bone repair: 6To 7-year outcome of a pilot clinical study,” Tissue Engineering, vol. 13, no. 5, pp. 947–955, 2007. [47] G. Liu, L. Zhao, W. Zhang, L. Cui, W. Liu, and Y. Cao, “Repair of goat tibial defects with bone marrow stromal cells and βtricalcium phosphate,” Journal of Materials Science: Materials in Medicine, vol. 19, no. 6, pp. 2367–2376, 2008. [48] P. Hernigou, G. Mathieu, A. Poignard, O. Manicom, F. Beaujean, and H. Rouard, “Percutaneous autologous bone-marrow grafting for nonunions. Surgical technique,” The Journal of Bone and Joint Surgery. American Volume, vol. 88, supplement 1, part 2, pp. 322–327, 2006.
13 [49] P. Hernigou, A. Poignard, F. Beaujean, and H. Rouard, “Percutaneous autologous bone-marrow grafting for nonunions: influence of the number and concentration of progenitor cells,” Journal of Bone and Joint Surgery. Series A, vol. 87, no. 7, pp. 1430–1437, 2005. [50] P. Hernigou, A. Poignard, O. Manicom, G. Mathieu, and H. Rourd, “The use of percutaneous autologous bone marrow transplantation in nonunion and avascular necrosis of bone,” Journal of Bone and Joint Surgery - Series B, vol. 87, no. 7, pp. 896–902, 2005. [51] M. S. Rao and M. P. Mattson, “Stem cells and aging: expanding the possibilities,” Mechanisms of Ageing and Development, vol. 122, no. 7, pp. 713–734, 2001. [52] F. P. Barry and J. M. Murphy, “Mesenchymal stem cells: clinical applications and biological characterization,” International Journal of Biochemistry and Cell Biology, vol. 36, no. 4, pp. 568– 584, 2004. [53] T. Tondreau, N. Meuleman, A. Delforge et al., “Mesenchymal stem cells derived from CD133-positive cells in mobilized peripheral blood and cord blood: proliferation, Oct4 expression, and plasticity,” Stem Cells, vol. 23, no. 8, pp. 1105–1112, 2005. [54] M. F. Pera, “Unnatural selection of cultured human ES cells?” Nature Biotechnology, vol. 22, no. 1, pp. 42–43, 2004. [55] A. Aono, M. Hazama, K. Notoya et al., “Potent ectopic bone-inducing activity of bone morphogenetic protein- 4-7 heterodimer,” Biochemical and Biophysical Research Communications, vol. 210, no. 3, pp. 670–677, 1995. [56] H. Mizutani and M. R. Urist, “The nature of bone morphogenetic protein (BMP) fractions derived from bovine bone matrix gelatin,” Clinical Orthopaedics and Related Research, vol. 171, pp. 213–223, 1982. [57] A. J. Salgado, M. E. Gomes, O. P. Coutinho, and R. L. Reis, “Isolation and osteogenic differentiation of bone-marrow progenitor cells for application in tissue engineering,” Methods in Molecular Biology, vol. 238, pp. 123–130, 2004.