Six balls(basketball, volleyball, soccer ball, ... in order of compressibility is: basketball d = 3.07v, ..... 3 Northrip JW, Logan GA, McKinney WC. ... 5 Broer MR.
Br J Sp Med 1991; 25(1)
A formula for comparison of selected sport ball compressibility Linus J. Dowell MD and Gary Krebs Department of Health and Physical Education, Texas A&M University, Texas, USA
The purpose of this study was to develop a formula to determine and compare the compressibility of selected sport balls. Six balls (basketball, volleyball, soccer ball, baseball, handball, golf ball) were dropped ten times from each of four different heights onto a smooth solid surface overlaid with a white sheet of typing paper, overlaid with a sheet of carbon paper. The diameter of the area of contact of each ball imprinted onto the typing paper was measured in millimetres with calipers. From the data, the distance (d) that each ball compressed for each velocity (v) was calculated. It was found that a linear relationship existed between velocity at impact and the distance for each ball studied. The compressibility coefficient (c) for each ball was calculated and a formula was developed to determine the distance each ball would compress at a given velocity. When velocity is measured in metres per second and the distance a ball compresses is measured in millimetres, the formula to determine d for selected balls, in order of compressibility is: basketball d = 3.07v, volleyball d = 2.90v, soccer ball d = 2.80v, baseball d = 0.77v, handball d = 0.53v, and golf ball d = O.17v.
Keywords: Biomechanics, compressibility, balls, velocity, formula
The compressibility of a ball affects many aspects of performance which is of interest to physical educators. Compressibility to some extent affects how a ball will rebound from a surface but more important than this is the force exerted on the surface. The greater the distance over which force is dissipated the less the force of impact (Fd = ½/2mz2, where F = force, d = distance, m = mass and v = velocity). The compressibility of a ball is related to the distance through which a ball compresses on contact with surface, i.e. the deformation of the ball. The greater the deformation at a given velocity the greater the
compressibility. Historical background Luttgens and Wells' indicated that when objects come in contact with each other some distortion or Address for correspondence: Dr Linus J. Dowell, Department of Health and Physical Education, Texas A&M University, College of Education, College Station, Texas 77843-4243, USA (© 1991 Butterworth-Heinemann Ltd. 0306-3674/91/010034-04
34 Br J Sp Med 1991; 25(1)
deformation occurs. The force that acts on an object to distort it is called stress. The distortion that occurs is called strain and is porportional to the stress causing it. Stress may take the form of compression as in the squeezing of a tennis ball. Piscopo and Baley2 stated that when an object strikes a contact surface, a certain amount of depression or distortion takes place on the impacted surface, e.g. the depression or flattening of a tennis ball as it contacts the strings of a racket. Northrip, Logan and McKinney3 stated: During a collision involving an elastic object such as a tennis ball, the kinetic energy that a ball possesses before the collision is stored as elastic potential energy in the deformation of the ball. The relationship between forces or energies in an elastic deformation and the actual distance of body deformation is called compressibility. An object with high compressibility shows very little 'give' in response to extremely large forces. It should be emphasized here that virtually all sport objects are to a certain extent compressible. Probably the least compressible object in sport is the billiard ball.... Because all objects during collision are compressed somewhat and rebound to their original shape, there is a definite time associated with collision. A greater amount of compression results in a longer time of contact. This contributes to a lower average force used to impart a given change in momentum. A greater or lesser time of collision may substantially affect a performer's action in striking something. Bunn4 stated that in a placed kick the football depresses by about one-third, while the tennis ball that is hard driven may depress by about one-half; even the golf ball shows a surprising amount of distortion on impact with the club head. Broer5 indicated that a ball that is dropped vertically has the entire bottom of the ball depressed, making the force of rebound the same from all parts of the bottom of the ball and it bounces straight up; while a ball that approaches at an angle to the floor depresses the back of the bottom of the ball more than the front and the rebound force throws the ball forward and upward. Jensen and Schultz6 stated: A softball is harder to compress and has less elasticity than a tennis ball; therefore, a softball has
A formula for comparison of selected sport ball compressibility: L. J. Dowell and G. Krebs
less rebound ability. Both a handball and a golf ball are more difficult to compress. If the two balls were dropped from the same height (shoulder height) onto the same surface, the handball's rebound would exceed that of the golf ball. The reason is that the impact would be insufficient to produce enough compression of the golf ball to allow its elastic quality to function. When struck hard with a golf club, the golf ball compresses a considerable amount, thus allowing the elastic quality to function. As a result, the golf ball responds better than a handball to the impact of the club. A basketball with insufficient air will compress easily when bounced, but lack of air pressure within causes the ball to have little elasticity; therefore, its rebound ability is poor. When properly inflated, the ball is more difficult to compress, but it has increased elasticity and thus rebounds farther. Scott7 agrees that the baseball, hockey ball and golf ball are relatively firm yet the fast action camera shows that the flattening of these balls are very pronounced when hit forcefull. Softer balls show greater amounts of compression. Hay and Reid8 suggest that because of the large numbers of physical education and athletic activities that involve the impact of one body with another, it is highly desirable that physical education teachers and coaches have a good understanding of the factors that govern the results of such impacts. Several researchers have studied the impact of soccer balls and resulting injury. Schneider9, Smodlaka 0, Tsvaer and Storlil , Verdaguer 2, Burke et al.13 and Sandyk'4 reported that the potential harmful consequence of head injuries occurs in soccer. Some of the authors reported retinal detachments due to the impact of soccer balls. Others reported eye injuries as well as migraine headaches. Kross, Ohler, and Barolin'5 studied electroencephalographic (EEG) film of players heading a soccer ball and concluded that cerebral damage cannot be assumed in general although predisposed persons may have microtrauma and subclinical cerebral dysfunction caused by heading. Tsyvaer'6 described a case of a cervical disc herniation occurring in a soccer player who headed the ball in the wrong manner. Levendusky et al.17 studied the impact characteristics of two types of soccer balls and concluded that ball construction influences the characteristics of impact that have been associated with injuries. Townend18, in a report given at Liverpool, England, concluded that the magnitude of the impulsive blow to the head due to the heading action in soccer is approximately one order of magnitude less than that reported in boxing, so heading in soccer is not a dangerous activity. The characteristics of impact, associated with head injury have been well documented for several sports. Studies of impact with sports equipment have included cycling helmets19, American football helmets20 and boxing and karate gloves21' 1. The compression of a ball affects its many characteristics, e.g. force of impact, elasticity of the ball, restitution of the ball, angle of rebound, time of contact with an implement or surface, etc. Therefore
it is important for physical educators to quantify the compression of balls used in physical education. Because of the scarcity of the literature on the compression of balls used in physical education and the importance of understanding the physics of impact in physical education this study determined the extent of depression taking place in selected balls when velocity at impact was known. This is important since Fd = 1/2 mz'2. That is, the greater the depression (d) of a ball the less the force (F) at impact when all other factors are equal.
Statement of the problem It was the purpose of this study to determine and compare the compressibility of selected balls. Specifically, the purpose was to develop a formula to determine the compressibility of a baseball, basketball, golf ball, handball, soccer ball and volleyball contacting a hard surface at four selected velocities; and to use this formula to compare these balls.
Method Six balls (baseball, basketball, golf ball, handball, soccer ball, and volleyball) were dropped from four different heights (0.6, 1.2, 1.8 and 2.4m; 2, 4, 6 and 8 ft) onto a smooth solid surface. A piece of paper was placed on the surface at the contact point, overlaid with carbon paper. The diameter of the area imprinted was measured with calipers. Each ball was dropped 10 times from each of the four heights for a total of 240 ball imprints. The volleyball did not make a dark enough imprint at the 0.6 m (2ft) level at 3.45 m/s velocity to distinguish diameter, so only three velocities were included for the volleyball. A mean diameter for each ball from each height was determined. The compression of each ball was determined for each height from the radius of the imprint at impact. The compression of the ball, or distance compressed (d) was determined by the
formula: d = R- R2 _ r2 where R is the radius of the ball and r is the radius of the impression or imprint of the ball on the paper, i.e. contact of ball surface.
Results and discussion Means of diameter of ball imprints, standard deviations, and distance (d) selected inflated balls compress are shown in Table 1. It may be seen that the basketball dissipated its force of impact through a greater distance at each of the four velocities than the other balls selected. The volleyball did not make an imprint dark enough to distinguish the area of contact at the 0.6 m (2ft) distance so data at the 3.45m/s velocity is vacant. It may also be seen that area of contact with the surface was greater for the basketball than the other balls since the diameter of the imprint was greatest. Since d is greater for the basketball than the soccer ball and volleyball, the coefficient of compressibility is greater for the basketball than for the soccer ball or volleyball. Br J Sp Med 1991; 25(1) 35
A formula for comparison of selected sport ball compressibility: L. J. Dowell and G. Krebs Table 2. Comparison of compressibility of selected compact balls
Table 1. Comparison of compressibility of selected inflated balls Ball (diameter)
Velocity (mWs)
Imprint*
3.45
Volleyball (203.2 mm) Soccer ball (215.9 mm) Basketball (241.3 mm)
5.97
4.88
Ball (diameter) 6.90
120.5 113.5 103.9 (2.99) (1.79) (2.18) 19.79 17.32 14.29 88.5 105.8 115.4 123.1 (0.88) (1.48) (1.18) (1.25) 16.71 19.27 9.49 13.85 137.3 127.4 96.8 117.1 (1.08) (0.95) (1.24) (2.84) 10.13 15.16 18.19 21.44
mean (s.d.) d mean (s.d.) d mean (s.d.) d
Golf (41.275 mm) Handball (45.976 mm)
Baseball (69.85 mm)
Velocity (m/s)
Imprint*
mean (s.d.) d mean (s.d.) d mean (s.d.) d
3.45
4.88
5.97
6.90
9.9 (0.23) 0.602 16.8 (0.23) 1.59 27.6 (0.72) 2.84
11.5 (0.39) 0.817 20.8 (0.40) 2.49 32.2 (0.64) 3.93
12.4 (0.18) 0.953 23.9 (0.44) 3.25 33.9 (0.80) 4.39
13.4 (0.26) 1.120 25.5 (0.34) 3.86 36.5 (1.31) 5.15
* All measurements are diameters in millimetres and are the mean of ten readings; for calculation of d, see text
* Measurements are diameters in millimetres and are the mean of ten readings; for calculation of d, see text
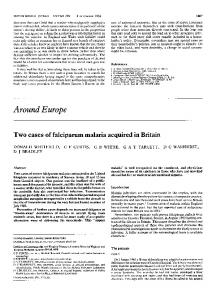
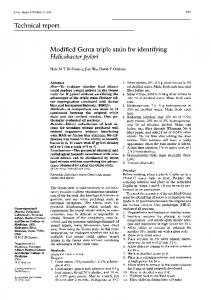
The final velocity at impact and distance each ball compressed are shown in Figure 1. It may be seen in the graph that there is a linear relationship between velocity at impact and the distance through which each ball is compressed. The slope of the graph of distance compressed by the basketball is greater than the soccer ball or volleyball. In order to determine the slope of the graph for each ball, the mean distance (d) for all trials was divided by the mean velocity for all trials. Since the graph takes the form y = bx, where b is the slope of the line, the formula for the graph for each ball becomes d = cv, where d is the distance through which the ball compressed, v is the velocity of the ball at contact, and c is a constant for each ball (coefficient of compressibility), i.e. slope of the graph. If d is measured in millimetres (mm) and velocity (v) is measured in metres per second (m/s), the formulae for determining the distance the ball will compress for each of the inflated balls studied are as follows: Basketball d = 3.07v Volleyball d = 2.90 v Soccer ball d = 2.80v
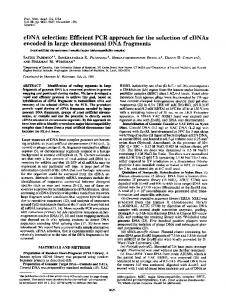
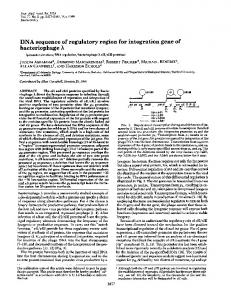
It must be noted that at the velocities studied there was a linear relationship between the distance d and velocity. This was not necessarily expected. One would expect that as air pressure due to impact increased, d would not have a linear increase but one that is curvilinear. One would expect the deceleration of the ball to increase as d increased, so that d would increase very slowly as compression increased. However, at the velocities studied there was a linear relationship between velocity and compression. Means of diameter of ball imprints, standard deviations and compression distance d of selected compact balls are shown in Table 2. It may be seen that the baseball at all four velocities had the greatest compression, followed by the handball and the golf ball which had the least compressibility. The graph (Figure 2) shows the distance each ball compressed with velocity at impact, and it may be seen that again a linear relationship exists between compression and velocity at the velocities studied. The graph of each ball is linear with its origin at 0.0. Since the baseball has the highest level of compressibility, the slope of the graph is greatest; while the compressibility of the
8
25 20 E E
6
15
E E
4
E
E0
10
2
4
6
8
Velocity (m/s)
Figure 1. Comparison of compressibility of selected inflated balls, showing the distance compressed (d) at various velocities. *, volleyball; A, soccer ball; *, basketball 36 Br J Sp Med 1991; 25(1)
2
4
6
8
Velocity (m/s)
Figure 2. Comparison of compressibility of selected compact balls, showing the distance compressed (d) at various velocities. *, golf ball; A, handball; *, baseball
A formula for comparison of selected sport ball compressibility: L. J. Dowell and G. Krebs
golf ball is least and the slope is least. Using the same formula as before (d = cv) the compact balls give the following compression figures: Baseball d = 0.77v Handball d = 0.53 v Golf ball d = 0.17v Thus the compression of each ball varies directly as velocity, i.e. the greater the velocity the greater the distance (d) the force is dissipated. If the six balls were placed in order of compressibility (c = dlv) the order shown in Table 3 was found. In general, the softer the ball, the greater the coefficient of compressibility and the less the force of impact - other factors being equal, e.g. mass, velocity, etc. Table 3. Compression coefficient of selected balls Ball
Coefficient of compressibility
following descending order of magnitude: basketball, volleyball, soccer ball, baseball, handball, and golf ball. References 1 2 3 4
5
6 7
8 9
Basketball Volleyball Soccer ball Baseball Handball Golf ball
3.07 2.90 2.80 0.77 0.53 0.17
10 11 12
13
Conclusions
14
The purpose of this study was to develop a formula to determine and compare the compressibility of selected balls. Three inflated balls and three compact balls used in physical education were studied at four impact velocities. Within the limitations of this study it was concluded that: 1 At slow velocities, compressibility of balls used in physical education varies directly with velocity at impact. 2 The graph of velocity and distance a ball compresses is linear. 3 The formula for distance a ball compresses at impact takes the form: d = cv, where d is the distance a ball compresses, c is a constant (coefficient of compressibility) for each ball, and v is the velocity at impact. 4 For any given velocity the distance through which each of these six balls compresses is in the
15 16 17
18
19 20 21
22
Luttgens K, Wells K. Kinesiology: Scientific Basis of Human Motion. 7th Edn. Philadelphia, PA: Saunders College Publishing, 1982. Piscopo J, Baley JA. Kinesiology, The Science of Movement. New York: John Wiley, 1981. Northrip JW, Logan GA, McKinney WC. Analysis of Sport Motion. Dubuque: William C. Brown Co, 1983. Bunn JW. Scientific Principles of Coaching. Englewood Cliffs, NJ: Prentice-Hall, 1972. Broer MR. Efficiency of Human Movement. Philadelphia, PA: W.B. Saunders, 1967. Jensen CR, Schultz GW. Applied Kinesiology. New York: McGraw-Hill, 1970. Scott GM. Analysis of Human Motion, 2nd Edn. New York: Appleton-Century-Crofts: 1963. Hay JG, Reid JC. The Anatomical and Mechanical Bases of Human Motion. Englewood Cliffs, NJ: Prentice-Hall, 1982. Schneider K. The risk of brain-injuries in soccer-header. Unfallheikunde 1984; 87: 40-2. Smodlaka VN. Medical aspects of heading the ball in soccer. Physic Sportsmed 1984; 12: 127-31. Tysvaer A, Storli 0. Association football injuries to the brain: a preliminary report. Br J Sports Med 1981; 15: 163-6. Verdaguer J. Juvenile retinal detachment. Am J Ophthalmol 1982; 93: 145-56. Burke MJ, Sanitato JJ, Vinger PF, Raymond LA, Kulwin DR. Soccerball-induced eye injuries. JAMA 1983; 249: 2682-5. Sandyk R. Footballer's migraine: a report of two cases. S Afr Med J 1983; 63: 434. Kross R, Ohler K, Barolin GS. Cerebral trauma due to heading: computerized EEG-analysis of football players. EEG EMG 1983; 14: 209-12. Tysvaer A. Case report: cervical disc herniation in a football player. Br J Sports Med 1985; 19: 43-4. Levendusky TA, Armstrong CW, Eck JS, Jezioroski J, Kugler L. Impact characteristics of two types of soccer balls. In: Science and Football. London: E & FN Spon, 1988. Townend MS. Is heading the ball a dangerous activity? In: Science and Football. London: E & FN Spon, 1988: 237-46. Bishop PJ, Briard BD. Impact performance of bicyde helmets. Can J Appl Sport Sci 1984; 9: 94-101. Bishop PJ, Norman RW, Kozey JW. Evaluation of football helmets under impact conditions. Am J Sports Med 1984; 12: 233-6. Smith PK, Hamill J. Karate and boxing glove impact characteristics as functions of velocity and repeated impact. In: Terauds J, Barham JM, eds. Proceedings of ISBS 1985: Biomechanics in Sports II. Del Mar, CA: Academic, 1985: 114-33. Hodgson VR, Thomas LM. Boxing gloves compared using dummy head acceleration response. Report to the New York State Athletic Commissioner, November 13, 1981.
Br J Sp Med 1991; 25(1) 37