0 ° x ° L, where L is the slice length and x is the neuron position. network with ...... CHAGNAC-AMITAI, Y. AND CONNORS, B. W. Horizontal spread of synchro-.
Propagating Neuronal Discharges in Neocortical Slices: Computational and Experimental Study DAVID GOLOMB AND YAEL AMITAI Zlotowski Center for Neuroscience and Department of Physiology, Faculty of Health Sciences, Ben-Gurion University of the Negev, Beer-Sheva 84105, Israel Golomb, David and Yael Amitai. Propagating neuronal discharges in neocortical slices: computational and experimental study. J. Neurophysiol. 78: 1199–1211, 1997. We studied the propagation of paroxysmal discharges in disinhibited neocortical slices by developing and analyzing a model of excitatory regular-spiking neocortical cells with spatially decaying synaptic efficacies and by field potential recording in rat slices. Evoked discharges may propagate both in the model and in the experiment. The model discharge propagates as a traveling pulse with constant velocity and shape. The discharge shape is determined by an interplay between the synaptic driving force and the neuron’s intrinsic currents, in particular the slow potassium current. In the model, N-methyl-D-aspartate (NMDA) conductance contributes much less to the discharge velocity than amino-3-hydroxy-5-methyl-4-isoxazolepropionic acid (AMPA) conductance. Blocking NMDA receptors experimentally with 2-amino-5-phosphonovaleric acid (APV) has no significant effect on the discharge velocity. In both model and experiments, propagation occurs for AMPA synaptic coupling gAMPA above a certain threshold, at which the velocity is finite (non-zero). The discharge velocity grows linearly with the gAMPA for gAMPA much above the threshold. In the experiments, blocking AMPA receptors gradually by increasing concentrations of 6-cyano-7-nitroquinoxaline-2,3-dione (CNQX) in the perfusing solution results in a gradual reduction of the discharge velocity until propagation stops altogether, thus confirming the model prediction. When discharges are terminated in the model by the slow potassium current, a network with the same parameter set may display discharges with several forms, which have different velocities and numbers of spikes; initial conditions select the exhibited pattern. When the discharge is also terminated by strong synaptic depression, there is only one discharge form for a particular parameter set; the velocity grows continuously with increased synaptic conductances. No indication for more than one discharge velocity was observed experimentally. If the AMPA decay rate increases while the maximal excitatory postsynaptic conductance (EPSC) a cell receives is kept fixed, the velocity increases by Ç20% until it reaches a saturated value. Therefore the discharge velocity is determined mainly by the cells’ integration time of input EPSCs. We conclude, on the basis of both the experiments and the model, that the total amount of excitatory conductance a typical cell receives in a control slice exhibiting paroxysmal discharges is only Ç5 times larger than the excitatory conductance needed for raising the potential of a resting cell above its action potential threshold.
INTRODUCTION
When synaptic g-aminobutyric acid-A (GABAA ) inhibition is pharmacologically suppressed in neocortical slices, neuronal population discharges 1 appear as responses to elec1 The propagating activity is called ‘‘discharge’’ here. In the dynamics literature, propagating activity that is localized in both space and time is often referred to as a ‘‘pulse’’ (Cross and Hohenberg 1993).
trical stimulation above a certain strength. In extracellular recording, they are found to be abrupt, all-or-none field potentials (FPs). In intracellular recordings, they correspond to depolarizing shifts (DSs) in membrane potentials, above which rides a high-frequency train of action potentials. These discharges are referred to as ‘‘synchronous’’ or ‘‘epileptiform’’ (Gutnick et al. 1982), implying that adjacent cells tend to fire together. Understanding the dynamics of discharge propagation is interesting for three reasons. First, by relating the discharge characteristics, such as the shape of the intracellularly measured potentials and the velocity of discharge propagation, to the intrinsic and synaptic neuronal properties, information about the underlying cortical structure can be revealed. For example, various cortical areas differ in the discharge velocities and shapes along the slice (Chervin et al. 1988; Neumann-Haefelin et al. 1996; Wadman and Gutnick 1993), most likely reflecting physiological and anatomic differences. Second, these paroxysmal discharges constitute in vitro models for interictal discharges in epilepsy: both events are relatively large, essentially all-or-none, reproducible, and relatively brief; have variable latencies; and seem to encompass almost all the neurons in a local cortical region in a synchronous manner (Chervin et al. 1988). Thus studying the mechanisms for the initiation and propagation of neuronal discharges could have therapeutic implications. Third, spatiotemporal propagating activities in the cortex have been observed recently in vivo (Nicolelis et al. 1996; Prechtl et al. 1996). Discharge propagation in slices is one of the simplest examples of such activity, and understanding its dynamics is a first step in the investigation of propagation effects in neuronal systems. The paroxysmal discharges spread from the stimulus site and propagate along the slice. The experimental characteristics of the discharge propagation have been described in numerous experimental studies (e.g., Baldino et al. 1986; Chagnac-Amitai and Connors 1989a,b; Chervin et al. 1988; Connors 1984; Flint and Connors 1996; Gutnick et al. 1982; Wadman and Gutnick 1993). However, several questions regarding the dynamic mechanisms that lead to the creation, propagation, and cessation of discharges remain to be answered. 1) What are the spatiotemporal properties of the discharge propagation, and how are they related to the network architecture? 2) How do the velocity and shape of the discharge depend on the synaptic parameters, such as the strength of amino-
0022-3077/97 $5.00 Copyright q 1997 The American Physiological Society
/ 9k19$$se08
J022-7
08-20-97 14:26:13
neupa
LP-Neurophys
1199
1200
D. GOLOMB AND Y. AMITAI
3-hydroxy-5-methyl-4-isoxazolepropionic acid (AMPA) and N-methyl-D-aspartate (NMDA) synaptic efficacies, and the level of synaptic depression? 3) What is the relationship between the propagation velocity and the synaptic kinetics? To answer these questions, we used both modeling and experimental techniques. We constructed a computational biophysical model that was consistent with the known cellular and synaptic properties of neocortical cells. The network model has a one-dimensional architecture with spatially decaying synaptic efficacies, and therefore spatiotemporal phenomena such as propagation can be investigated. The discharge shape and velocity were studied as functions of the synaptic coupling strengths, both for AMPA and NMDA, and the effect of synaptic depression on the network dynamics was investigated. Predictions raised by the model were tested experimentally in disinhibited rat cortical slices with the use of FP recordings and pharmacological manipulations. Combinations of modeling and experimental approaches have been used before in studying discharge propagation in hippocampal slices (Miles et al. 1988; Traub et al. 1993). Although in these hippocampal models the single cell is an endogenous burster (Golomb and Rinzel 1996; Pinsky and Rinzel 1994; Traub et al. 1991), the single cells in our model are regular spikers (Gutnick and Crill 1995), and the bursting activity during the discharge is a network phenomenon. A preliminary report of the present work has been published in abstract form (Golomb and Amitai 1996). METHODS
Single-cell models When inhibition is completely blocked, both regular-spiking (RS) and intrinsic bursting excitatory cells participate in the collective activity and exhibit a DS during the discharge propagation (Connors and Amitai 1993; Gutnick et al. 1982). Because there is currently no reason to assume that the intrinsic bursting property in neocortex plays a major role in the activity, we treat here, for simplicity, only one type of excitatory pyramidal cortical cell, corresponding to the RS type. The single-cell dynamics is described by a single-compartment Hodgkin-Huxley type model with the use of a set of coupled differential equations (Hansel and Sompolinsky 1996) C
dV ( x, t) Å 0 INa 0 INaP 0 IKdr 0 IK A 0 IK-slow dt (1)
where C is the membrane capacitance and V ( x, t) is the membrane potential of a neuron at a position x and time t. The right side incorporates an applied current Iapp , and the following intrinsic and synaptic currents (Gutnick and Crill 1995): the fast sodium current INa , the persistent sodium current INaP , the delayed-rectifier potassium current IKdr , the A-type potassium current IK A , the slow potassium current IK-slow , the leak current IL , the AMPA current IAMPA , and the NMDA current INMDA . The slow potassium current IK-slow in our model represents potassium currents with kinetics slower than the action potential time scale, i.e., with activation time on the order of several tens to hundreds of milliseconds (Storm 1990). These currents are either calcium dependent, such as IC and IAHP (Pinsky and Rinzel 1994; Sah 1996; Traub et al. 1991), or voltage dependent, such as IM (McCormick et al. 1993; Yamada et al. 1989). They are responsi-
J022-7
Synaptic models Neocortical cells receive fast AMPA-mediated excitatory postsynaptic potentials (EPSPs) and slow NMDA-mediated EPSPs from neighboring excitatory cells (Douglas and Martin 1990; Gil and Amitai 1996a). Synaptic transmission occurs when the presynaptic cell emits a spike, i.e., when its potential rises above a certain voltage level. A gating variable s for an AMPA or an NMDA receptor, representing the fraction of open channels, is modeled according to ds Å kfTGlu s` (Vpre )(1 0 s) 0 krs dt
(2)
where Vpre is the presynaptic potential, TGlu is the normalized number of presynaptic glutamate vesicles, s` (V ) Å {1 / exp[ 0 (V 0 us )/ ss ]} 01 , us Å 020 mV is the presumed voltage threshold for synaptic release, and ss Å 2 mV (Destexhe et al. 1994; Wang and Rinzel 1993). The presynaptic voltage is more depolarized than us only when the presynaptic cell emits a spike. The decay time of the fast AMPA synapses is kr Å 0.2 ms 01 , and that of the slow NMDA synapse is krN Å 0.0067 ms 01 (Jonas and Spruston 1994; Stern et al. 1992); kf Å 1 ms 01 . Synaptic depression is modeled phenomenologically as a depletion process of glutamate presynaptic vesicles (Stevens and Wang 1995) dTGlu Å 0kts` (Vpre )TGlu / k£ (1 0 TGlu ) dt
(3)
When an action potential arrives, s` (Vpre ) is close to 1; the normalized number of presynaptic vesicles TGlu , 0 ° TGlu ° 1, decreases with a rate kt . When there is no presynaptic activity, s` (Vpre ) is close to 0, and TGlu recovers with a rate k£ , much slower than kt . If kt Å 0 there is no synaptic depression. The total synaptic conductance a neuron receives, gS in (for AMPA or NMDA) is calculated by summing the synaptic variable of each of its presynaptic neurons as described below. The AMPA current is IAMPA Å gAMPA S inAMPA (V 0 VGlu )
(4)
The NMDA current depends also on the postsynaptic voltage, and is calculated approximately by multiplying the presynaptic term by a sigmoid function fNMDA (V ) of the postsynaptic voltage (Destexhe et al. 1994; Traub et al. 1991). The NMDA current is therefore INMDA Å gNMDA S inNMDA fNMDA (V )(V 0 VGlu )
0 IL 0 IAMPA 0 INMDA / Iapp
/ 9k19$$se08
ble for the adaptation in RS cortical cells. The equations and parameters of the model are given in the APPENDIX .
(5)
Axonal propagation delays are neglected because the propagation velocity of action potentials in axons (on the order of 1 m/s; see DISCUSSION ) (Gil and Amitai 1996b; Haberly 1990) is considerably faster than the velocity of discharge propagation ( Ç15 cm/s).
Network architecture Rat coronal cortical slices used in experiments (e.g., Connors 1984; Gutnick et al. 1982; present experiments) are narrow in one dimension (thickness 400 mm) and extend Ç1.5 1 0.2 cm in the two other dimensions. Our goal in this modeling work is to study the discharge propagation along the slice as neurons in consecutive columns are recruited, and not the recruitment of cells across the layers in one column. Therefore the layer structure is not modeled here. Instead, following previous modeling work on hippocampal slices (Miles et al. 1988; Traub et al. 1993) and simple neural networks (Ermentrout and McLeod 1993; Idiart and Abbott 1993;
08-20-97 14:26:13
neupa
LP-Neurophys
PROPAGATING NEURONAL ACTIVITY IN NEOCORTICAL SLICES
1201
neighbors according to the same rule, but do not get input from nonexisting ‘‘neurons’’ outside of the slice model (open boundary conditions). To make the model as independent as possible of the number of cells N and the footprint length l (Golomb et al. 1996; Hansel and Sompolinsky 1996), we normalize the function w(x) such that the total synaptic conductance received by a cell distant from the edges when all the synaptic channels are open is g. Equations 8 and 6 imply that the normalization condition is N L
*
`
dx w(x) Å 1
(9)
0`
The integro-differential Equations 1, 4, 5, and 8, together with the differential equations for the auxiliary variables, are discretized on a grid, as described in the APPENDIX, and solved numerically.
Initial conditions and parameter survey
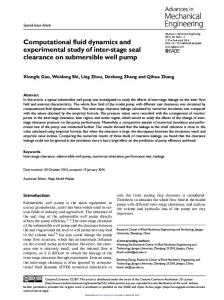
FIG . 1. Schematic diagrams of model architecture and cortical slice. A: model has 1-dimensional architecture. Amino-3-hydroxy-5-methyl-4isoxazolepropionic acid (AMPA) and N-methyl-D-aspartate (NMDA) coupling strengths (maximal synaptic conductances) decay with distance between pre- and postsynaptic cells. Typical decay length l is called synaptic footprint length. B: for exponential footprint shape, l is spatial distance for which coupling strength reaches 1/e of its maximal value. C: schematic diagram of cortical slice with 2 recording electrodes and 1 stimulating electrode.
Wilson and Cowan 1973), we present a model of a one-dimensional system. Neurons are equally distributed along the interval 0 ° x ° L, where L is the slice length and x is the neuron position. The number of neurons is N and the position of the ith neuron, 1 ° i ° N, is xi Å iL/N. The interaction between neurons is assumed to decay with the distance between them (Fig. 1A). The term ‘‘synaptic footprint shape,’’ w(x), denotes the functional dependence of the synaptic connectivity on the distance between the pre- and the postsynaptic cells. It is assumed here to be symmetrical. The coupling footprint length l is the typical decay length of the synaptic footprint shape w(x). An exponential footprint shape w(x) Å Ae0ÉxÉ / l is chosen (Fig. 1B) (Golomb et al. 1996; Traub et al. 1993), where the normalization constant A is determined below. The model is studied in the regime l!L
(6)
We assume that a neuron receives many synaptic inputs from neurons within a footprint length Nl /L @ 1
(7)
and therefore we use the continuum approximation. The total synaptic conductance gS in affecting a neuron is gS in (x, t) Å g
*
L
dx * r (x * )w(x 0 x * )s(x *, t)
(8)
0
where r(x) Å N/L is the cell density. The quantities g, s, and S in have a subscript AMPA or NMDA for the two types of receptors. Neurons near the edges receive synaptic inputs from their existing
/ 9k19$$se08
J022-7
Our goal is to understand the dynamics of activity discharges evoked experimentally by a brief local stimulation when the slice is at rest. Therefore we initiate our model from a state at which all the neurons, except a group at the left edge, are at their resting state. A wave is initiated by depolarizing a group of neurons at the left edge (0 ° x ° 0.06) to 0 mV. The auxiliary variables of the neurons are chosen to be at their steady-state values with the appropriate V . The depolarized neurons may recruit resting neurons to the activity and initiate a propagating discharge. Not all the parameters of our model can be determined experimentally. As was done in previous works (Golomb et al. 1994, 1996), we choose a reference parameter set that is consistent with many experimental results. Then we systematically change some parameters to investigate their effects on the network dynamics. There are parameter regimes in which several dynamic states occur for the same parameter set; the discharge form is selected by initial conditions–for example, the number of cells initially excited. Often, our goal is to modify one parameter value and to find the parameter interval in which one dynamic state, such as a propagating discharge with a specific number of spikes (see RESULTS ), occurs. In this case, we simulate the system with a first parameter value and find the state. The values of the variables at the right quarter of the network, determined at the time the discharge has just arrived at the point L 0 l, are stored. Then, we simulate the network with the new parameter value. The initial conditions of the variables at the left quarter of the network are chosen to be the values of the variables at the right quarter that were stored previously. All the other neurons in the model start from rest. The borders of a parameter range for which a dynamic state is observed are determined with the use of the bisection algorithm (Press et al. 1992).
Experimental methods The methods for preparing and maintaining slices of neocortex have been described (Amitai 1994). Briefly, Wistar rats (4–6 wk old, 100–150 g) were anesthetized with pentobarbital sodium and decapitated, and the brains quickly removed into a chilled ( Ç47C), oxygenated artificial cerebrospinal fluid (ACSF). The ACSF contained (in mM) 124.0 NaCl, 5.0 KCl, 2.0 MgSO4 , 1.25 NaHPO4 , 2.0 CaCl2 , 26.0 NaHCO3 , and 10.0 dextrose, saturated with 95% O2-5% CO2 , pH 7.4. Coronal slices 400 mm thick were cut on a vibratome (Campden Instruments) from the primary somatosensory cortex and were kept in holding bottles that contained ACSF at room temperature, continuously bubbled with 95% O2-5% CO2 . Recordings were performed in a fluid-gas interface chamber thermostatically controlled to 35–367C after ¢1 h of incubation. All drugs were bath applied. Two FP electrodes (filled with 1 M NaCl, 6–8 MV ) were placed Ç7–8 mm apart in layers II/III. The cortex was stimulated by 0.1-
08-20-97 14:26:13
neupa
LP-Neurophys
1202
D. GOLOMB AND Y. AMITAI
ms, 0.01- to 0.05-mA pulses at 0.1 Hz delivered by a bipolar microelectrode made from sharpened tungsten wires and placed on the border of the white matter ¢0.5 mm away from the closer recording electrode (Fig. 1C). Recordings were made with an Axoprobe amplifier (Axon Instruments). Data were recorded online at 10 kHz and analyzed with a software program written under visual C// (Labview, National Instruments). RESULTS
Single-cell dynamics The model of the single excitatory cell includes two time scales: one (1–10 ms) of the action-potential-generating currents (INa , IKdr , and even IK A ) and a second, on the order of 100 ms, of the activation of IK-slow . Adaptation is produced as an interplay between these two time scales. The neuronal behavior with IK-slow blocked is shown in Fig. 2, A and B. When a depolarized current above a critical value is injected into the cell, the cell fires tonically (Fig. 2AI). If the applied current is even higher, the neuron membrane potential may approach a depolarized plateau following a period of damped oscillatory firing (Fig. 2AII). Figure 2B shows that as the applied current Iapp increases, the neuron dynamics shifts from rest to tonic firing and then to a depolarized plateau (with a regime where both of the later 2 states are observed). The neuron dynamics is different when IK-slow is intact. When the neuron is initially at rest, a strong enough current injection causes the model neuron to fire, with the interspike interval increasing with time until it reaches a constant value (Fig. 2C). This behavior occurs because of the time of a few cycles that is needed for IK-slow to build up, hyperpolarize the neuron, and reduce its firing rate; it mimics the adaptation found experimentally in RS neurons (Gutnick and Crill 1995). Both the first interspike interval and the long-time interspike interval decrease with the injected current amplitude. The long-time dynamic behavior of the neuron is presented in Fig. 2D as a function of Iapp . A comparison of Fig. 2D with Fig. 2B reveals that including IK-slow increases the Iapp range for which the neuron fires tonically instead of going to a high plateau. Except for a tiny Iapp regime near the onset of oscillations (Iapp Å 0.34 mA/cm2 ), the minimum voltage during the oscillation cycle is higher than the rest state with no applied current. This phenomenon, called here overshooting, is consistent with the observed behavior of RS pyramidal neurons (reviewed by Amitai and Connors 1994). This phenomenon, together with the existence of the high plateau, is relevant for the behavior of a cell within a network, as is shown below. Discharge propagation without synaptic depression As a first step, we investigate a case in which neuronal activity is terminated by IK-slow only, without synaptic depression. Stimulating the left edge of the slice creates activity that propagates by continuously recruiting new neighboring cells. The firing rastergram of the neurons in the network is shown in Fig. 3A, and membrane potential traces of five neurons along the network are plotted in Fig. 3 B. Except for a region near the edges, the voltage trace (and the whole dynamics) of a neuron in a position x1 is identical to the voltage trace of a neuron in a position x2 , but is shifted in
/ 9k19$$se08
J022-7
FIG . 2. Dynamics of single pyramidal cell model. A and B: slow potassium current IK-slow is blocked (no adaptation). A: when neuron is at rest, injecting applied current of 2.5 mA/cm2 shifts it into spiking mode ( AI). Injecting Iapp at 7 mA/cm2 shifts neuron into depolarized plateau after period of fast damped firing (AII). B: properties of rest and oscillatory (tonic firing) states of single-neuron model with applied current Iapp . Narrow solid line: stable rest state. Narrow dashed line: unstable rest state (which cannot be reached experimentally). For oscillatory state, maximum and minimum voltages over cycle are denoted by wide solid lines (stable oscillations) and wide dashed lines (unstable oscillations). There is a bistable regime (1.58 mA/cm2 õ Iapp õ 6.56 mA/cm2 ) for which both tonic firing and depolarized plateau can be sustained. Arrows: the 2 Iapp values shown in A. C and D: IK-slow is intact. C: when neuron is at rest, injecting applied current of 2.5 mA/cm2 causes firing with interspike interval that increases with time until it reaches constant value. Injecting stronger current, such as 7 mA/cm2 (CII), decreases interspike interval both at onset of spikes and at steady-state firing. Minimum voltage during each firing cycle decreases with adaptation. D: properties of rest and oscillatory (tonic firing) states of single-neuron model at long times, after complete adaptation. Symbols as in B. Except for very narrow regime near onset of oscillations (Iapp ™ 0.33 mA/cm2 ), minimum voltage during firing is higher than at rest potential. Arrows: the 2 Iapp values shown in C.
time with a delay (x1 0 x2 )/ £D . The discharge velocity £D is constant along the slice. Therefore the discharge is dynamically a traveling pulse 2 (Cross and Hohenberg 1993) V ( x, t) Å VH (x 0 £Dt)
(10)
During the activity, each neuron fires several action potentials (7 in the present case). Time evolutions of synaptic and intrinsic auxiliary variables of one neuron within a net2 In the mathematical sense, traveling pulses only exist in an infinite domain; the discharges that are seen here are like traveling pulses in large domains.
08-20-97 14:26:13
neupa
LP-Neurophys
PROPAGATING NEURONAL ACTIVITY IN NEOCORTICAL SLICES
1203
FIG . 3. Propagation of discharges in cortical slice model. There is no synaptic depression ( kt Å 0), gAMPA Å 0.31 mS/ cm2 , gNMDA Å 0.25 mS/cm2 . A: rastergram of excitatory cells. Only firing times from every 4th cell are shown. Arrows at right: position of 5 cells along slice whose voltage time courses are plotted in B. Initially cells at left (x ° 0.06) are depolarized (V Å 10 mV) and all others are at rest. Discharge propagates to right and far from edges maintains its shape; every neuron fires 7 spikes during discharge. C: time courses of internal variables of neuron denoted by a. From top: total AMPA and NMDA synaptic conductance, S inAMPA and S inNMDA , that this neuron receives (the neuron’s ‘‘input’’); AMPA and NMDA auxiliary variables, sAMPA and sNMDA , of postsynaptic synapses connecting this neuron to others (the neuron’s ‘‘output’’); slow potassium activation variable z. Auxiliary variables are normalized such that 1 means that all corresponding channels are open. in and work are plotted in Fig. 3C. The synaptic inputs S AMPA in S NMDA begin to rise from zero under the effect of neuronal activity to the left of the neuron. As a result, the neuron starts firing, sends synaptic output sAMPA and sNMDA to its neighbors, and helps to recruit more neurons on its right. During that time, the slow potassium current IK-slow builds up. When it is strong enough, it terminates the neuron’s activity. As long as the neuron fires, its AMPA synaptic output variable sAMPA rises during each spike to about the same value and drops down between spikes. After the activity terminates, sAMPA returns rapidly to zero. The synaptic variable of the slow NMDA synapse, sNMDA , stays at a high value during the activity and decays slowly on its termination. The input synaptic field varies more slowly than the interspike interval. To analyze the discharge shape, we use a crude approximation and separate the slow time scales of the synaptic input and of IK-slow from the faster time scale of the spike-generating currents. Except during action potentials, the synaptic driving force V 0 VGlu (Eq. 4) is approximately constant. Therefore the effect of the excitatory synaptic input is similar to the effect of an applied current. As shown above, the cortical cell model exhibits overshoot in response to current injection. Similarly, the minimum voltage during the active period is above the rest potential. This behavior is consistent with the experimental observation that the spikes ride on a depolarizing envelope (Gutnick et al. 1982). The shape of a voltage trace of a neuron during the discharge is determined by an interplay between the input synaptic field and the slow potassium current IK-slow . Voltage traces for two values of AMPA conductance gAMPA and two values of gK-slow are shown in Fig. 4. For moderate synaptic input (e.g., 0.45 mS/cm2 ), the neuron fires a train of spikes with an amplitude that decays only slowly with time. At higher gAMPA (0.8 mS/cm2 in Fig. 4), the neuron’s potential tends to converge to the high plateau. The amplitude of consecutive action potentials decreases rapidly; the peak voltage decreases and the minimum voltage (between the action potentials) increases. The slow potassium current ter-
/ 9k19$$se08
J022-7
minates the activity in both cases. The stronger it is, the faster is the discharge termination. Dependence on AMPA synaptic strength We assess quantitatively how the number of spikes fired by each neuron, and the discharge velocity £D , vary with synaptic strength. Figure 5A presents the number of spikes and £D of a discharge as a function of gAMPA when NMDA receptors are blocked. Discharges can propagate only if gAMPA is above a threshold level gAMPA,c . At that threshold conductance, £D is finite (non-zero). For a wide gAMPA range, there are multiple discharge forms. The initial conditions, i.e., the number of initially depolarized cells, select the discharge pattern. For the same gAMPA , discharges with a larger number of spikes propagate faster. The reason for this is the fact that a neuron just in front of a discharge involving a larger number of spikes is affected by a stronger synaptic field. The increase in the velocity is more prominent at smaller spike numbers. For example, at gAMPA Å 0.31 mS/ cm2 ( ∗ ), the velocity increase from the three-spike discharge to the four-spike discharge is 9.4%, whereas the velocity MODEL.
FIG . 4. Voltage time traces of neuron during discharge, gNMDA Å 0. AMPA conductance gAMPA : 0.45 mS/cm2 (left traces), 0.8 mS/cm2 (right traces). Slow potassium conductance gK-slow : 1.0 mS/cm2 (top traces), 2.0 mS/cm2 (bottom traces).
08-20-97 14:26:13
neupa
LP-Neurophys
1204
D. GOLOMB AND Y. AMITAI
tions of 0.2–0.4 mM CNQX, varying between slices. Propagation continued to slow gradually with increasing CNQX concentrations until it was abolished altogether at concentrations of 0.6–0.8 mM. (Fig. 6, n Å 4). The lowest velocity measured was between 0.25 and 0.5 of the control velocity. In higher CNQX concentrations, there was a change in the FP shape at both proximal and distal recording micropipettes. The dependency of £D on the initial conditions was exam-
FIG . 5. Number of spikes in propagating discharge (top) and discharge velocity £D (bottom) vs. AMPA synaptic conductance strength gAMPA (A) and NMDA synaptic conductance strength gNMDA (B). There is no synaptic depression. In A, NMDA conductance is blocked (gNMDA Å 0). Asterisk: value gAMPA Å 0.31 mS/cm2 (see text). In B, gAMPA Å 0.31 mS/cm2 . Arrow: gNMDA value of Fig. 3. Multiple discharge shapes with different numbers of spikes and velocities can occur for same parameter value.
increase from the four-spike discharge to the five-spike discharge is only 3.6%. This effect is due to the exponential decay of the synaptic footprint shape, because each additional spike is spatially more distant, and contributes less to the synaptic field. The effects of adding more than seven spikes cannot be detected, and the velocity curve looks almost continuous. For gAMPA much larger than gAMPA,c , the relationship between the velocity £D and gAMPA is close to linear. At gAMPA values larger than those shown in Fig. 5A, the membrane voltage during the discharge tends to go to a high plateau before returning to rest. In such cases, it is difficult to determine what a ‘‘spike’’ is, and therefore to count spikes, but £D continues to grow approximately linearly with gAMPA . Simple scaling arguments based on the normalization condition (Eq. 9) show that the discharge velocity depends linearly on the synaptic footprint length l (Golomb et al. 1996). EXPERIMENT. The dependence of £D on the synaptic strength has never been tested experimentally. We tested the relationship between £D and gAMPA experimentally. We used cortical slices in which GABAA inhibition was blocked by bicuculline methiodide (10 mM), and excitatory transmission was manipulated pharmacologically. Initially, NMDA receptors were completely blocked by application of 2-amino-5phosphonovaleric acid (APV, 30–50 mM). To examine the effect of changes in gAMPA , AMPA receptors were blocked gradually by adding 6-cyano-7-nitroquinoxaline-2,3-dione (CNQX), at slowly increasing concentrations, to the perfusing solution, starting from 0.1–0.3 mM. The control (0 CNQX) £D varied between 13 and 19 cm/s among slices (n Å 7). The first decrease in £D was measured at concentra-
/ 9k19$$se08
J022-7
FIG . 6. A: local field potential (FP) recording from 2 electrodes for several 6-cyano-7-nitroquinoxaline-2,3-dione (CNQX) concentrations. Narrow line: FP measured by electrode closer to stimulus. Wide line: FP measured by more distant electrode. As CNQX concentration increases, latency between discharge arrival to the 2 electrodes increases. B: discharge velocity at several CNQX concentrations measured in 4 experiments. Results from each experiment are denoted by different line types ( , r r r, - - -, and – – – ) and different symbols ( ●, j, s and l, respectively). Control values (at zero CNQX level) are not connected by lines. Error bars: SD, calculated by averaging over 10–20 discharges at each concentration. FP traces in A correspond to - - -.
08-20-97 14:26:13
neupa
LP-Neurophys
PROPAGATING NEURONAL ACTIVITY IN NEOCORTICAL SLICES
1205
(EPSCs) decay more slowly than AMPA EPSCs, and therefore their main effect is on the number of spikes. If gAMPA õ gAMPA,c , strong NMDA conductance enables propagation of the discharges in the model. The minimal gNMDA needed for propagation is reduced as gAMPA approaches gAMPA,c from below. EXPERIMENT. We measured the velocity £D in disinhibited slices before and after applying APV (30–50 mM) to the bath. The FPs became briefer after the NMDA blockade. However, no significant change was found in £D (n Å 4), supporting the model result. Discharge propagation with synaptic depression
FIG . 7. FP traces recorded by 2 electrodes at 3 stimulus strengths. A: Istim Å 0.03 mA. B: Istim Å 0.04 mA. C: Istim Å 0.1 mA. As stimulus strength increases, discharge arrives faster at electrodes, but latency between the 2 arrival times (nt) does not change significantly.
ined by changing the stimulus strength Istim at several CNQX concentrations. Propagation was observed only if Istim was above a threshold Istim,c , which increased with increasing CNQX concentrations. Close to Istim,c , small changes in £D resulted in pronounced changes in the latency to the proximal FP (Fig. 7) (see also Gutnick et al. 1982). Nevertheless, there was no significant change in £D as a function of Istim at all CNQX concentrations. Thus our experimental results confirmed two main predications of the model: 1) £D was found to depend on the strength of AMPA transmission in the slice and 2) a threshold level of AMPA strength was established (in particular, the propagation stops at a finite velocity). The experimental results could not confirm the multiple velocities for a given condition set predicted by the model at gAMPA near the threshold. Dependence on NMDA synaptic strength Increasing gNMDA results in a larger number of spikes and a higher velocity £D . However, the effect on £D is weaker in comparison with that of varying gAMPA . For example, between the minimal gAMPA for which a six-spike discharge is obtained (0.33 mS/cm2 ) and the minimal gAMPA for which an eight-spike discharge is obtained (0.42 mS/ cm2 ), £D increases by 38% (Fig. 5A). In comparison, between the corresponding minimal gNMDA values (0.06 mS/ cm2 and 0.27 mS/cm2 , Fig. 5B), £D increases by only 14%. This difference stems from the different time scales of the two receptors. NMDA excitatory postsynaptic conductances MODEL.
/ 9k19$$se08
J022-7
Because we found no experimental evidence for the existence of multiple discharge velocities, we searched for ways to modify the model. Synaptic depression reduces the magnitude of consecutive EPSCs in response to a train of presynaptic action potentials (Markram and Tsodyks 1996; Thomson et al. 1993). The magnitude of synaptic depression is frequency dependent and varies considerably between synapses. Introducing strong synaptic depression turns out to prevent the occurrence of multiple discharges for a specific parameter set. To demonstrate the effect of this process, we set the parameter kt Å 1 ms 01 (Eq. 3), which corresponds to strong depression. With this value, the amount of free vesicles TGlu goes down by ú60% immediately after the first spike. Five voltage time traces of neurons along the slice are shown in Fig. 8A. The basic characteristic of the discharge propagation as a traveling pulse is maintained: V ( x, t) Å V˜ (x 0 £Dt). Time evolutions of synaptic and intrinsic auxiliary variables of one neuron within a network are plotted in Fig. 8B. Synaptic depression mainly affects the trajectory of the fast AMPA variable sAMPA , because consecutive action potentials generate weaker EPSCs, similar to the recordings of Markram and Tsodyks (1996). The AMPA peak response to the fourth spike is only 30% of the response to the first spike. Therefore only the first three spikes are strongly observed by the postsynaptic cell. The input synaptic field a in cell receives, S AMPA , is therefore briefer than in the case without synaptic depression; this helps to terminate the discharge. The slow NMDA variable sNMDA has a trajectory similar to that in the case without synaptic depression, but of a smaller amplitude. As before, the IK-slow activation variable z builds up during the activity and terminates it when it is strong enough. The dependencies of the number of spikes and the discharge velocity £D on the synaptic conductance strengths gAMPA and gNMDA are shown in Fig. 9, A and B. Only one discharge form is obtained here for a specific parameter set. The number of spikes increases with gAMPA and gNMDA . The velocity £D increases continuously with the synaptic conductance, even at points where the number of spikes jumps. The only exception is a slight discontinuity in £D , hardly seen in Fig. 9A, at the gAMPA value for which the number of spikes increases from two to three. The reason for that continuous dependence of £D on the synaptic conductances is the fact that the postsynaptic neuron is affected primarily by the first three presynaptic spikes. Note that the gAMPA,c is higher here than gAMPA,c without synaptic depression (Fig. 9), to comin pensate for the reduction in S AMPA due to the depression. Even more than in the case without synaptic depression, fast AMPA receptors affect mainly the discharge velocity,
08-20-97 14:26:13
neupa
LP-Neurophys
1206
D. GOLOMB AND Y. AMITAI
neurons to integrate input EPSCs and reach the firing threshold. To discriminate between the two factors, we investigate the dependence of £D on the AMPA decay rate kr when NMDA receptors are blocked. First, we vary kr while keeping all the other parameters, including the AMPA conductance gAMPA , fixed. The velocity £D decreases continuously with kr (Fig. 10A) because higher kr means that the synaptic conductances are active for a briefer period and therefore the total input synaptic field is weaker. To study the ‘‘true’’ effect of kr , we vary it while keeping fixed the effective synaptic conductance gAMPA,eff , defined as in the following. The maximum synaptic input S AMPA,max a cell receives as the discharge passes it is S inAMPA,max Å max S inAMPA (t)
(11)
t
Note that this magnitude is the same for all the neurons. The effective synaptic conductance is: gAMPA,eff Å gAMPA S inAMPA,max
(12)
When kr is varied, we calculate iteratively the conductance gAMPA (for each kr value) for which the gAMPA,eff remains fixed. The dependence of £D on kr under this condition is presented in Fig. 10B. £D grows with kr and reaches saturation at high kr , where the synapses can be regarded as instantaneous. At the reference value (kr Å 0.2 ms 01 ), £D is Ç82% of the saturated value. Therefore the main factor that limits the discharge velocity is not the synaptic decay rate but the time needed for neuronal integration of EPSPs. DISCUSSION
Several conclusions emerge from our study. 1) The discharge propagates in our model as a traveling pulse. Cells
FIG . 8. Propagation of discharges in cortical slice model. Activity is terminated by IK-slow and by synaptic depression (kt Å 1.0 ms 01 ), gAMPA Å 0.9 mS/cm2 , gNMDA Å 0.9 mS/cm2 . A: voltage time traces of 5 cells along slice at same position as in Fig. 3. Every neurons fires 6 spikes during discharge. B: time courses of internal variables of neuron denoted by a. From top: total AMPA and NMDA synaptic conductances, S inAMPA and S inNMDA , that this neuron receives; presynaptic variable TGlu ; AMPA and NMDA auxiliary variables, sAMPA and sNMDA , of postsynaptic synapses connecting this neuron to others; slow potassium activation variable z.
whereas slow NMDA receptors contribute mainly to increasing the number of spikes. For example, between the minimal gAMPA for which a three-spike discharge is obtained (0.57 mS/cm2 ) and the minimal gAMPA for which a five-spike discharge is obtained (1.19 mS/cm2 ), £D increases by 205% (Fig. 9A). In contrast, £D increases by only 11% between the minimal gNMDA needed to obtain a five-spike discharge (0.41 mS/cm2 ) and the minimal gNMDA needed to obtain a seven-spike discharge (1.11 mS/cm2 ). AMPA decay rate Two main factors control the discharge velocity: the kinetics of excitatory synapses and the time needed by resting
/ 9k19$$se08
J022-7
FIG . 9. Number of spikes in propagating discharge (top) and discharge velocity £D (bottom) vs. AMPA synaptic conductance strength gAMPA (A) and NMDA synaptic conductance strength gNMDA (B). Activity is terminated by IK-slow and by synaptic depression (kt Å 1.0 ms 01 ). In A, NMDA conductance is blocked (gNMDA Å 0); In B, gAMPA Å 0.9 mS/cm2 . Arrow: gNMDA value of Fig. 8. For each parameter value there is a unique discharge shape.
08-20-97 14:26:13
neupa
LP-Neurophys
PROPAGATING NEURONAL ACTIVITY IN NEOCORTICAL SLICES
1207
prevents the firing from becoming a sustained state. Such interplay between network excitation and intrinsic adaptation has been shown to result in synchronous bursting in other models of hippocampal (Traub and Wong 1982) and neocortical (Hansel 1997) networks as well. There are several factors that control and limit the velocity £D . The decay rate of AMPA, being finite, reduces the velocity by Ç20% in comparison with the theoretical case for which the EPSCs are instantaneous but the effective synaptic coupling is maintained. The velocity is mainly limited by the time a neuron needs for integrating input EPSCs as the discharge approaches it and reaching the spiking threshold. Single-cell and synaptic properties affect network behavior
FIG . 10. Dependence of discharge shape and velocity on AMPA decay rate kr . NMDA receptors are blocked, kt Å 1 ms 01 . A: gAMPA Å 1.0 mS/ cm2 is fixed. Velocity £D decreases with kr . B: we start from reference parameter values gAMPA Å 1 mS/cm2 and kr Å 0.2 ms 01 and vary gAMPA with kr to keep effective synaptic input cell receives (gAMPA,eff , Eq. 12) fixed. Velocity £D grows with kr and reaches saturated value at high kr .
with a distance x between them exhibit the same voltage time course with a time shift of x/ £D , and this is a consequence of the geometry and the recruitment process. 2) Strong synaptic input leads to plateaulike voltage trajectories. 3) Discharges can propagate if gAMPA is larger than a threshold gAMPA,c . At the threshold, £D is finite and increases linearly with gAMPA at high gAMPA . 4) NMDA receptors do not contribute much to the propagation. 5) Synaptic depression prevents the appearance of multiple discharge forms. 6) The discharge velocity is mainly limited by the neuronal integration time, whereas synaptic kinetics plays a smaller role. Architecture and dynamics Neurons in our one-dimensional model of cortical slices are at rest without an external stimulus, whereas an initial shock that is strong enough produces a propagating discharge. A quiescent neuron in front of the discharge starts firing as a result of a recruitment process by active cells. A neuron ceases to fire because the slow potassium current builds up and, possibly, because of synaptic depression that helps in reducing the strength of input EPSCs. As a result, the network exhibits a discharge that moves with a constant velocity. Localized coupling ( l ! L) is an essential condition for the existence of propagating discharges. In a small domain, the activity is almost instantly felt along the whole tissue. Synchrony in our model means that cells with a distance x between them exhibit the same voltage time course with a time shift of x/ £D . Dynamically, the discharge is a transient response to the initial shock. This synchronized activity is a result of the interplay between the excitatory input that induces firing and the slow potassium current IK-slow that
/ 9k19$$se08
J022-7
We have related the various discharge shapes to the singlecell dynamics with IK-slow blocked and intact. In particular, the model with IK-slow blocked exhibits a high-voltage plateau under the application of a strong enough external current. Similarly, under the effect of strong synaptic input the neuron potential approaches such a plateau before being brought back to rest by IK-slow . Moderate synaptic input causes the neuron to fire at an almost constant amplitude. IK-slow is responsible for adaptation in single RS cells (Gutnick and Crill 1995; Hansel and Sompolinsky 1996), because its activation time scale is longer than that of the other intrinsic ionic current but is not too slow. If the activation rate were, say, 10 times slower, a fast-slow separation of time scales at the single-cell level (e.g., Rinzel 1987) would be possible. In that case, the single-cell potential would fire a few spikes and then converge to the high plateau as a response to the injection of a step current pulse. Later, the slow potassium current would build up until the neuron potential goes back to rest. With the reference activation time we use ( tz Å 75 ms, see APPENDI X ), the high plateau is not achieved with moderate levels of applied current. Instead, the slow potassium current initially decreased the spike amplitude and later increases the interspike interval. At higher levels of applied current, IK-slow causes tonic firing, whereas blocking it switches the neuron to the high plateau. At the network level, the strength of the slow potassium conductance gK-slow determines the discharge shape, in particular the number of spikes. However, the discharge velocity is determined mainly by the first few spikes, especially in the case of strong synaptic depression. Therefore gK-slow has only a minor effect on £D . Strong synaptic depression prevents the occurrence of more than one discharge form for a specific parameter set. The synaptic depression in our model is assumed to be presynaptic. Another model of synaptic depression suggests a postsynaptic mechanism (Tsodyks and Markram 1997). The network dynamics is not sensitive to the biophysical details of the mechanism. To construct the model, we used approximations with respect to the single-cell and synaptic dynamics. The single cells were taken to be isopotential, and dendritic delays (Zador et al. 1995) are neglected. Anatomic data about the positions of intracortical boutons on the dendritic tree and multicompartmental models are needed to estimate the effects of those delays. All the cells are assumed to be regular spikers for two reasons. First, most of the cells in the slice
08-20-97 14:26:13
neupa
LP-Neurophys
1208
D. GOLOMB AND Y. AMITAI
are regular spikers (Gutnick and Crill 1995). Second, neocortical excitatory cells in a disinhibited slice exhibit a depolarized shift regardless of their intrinsic properties (Gutnick et al. 1982), and there is currently no reason to assume that the intrinsic bursting property in neocortex plays a major role in the activity. Neglecting axonal delays is justified as long as the axonal velocity is much faster than £D . In our experiments, £D is Ç16 cm/s. There is a large variation in the axonal conduction velocities measured in experiments. Estimations range from 0.15 to 32 m/s (Chervin et al. 1988; Mitani and Shimokouchi 1985; Murakoshi et al. 1993; Waxman and Swadlow 1977). In our experiments in the somatosensory cortex of adult mice (Gil and Amital 1996b), electrical stimulation of a slice 1 mm away from the recording electrode resulted in latencies to the monosynaptic EPSPs of õ2 ms. Assuming a synaptic delay of 1 ms, the axonal velocity is estimated to be Ç1 m/s (see also Haberly 1990) in olfactory cortex. Such conduction velocity is an order of magnitude larger that the discharge velocity, and its effects on the discharge propagation are therefore negligible. Relations to wave propagation in other systems Models of propagating activity in other brain areas have been built, some of them related to experiments performed on the same area. When inhibition is blocked, discharges propagate in longitudinal CA3 hippocampal slices with a velocity of Ç15 cm/s, similar to our experimental results. A one-dimensional model of that network was analyzed by Miles et al. (1988). Single cells were taken to be endogenous bursters. As in the neocortical case, hippocampal discharges propagate by recruitment of new cells into the activity. The discharge velocity was calculated as a function of the footprint length l. Although in our case £D is linear with l, £D in the model of Miles et al. increases less than linearly with l because of the effect of finite axonal conductance (0.5 m/s in that case). Traub et al. (1993) studied the propagation of discharges along a transverse hippocampal slice. Their claim that the critical factor for propagation of the initial burst is the integration time over excitatory synaptic input is consistent with our result for neocortical models. Activity can also propagate in thalamic slices, composed of excitatory thalamocortical neurons and inhibitory reticular thalamic neurons (Destexhe et al. 1996; Golomb et al. 1996; Kim et al. 1995). However, the mechanism of propagation is different there. Although in models of neocortical slices the discharge propagates continuously such that V ( x, t) Å V˜ (x 0 £Dt), thalamic waves propagate in a lurching manner as a group of neurons from one type recruits a new group of neurons from the second type to the wave and vice versa. As a result of the lurching propagation, Golomb et al. (1996) showed that the wavefront velocity in thalamic slices depends approximately logarithmically on the synaptic strengths for an exponential footprint length. In contrast, we show here that in the neocortical (and hippocampal) networks £D grows linearly with the synaptic strength if gAMPA @ gAMPA,c . In models of thalamic slices, there is no minimal velocity, and £D can be close to zero. In neocortical slices, the discharge disappears at a finite velocity if gAMPA is reduced below gAMPA,c .
/ 9k19$$se08
J022-7
Propagation of activity was studied in simple models of neural networks (Ermentrout and McLoed 1993; Idiart and Abbott 1993). These works were the first to analyze rigorously propagation in integro-differential equations. In these models, the neuronal activity is represented by one variable and a moving wavefront separates a regime of high activity from a regime of low activity. Spikes and synaptic kinetics were not considered there. Computational versus experimental results Despite the strong heterogeneity in the intrinsic and synaptic properties of cortical slices (Chervin et al. 1988; Wadman and Gutnick 1993), several predictions of the model were confirmed experimentally. Propagation occurs if gAMPA is higher than a threshold value. At the threshold, £D is finite (not zero), and very slow propagation is not possible. Above it, £D increases with gAMPA . More quantitatively, prediction of a linear dependence of £D on gAMPA at strong gAMPA is hard to test experimentally, because the exact relation between the CNQX concentration and the gAMPA value in slices is not known. Another prediction of the model is that NMDA conductance has only a small effect on £D . In our model, the NMDA rise time is considered to be fast. If a more elaborated NMDA model with a rise time of 10 ms (Jonas and Spruston 1994) is used, the NMDA effect on £D is even smaller. In the experiments, we have not found any significant change in £D when the NMDA receptors were completely blocked. The model predicts that NMDA conductance, being slow, will increase the DS duration and the number of spikes during the discharge. This result is also consistent with the experimental results of Baldino et al. (1986) in rat organotypic explant cultures. In contrast to the negligible effect of blocking NMDA on £D in cortex, Traub et al. (1993) showed experimentally and computationally that in longitudinal CA3 slices, blocking NMDA receptors slows £D by Ç50%. The difference in the NMDA effect between cortex and hippocampus may be a result of a larger gNMDA and smaller gAMPA in the hippocampus. In addition, the resting potential of the hippocampal pyramidal cells reported by Traub et al. (1993) is 060 mV, Ç14 mV more depolarized than in our model. As a result, the magnesium blockade of NMDA receptors in the hippocampal model is weaker, and the more effective NMDA synapses have a stronger effect on £D . The model exhibits two functional regimes. Without synaptic depression, multiple discharge forms are observed at the same parameter values. The pattern is selected by the initial conditions, i.e., by the strength of the initial stimulus. Discharges with a larger number of spikes propagate faster; this effect is prominent when the number of spikes is small, but even then the velocity differences are on the order of a few percent. With strong synaptic depression, only one discharge form is observed for a specific parameter value. The dependence of £D on parameters such as the synaptic strengths is continuous. In the experiments, no significant dependence of £D on the stimulus strength has been observed. Neurons in the model of a homogeneous network display the same firing pattern. In a real system, sparseness and heterogeneity lead to the appearance of various patterns displayed by neurons in the same slice (Connors and Gutnick
08-20-97 14:26:13
neupa
LP-Neurophys
PROPAGATING NEURONAL ACTIVITY IN NEOCORTICAL SLICES
1984; Gutnick et al. 1982). We expect that a neuron that receives stronger excitation will fire in a ‘‘plateaulike’’ fashion, whereas a neuron that receives weaker excitation will fire action potentials with approximately fixed amplitude. High enough levels of sparseness and heterogeneity are expected to destroy the synchrony between neurons at the time scale of spikes but to preserve the synchrony at the time scale of the discharge. They may eliminate the existence of multiple discharge forms even in the case of no synaptic depression. In the experiment, £D at the threshold for propagation is Ç5 cm/s. In the model, £D at the threshold is found to be Ç100 l /s for the parameter sets that we used. Combining these results together, l is estimated to be on the order of 0.5 mm. This value depends mainly on the time a needed for the cell to integrate input EPSPs until its potential rises above the threshold of emitting a spike, and therefore the value is sensitive to the model’s parameters, in particular the leak conductance. The fact that this estimated l is consistent with the known length of local regions in cortex (Chervin et al. 1988; Wadman and Gutnick 1993) confirms that the parameter set we chose is reasonable. Estimating the synaptic conductance needed for evoking a spike Our experiments show that £D for AMPA conductance intact is 2–3 times faster than £D at threshold (Fig. 6). As shown in Fig. 9, such £D corresponds to gAMPA that is less than twice the threshold level gAMPA,c . Therefore we conclude that the amount of excitation gAMPA a typical cortical cell receives is Ç2 times larger than the amount needed for propagation. To understand what determines the threshold gAMPA,c , we consider a system of two cells, in which one cell excites the other with an AMPA synapse with a strength gAMPA . A single action potential is evoked in the presynaptic cell by injection of a step current pulse. If gAMPA is below a threshold level, the postsynaptic cell will exhibit a subthreshold depolarization; if gAMPA is above that threshold, the cell will fire a spike. The threshold for the parameter set of Fig. 9 is 0.17 mS/cm2 . Going back to Fig. 9, we find that the threshold for discharge propagation is gAMPA,c Å 0.54 mS/cm2 . The total synaptic efficacy from neurons left of a postsynaptic cell (subtracting the synaptic input from the right and the selfcoupling term) is 0.24 mS/cm2 . This means that to make discharge propagation possible with strong synaptic depression, the total synaptic conductance from the left should be only somewhat bigger than the synaptic input that evokes a spike in full synchrony. In the case of no synaptic depression the threshold can be even smaller because the postsynaptic neuron integrates the input conductance of several spikes. Combining all these results, we estimate that the total amount of conductance gAMPA a typical cell receives in an intact slice during a paroxysmal discharge is only Ç5 times larger than the AMPA conductance needed for raising the potential of a resting cell above its threshold. This ratio is expected to be higher, but of the same order of magnitude, where a two-dimensional model is concerned. Although it is difficult to calculate the implication of this
/ 9k19$$se08
J022-7
1209
result for systems in vivo, because the ratio of intact synapses that remain after cutting the slice is hard to estimate, we believe that similar experimental and modeling techniques can be used to find the ratio of input conductance needed for spike generation in vivo. APPENDIX
Model equations and parameters We use a Hodgkin-Huxley-like formulation for the excitatory cortical cells. The intrinsic ionic currents were modeled on the basis of existing voltage-clamp and current-clamp data. There are N cells, representing a spatial discretization of the continuous integrodifferential Eq. 1. The position of the ith neuron is xi Å i/N. We specify here our reference parameter set. These parameters are used throughout the paper unless stated otherwise. The maximal conductances (g’s) and current kinetics are adjusted to fit action potential parameters and firing patterns of RS neocortical neurons (Connors and Gutnick 1990; Fleidervish et al. 1996; Huguenard et al. 1988; Yang et al. 1996).
Current balance equation C
dVi Å 0 INa (Vi , hi ) 0 INaP (Vi ) 0 IKdr (Vi , ni ) 0 IK A (Vi , bi ) dt 0 IK-slow (Vi , zi ) 0 IL (Vi ) 0 IAMPA (Vi , {sAMPA, j }) 0 INMDA (Vi , {sNMDA, j }) / Iapp,i
(A1)
2
C Å 1mF/cm , Iapp, j Å 0.
Intrinsic currents SODIUM CURRENT INa .
INa (V, h) Å gNam 3` (V )h(V 0 VNa )
(A2)
dh Å [h` (V ) 0 h]/ th (V ) dt
(A3)
m` (V ) Å {1 / exp[ 0 (V 0 um )/ sm ]} 01 h` (V ) Å {1 / exp[ 0 (V 0 uh )/ sh ]}
01
th (V ) Å 0.37 / 2.78 1 {1 / exp[ 0 (V 0 uht )/ sht ]} 01
(A4) (A5) (A6)
gNa Å 24 mS/cm2 , VNa Å 55 mV, um Å 030 mV, sm Å 9.5 mV, uh Å 053 mV, sh Å 07 mV, uht Å 040.5 mV, sht Å 06 mV. Our INa model is based on the experimental results of Fleidervish et al. (1996). As in other models of cortical cells (e.g., Hansel and Sompolinsky 1996; Traub et al. 1991; Wang 1993), the function h` (V ) is shifted to the right on the voltage axis to enable the model to replicate the current-clamp current injection experiments. Gating kinetics has been adjusted to 367C. PERSISTENT SODIUM CURRENT INaP .
INaP (V, h) Å gNaPP` (V )(V 0 VNa ) p` (V ) Å {1 / exp[ 0 (V 0 up )/ sp ]}
(A7) 01
(A8)
2
gNaP Å 0.07 mS/cm , up Å 040 mV, sp Å 5.0 mV (Alzheimer et al. 1993; Fleidervish and Gutnick 1996). DELAYED RECTIFIER POTASSIUM CURRENT IKdr .
08-20-97 14:26:13
IKdr (V, n) Å gKdrn 4 (V 0 VK )
(A9)
dn Å [n` (V ) 0 h]/ tn (V ) dt
(A10)
tn (V ) Å 0.37 / 1.85 1 {1 / exp[ 0 (V 0 unt )/ snt ]} 01
(A11)
neupa
LP-Neurophys
1210
D. GOLOMB AND Y. AMITAI n` (V ) Å {1 / exp[ 0 (V 0 un )/ sn ]} 01
wI ( j) Å tanh [L/(2lN)] exp[ 0É jÉ L/( lN)]
(A12)
(A28)
gKdr Å 3 mS/cm2 , VK Å 090 mV, un Å 030 mV, sn Å 10 mV, unt Å 027 mV, snt Å 015 mV. (Fleidervish et al. 1996; Wang 1993).
The normalization constant tanh [L/(2lN)] is determined by the `
A-TYPE POTASSIUM CURRENT IK A .
The simulations reported in this paper were performed with the use of the fourth-order Runge-Kutta method with time step Dt Å 0.03 ms. We simulated networks with N between 128 and 512. Increasing N has little effect on the results as long as lN is large enough (say ¢4). Synaptic fields (Eq. A21 and A25) were computed with the use of fast Fourier transform (Golomb et al. 1996; Press et al. 1992). Bifurcation diagrams (Fig. 2, B and D) were calculated with the use of the program AUTO (Doedel 1981) incorporated into software package XPP, written by G. B. Ermentrout (Rinzel and Ermentrout 1997).
IK A (V, b) Å gK Aa 3` b(V 0 VK )
(A13)
db Å [b` (V ) 0 b]/ tb dt
(A14)
a` (V ) Å {1 / exp[ 0 (V 0 ua )/sa ]} 01
(A15)
01
(A16)
b` (V ) Å {1 / exp[ 0 (V 0 ub )/ sb ]} 2
gK A Å 1.4 mS/cm , ua Å 050 mV, sa Å 20 mV, ub Å 080 mV, sb Å 06 mV, tb Å 15 ms (Hansel and Sompolinsky 1996; Rush and Rinzel 1995). SLOW POTASSIUM CURRENT IK-slow .
IK-slow (V, z) Å gK-slow z(V 0 VK )
(A17)
dz Å [z` (V ) 0 z]/ tz dt
(A18)
z` (V ) Å {1 / exp[ 0 (V 0 uz )/ sz ]} 01
(A19)
constraint S w( j) Å 1. l Å 0.03125, N Å 256, L Å 1. jÅ0`
We are grateful to E. Barkai, B. W. Connors, G. B. Ermentrout, I. Fleidervish, Z. Gil, M. J. Gutnick, D. Hansel, and J. Rinzel for helpful discussions and to D. Hansel and B. W. Connors for carefully reading this manuscript. This research was supported by a grant from the Israel Science Foundation. Address for reprint requests: D. Golomb, Dept. of Physiology, Faculty of Health Sciences, PO Box 653, Ben-Gurion University of the Negev, Beer-Sheva 84105, Israel.
gK-slow Å 1 mS/cm2 , uz Å 039 mV, sz Å 5 mV, tz Å 75 ms (Hansel and Sompolinsky 1996).
Received 11 January 1997; accepted in final form 7 May 1997.
LEAK CURRENTS IL .
REFERENCES IL Å gL (V 0 VL )
(A20)
gL Å 0.02 mS/cm2 , VL Å 070 mV.
Synaptic currents AMPA CURRENT IAMPA . N
IAMPA (V, {sAMPA, j }) Å gAMPA (V 0 VGlu ) ∑ wI (i 0 j)sAMPA, j
(A21)
jÅ1
dsAMPA, j Å kfTGlu s` (V j )(1 0 sAMPA, j ) 0 krsAMPA, j dt
(A22)
dTGlu, j Å 0kts` (V j )TGlu, j / k£ (1 0 TGlu, j ) dt
(A23)
s` (V ) Å {1 / exp[ 0 (V 0 us )/ ss ]} 01
(A24)
01
01
us Å 020 mV, ss Å 2 mV, kf Å 1 ms , kr Å 0.2 ms , kt Å 0 or 1 ms 01 , k£ Å 0.001 ms 01 , gAMPA Å 0.9 mS/cm2 , VGlu Å 0 mV (Golomb et al. 1994, 1996; Jonas and Spruston 1994; Stern et al. 1992). NMDA CURRENT INMDA .
INMDA (V, {sNMDA, j }) N
Å gNMDA fNMDA (V )(V 0 VGlu )
∑ wI (i 0 j)sNMDA, j
(A25)
jÅ1
dsNMDA, j Å kf N TGlu s` (V j )(1 0 sNMDA, j ) 0 krNsNMDA, j dt
(A26)
fNMDA (V ) Å {1 / exp[ 0 (V 0 uf N )/ sf N ]} 01
(A27)
01
01
kf Å 1 ms , ktN Å 0.0067 ms , uf N Å 025 mV, sf N Å 12.5 mV, gNMDA Å 0.9 mS/cm2 , VGlu Å 0 mV (Destexhe et al. 1994; Jonas and Spruston 1994; Stern et al. 1992).
Architecture The synaptic coupling term rw(x) (Eq. 8) is discretized and yields the discrete function w ˜ ( j), where
/ 9k19$$se08
J022-7
ALZHEIMER, C., SCHWINDT, P. C., AND CRILL, W. E. Modal gating of Na / channels as a mechanism of persistent Na / current in pyramidal neurons from rat and cat sensorimotor cortex. J. Neurosci. 13: 660–673, 1993. AMITAI, Y. Membrane potential oscillations underlying firing patterns in neocortical neurons. Neuroscience 63: 151–161, 1994. AMITAI, Y. AND CONNORS, B. W. Intrinsic physiology and morphology of single neurons in neocortex. In: Cerebral Cortex, The Barrel Cortex of Rodents, edited by E. G. Jones and I. T. Diamond. New York: Plenum, 1994, vol. 11, p. 299–331. BALDINO, F., JR ., WOLFSON, B., HEINEMANN, U., AND GUTNICK, M. J. An N-methyl-D-aspartate (NMDA) receptor antagonist reduced bicucullineinduced depolarization shifts in neocortical explant cultures. Neurosci. Lett. 70: 101–105, 1986. CHAGNAC -AMITAI, Y. AND CONNORS, B. W. Horizontal spread of synchronized activity in neocortex and its control by GABA-mediated inhibition. J. Neurophysiol. 61: 747–758, 1989a. CHAGNAC -AMITAI, Y. AND CONNORS, B. W. Synchronized excitation and inhibition driven by intrinsically bursting neurons in neocortex. J. Neurophysiol. 62: 1149–1162, 1989b. CHERVIN, R. D., PIERCE, P. A., AND CONNORS, B. W. Periodicity and directionality in the propagation of epileptiform discharges across neocortex. J. Neurophysiol. 60: 1695–1713, 1988. CONNORS, B. W. Initiation of synchronized neuronal bursting in neocortex. Nature 310: 685–687, 1984. CONNORS, B. W. AND AMITAI, Y. Generation of epileptiform discharges by local circuits in neocortex. In: Epilepsy: Models, Mechanisms and Concepts, edited by P. A. Schwartzkroin. Cambridge, UK: Cambridge Univ. Press, 1993, p. 388–424. CONNORS, B. W. AND GUTNICK, M. J. Cellular mechanisms of neocortical epileptogenesis in an acute experimental model. In: Electrophysiology of Epilepsy, edited by P. A. Schwartzkroin and H. V. Wheal. London: Academic, 1984, p. 79–105. CONNORS, B. W AND GUTNICK, M. J. Intrinsic firing patterns of diverse neocortical neurons. Trends Neurosci. 13: 99–104, 1990. CROSS, M. C. AND HOHENBERG, P. C. Pattern formation outside of equilibrium. Rev. Mod. Phys. 65: 851–1112, 1993. DESTEXHE, A., BAL, T., MCCORMICK, D. A., AND SEJNOWSKI, T. J. Ionic mechanisms underlying synchronized oscillations and propagating waves in a model of ferret thalamic slices. J. Neurophysiol. 76: 2049–2070, 1996. DESTEXHE, A., MAINEN, Z. F., AND SEJNOWSKI, T. J. Synthesis of models for excitable membranes, synaptic transmission and neuromodulation using a common kinetic formalism. J. Comput. Neurosci. 1: 195–230, 1994.
08-20-97 14:26:13
neupa
LP-Neurophys
PROPAGATING NEURONAL ACTIVITY IN NEOCORTICAL SLICES DOEDEL, E. Auto: a program for the automatic bifurcation analysis of autonomous systems. Cong. Num. 30: 265–284, 1981. DOUGLAS, R. J. AND MARTIN, K.A.C. Neocortex. In: The Synaptic Organization of the Brain (3rd ed.), edited by G. M. Shepherd. Oxford, UK: Oxford Univ. Press, 1990, p. 389–438. ERMENTROUT, G. B. AND MC LEOD, J. B. Existence and uniqueness of travelling waves for a neural network. Proc. R. Soc. Edinb. A Math. Phys. Sci. 123: 461–478, 1993. FLEIDERVISH, I. A., FRIEDMAN, A., AND GUTNICK, M. J. Slow inactivation of Na / current and slow cumulative spike adaptation in mouse and guinea-pig neocortical neurones in slices. J. Physiol. (Lond.) 493: 83– 97, 1996. FLEIDERVISH, I. A. AND GUTNICK, M. J. Kinetics of slow inactivation of persistent sodium current in layer V neurons of mouse neocortical slices. J. Neurophysiol. 76: 2125–2129, 1996. FLINT, A. C. AND CONNORS, B. W. Two types of network oscillations in neocortex mediated by distinct glutamate receptor subtypes and neuronal populations. J. Neurophysiol. 75: 951–956, 1996. GIL, Z. AND AMITAI, Y. Adult thalamocortical transmission involves both NMDA and non-NMDA receptors. J. Neurophysiol. 76: 2547–2554, 1996a. GIL, Z. AND AMITAI, Y. Properties of convergent thalamocortical and intracortical synaptic potentials in single neurons of neocortex. J. Neurosci. 16: 6567–6578, 1996b. GOLOMB, D. AND AMITAI, Y. Characteristics of conditions for propagating neuronal activity in neocortex. Soc. Neurosci. Abstr. 22: 104, 1996. GOLOMB, D. AND RINZEL, J. Minimal biophysical models of oscillations and waves in thalamus and hippocampus. In: Neural Modeling of Brain and Cognitive Disorders, edited by J. A. Reggia, E. Ruppin, and R. S. Berndt. Singapore: World Scientific, 1996, p. 327–346. GOLOMB, D., WANG, X.-J., AND RINZEL, J. Synchronization properties of spindle oscillations in a thalamic reticular nucleus model. J. Neurophysiol. 72: 1109–1126, 1994. GOLOMB, D., WANG, X.-J., AND RINZEL, J. Propagation of spindle waves in a thalamic slice model. J. Neurophysiol. 75: 750–769, 1996. GUTNICK, M. J., CONNORS, B. W., AND PRINCE, D. A. Mechanisms of neocortical epileptogenesis in vitro. J. Neurophysiol. 48: 1321–1335, 1982. GUTNICK, M. J. AND CRILL, W. E. The cortical neuron as an electrophysiological unit. In: The Cortical Neuron, edited by M. J. Gutnick and I. Mody. Oxford, UK: Oxford Univ. Press, 1995, p. 33–51. HABERLY, L. B. Olfactory cortex. In: The Synaptic Organization of the Brain (3rd ed.), edited by G. M. Shepherd. Oxford, UK: Oxford Univ. Press, 1990, p. 317–345. HANSEL, D. The role of spike adaptation in shaping spatiotemporal patterns of activity in cortex. In: SIAM Fourth Conference on Application of Dynamical Systems, In press. HANSEL, D. AND SOMPOLINSKY, H. Chaos and synchrony in a model of a hypercolumn in visual cortex. J. Comput. Neurosci. 3: 7–34, 1996. HUGUENARD, J. R., HAMILL, O. P., AND PRINCE, D. A. Developmental changes in Na / conductances in rat neocortical neurons: appearance of a slowly inactivating component. J. Neurophysiol. 59: 778–795, 1988. IDIART, M.A.P. AND ABBOTT, L. F. Propagation of excitation in neural network models. Network 4: 285–294, 1993. JONAS, P. AND SPRUSTON, N. Mechanisms shaping glutamate-mediated excitatory postsynaptic currents in the CNS. Curr. Opin. Neurobiol. 4: 366– 372, 1994. KIM, U., BAL, T., AND MCCORMICK, D. A. Spindle waves are propagating synchronized oscillations in the ferret LGNd in vitro. J. Neurophysiol. 74: 1301–1323, 1995. MARKRAM, H. AND TSODYKS, M. Redistribution of synaptic efficacy between neocortical pyramidal neurons. Nature 382: 807–810, 1996. MCCORMICK, D. A., WANG, Z., AND HUGUENARD, J. Neurotransmitter control of neocortical activity and excitability. Cereb. Cortex 3: 387–398, 1993. MILES, R., TRAUB, R. D., AND WONG, K. S. Spread of synchronous firing in longitudinal slices from the CA3 region of the hippocampus. J. Neurophysiol. 60: 1481–1496, 1988. MITANI, A. AND SHIMOKOUCHI, M. Neuronal connections in the promary auditory cortex: an electrophysiological study in the cat (Abstract). J. Comp. Neurol. 235: 417, 1985. MURAKOSHI, T., GUO, J.-Z., AND ICHINOSE, T. Electrophysiological indentification of horizontal synaptic connections in rat visual cortex in vitro. Neurosci. Lett. 164: 211–214, 1993.
/ 9k19$$se08
J022-7
1211
NEUMANN-HAEFELIN, T., HAGEMANN, G., AND WITTE, O. W. Differential responsiveness of neocortical areas in the parieto-occipital region to lowintensity stimulation in vivo. J. Neurophysiol. 76: 622–625, 1996. NICOLELIS, M.A.L., CARSWELL, B., OLIVEIRA, L.M.O., GHAZANFAR, A. A., CHAPIN, J. K., LIN, R.C.S., NELSON, R. J., AND KAAS, J. H. Long-term simultaneous recording of neuronal ensembles across multiple cortical areas in behaving primates. Soc. Neurosci. Abstr. 22: 2023, 1996. PINSKY, P. F. AND RINZEL, J. Intrinsic and network rhythmogenesis in a reduced Traub model for CA3 neurons. J. Comp. Neurosci. 1: 39–60, 1994. PRECHTL, J. C., COHEN, L. B., MITRA, P. P., AND KLEINFELD, D. Spatiotemporal structure of stimulus induced electrical activity in turtle visual cortex. Soc. Neurosci. Abstr. 22: 1061, 1996. PRESS, W. H., TEUKOLSKY, S. A., VETTERLING, W. T., FLANNERY, B. P. Numerical Recipes in C. The Art of Scientific Computing (2nd ed.). Cambridge, UK: Cambridge Univ. Press, 1992. RINZEL, J. A formal classification of bursting mechanisms in excitable systems. In: Lecture Notes in Biomathematics, Mathematical Topics in Population Biology, Morphogenesis and Neuroscience, edited by E. Teramoto and M. Yamaguti. Berlin: Springer-Verlag, 1987, vol. 71, p. 267–281. RINZEL, J. AND ERMENTROUT, G. B. Analysis of neural excitability and oscillations. In: Methods in Neuronal Modeling: From Synapses to Networks (2nd ed.), edited by C. Koch and I. Segev. Cambridge, MA: MIT Press In press. RUSH, M. E. AND RINZEL, J. The potassium A-current, low firing rates, and rebound excitation in Hodgkin-Huxley models. Bull. Math. Biol. 57: 899– 929, 1995. SAH, P. Ca 2/ -activated K / currents in neurons: types, physiological roles and modulation. Trends Neurosci. 19: 150–154, 1996. STERN, P., EDWARDS, F. A., AND SAKMANN, B. Fast and slow components of unitary EPSPs on stellate cells elicited by focal stimulation in slices of rat visual cortex. J. Physiol. (Lond.) 449: 247–278, 1992. STEVENS, C. F. AND WANG, Y. Facilitation and depression at single central synapses. Neuron 14: 795–802, 1995. STORM, J. F. Potassium currents in hippocampal pyramidal cells. Prog. Brain Res. 83: 161–187, 1990. THOMSON, A. M., DEUCHARS, J., AND WEST, D. C. Large, deep layer pyramid-pyramid single axon EPSPs in slices of rat motor cortex display paired-pulse and frequency-dependent depression, mediated presynaptically, and self-facilitation mediated postsynaptically. J. Neurophysiol. 70: 2354–2369, 1993. TRAUB, R. D., JEFFERYS, J.G.R., AND MILES, R. Analysis of the propagation of disinhibition-induced after-discharges along the guinea-pig hippocampal slice in vitro. J. Physiol. (Lond.) 472: 267–287, 1993. TRAUB, R. D. AND WONG, R.K.S. Cellular mechanism of neuronal synchronization in epilepsy. Science 216: 745–747, 1982. TRAUB, R. D., WONG, R.K.S., MILES, R., AND MICHELSON, H. A model of a CA3 hippocampal pyramidal neuron incorporating voltage-clamp data on intrinsic conductance. J. Neurophysiol. 66: 635–650, 1991. TSODYKS, M. V. AND MARKRAM, H. The neural code between neocortical pyramidal neurons depends on neurotransmitter release probability. Proc. Natl. Acad. Sci. USA 94: 719–723, 1997. WADMAN, W. J. AND GUTNICK, M. J. Non-uniform propagation of epileptiform discharge in brain slices of rat neocortex. Neuroscience 52: 255– 262, 1993. WANG X.-J. Ionic basis for intrinsic 40 Hz neuronal oscillations. Neuroreport 5: 221–224, 1993. WANG, X.-J. AND RINZEL, J. Spindle rhythmicity in the reticularis thalami nucleus: synchronization among mutually inhibitory neurons. Neuroscience 53: 899–904, 1993. WAXMAN, S. G. AND SWADLOW, H. A. The conduction properties of axons in central white matter. Prog. Neurobiol. 8: 297–324, 1977. WILSON, H. R. AND COWAN, J. D. A mathematical theory for the functional dynamics of cortical and thalamic tissue. Kybernetic 13: 55–80, 1973. YAMADA, W. M., KOCH, C., AND ADAMS, P. Multiple channels and calcium dynamics. In: Methods in Neuronal Modeling: From Synapses to Networks, edited by C. Koch and I. Segev. Cambridge, MA: MIT Press, 1989, p. 97–133. YANG, C. R., SEAMANS, J. K., AND GORELOVA, N. Electrophysiological and morphological properties of layers V-VI principal pyramidal cells in rat prefrontal cortex in vitro. J. Neurosci. 16: 1904–1921, 1996. ZADOR, A. M., AGMON-SNIR, H., AND SEGEV, I. The morphoelectrotonic transform: a graphical approach to dendritic function. J. Neurosci. 15: 1669–1682, 1995.
08-20-97 14:26:13
neupa
LP-Neurophys