achieved by the adaptive parallel ISAT strategy for chemistry calculations. The
study ... In the context of PDF methods [14], where the system within the solution ...
Computationally efficient implementation of combustion chemistry in parallel PDF calculations
Liuyan Lu, Steven R. Lantz, Zhuyin Ren, Stephen B. Pope
FDA 07-02
October 2007
Nomenclature Roman Symbols A
mapping gradient matrix with components Aij ≡ ∂fi /∂xj
A
maximum number of table entries per processor allowed
A∗
critical number of ISAT table entries
a
number of table entries in a serial calculation
ai
total number of tabulated table entries in all processors in group i in the adaptive strategy
a∗L
maximum number of table entries per processor allowed on the Lth pairing stage in the adaptive strategy
f (x)
function of x of dimension nf
fl
linear approximation to f (x)
g
number of processors in each group in the adaptive strategy
L
overlap matrix with components Lij ≡ Pij /Pii
Mr
number of partially stirred reactors in the simulation
Ms
total number of pairing stages, Ms = log2 (Np )
N
number of particles in a partially stirred reactor
NF ij
average number of particles per processor requiring function evaluation when groups i and j are paired
Ng
number of groups in the simulation
Ni
average number of particles per processor in group i in the adaptive strategy
Nij
average number of particles processed on each processor when groups i and j are paired
Ni,α
number of particles on processor α in group i
Np
total number of processors in a simulation
nf
dimension of f
2
ns
number of species
nx
dimension of x
nφ
dimension of composition φ
Pij
probability of a particle composition from group i being able to be retrieved from the ISAT table(s) in group j in the adaptive strategy
Pˆαβ
probability of a particle composition from processor α being able to be retrieved from the ISAT table on processor β in the adaptive strategy
pA
probability of a query resulting in an add
pA (a) probability of add when there are a table entries pA (q, a) probability of add on the qth query when there are a table entries pAi
probability of a query resulting in an add for group i
pD
probability of a query resulting in a discarded evaluation (DE)
pF
probability of a query resulting in a function evaluation, pF = pA + pG + pD
pF i
probability of a query resulting in a function evaluation for group i
pf d
threshold value below which an ISAT table is considered fully developed
pG
probability of a query resulting in a grow
pR
probability of a query resulting in a retrieve (pR = 1 − pF )
Qα
number of queries performed on processor α
q(a)
number of queries resulting in a table entries
q, Q
number of queries performed
qf (A) query on which ISAT table becomes full (i.e., ISAT fills A table entries) R(φ) reaction mapping r
exponent in the observed power law (Eq. 14)
S
chemical source term (Eq. 3)
s
ratio between A and A∗ , i.e., s = A/A∗
T
average wall clock time spent in reaction fractional step for one block of particles
3
0
Ti
estimated wall clock time spent in reaction fractional step for one block of particles for group i
0
Tij
estimated wall clock time spent in reaction fractional step for one block of particles for the hypothetical pairing between group i and j (i 6= j)
0
Tnp
estimated wall clock time spent in reaction fractional step for one block of particles with no pairing performed
0
Tp
estimated wall clock time spent in reaction fractional step for one block of particles with the optimal pairing
tF
average CPU time for a function evaluation
tF,w
average wall clock time for a function evaluation
tF i,w
average wall clock time for a function evaluation on group i
tQ
average CPU time for a query
tQ,w
average wall clock time for a query
tR
average CPU time for a retrieve
tR,w
average wall clock time for a retrieve
tRi,w
average wall clock time for a retrieve on group i
tRij,w average wall clock time for a retrieve when groups i and j are paired tRj→i,w average wall clock time per particle for particles from group j attempting to retrieve from ISAT tables on group i x
vector of dimension nx
Greek Symbols ∆t
time step in reaction fractional step
ε
incurred local error in ISAT (Eq. 6)
εtol
user-specified error tolerance for ISAT
τmix
specified mixing time scale in a PaSR
τpair
specified pairing time scale in a PaSR
4
τres
specified residence time scale in a PaSR
φ
particle composition
Calligraphic A
add region
D
particle composition distribution
G
grow region
Pk
k-th feasible pairing
R
retrieve region
Superscripts 0
estimated quantity
Abbreviations EOA ellipsoid of accuracy ISAT in situ adaptive tabulation ODE ordinary differential equation PaSR partially stirred reactor PLP purely local processing PREF preferential distribution ROA region of accuracy URAN uniform random distribution
5
Abstract
In parallel calculations of combustion processes with realistic chemistry, the serial in situ adaptive tabulation (ISAT) algorithm [1,2] substantially speeds up the chemistry calculations on each processor. To further improve the efficiency of chemistry calculations in parallel computations, in this work, the ISAT algorithm is extended to the multi-processor environment, with the aim of minimizing the wall clock time required for chemistry calculations. Different parallel ISAT strategies are developed by combining the existing serial ISAT algorithm with different distribution strategies, namely purely local processing (PLP), uniformly random distribution (URAN), and preferential distribution (PREF). The distribution strategies enable the load redistribution of chemistry calculations among processors using message passing. They are implemented in the software x2f mpi, which is a Fortran 90 library for facilitating many parallel evaluations of a general function. The relative performance of the parallel ISAT strategies is investigated in different computational regimes via the PDF calculations of multiple partially stirred reactors burning methane/air mixtures. The results show that the performance of ISAT with a fixed distribution strategy strongly depends on the computational regime the calculation is in, and no one strategy consistently achieves good performance in all the regimes. Therefore, an adaptive distribution strategy, which blends PLP, URAN and PREF, is proposed to yield consistently good performance in all regimes. In the corresponding adaptive parallel ISAT strategy, the distribution is determined “on the fly” based on the prediction of future simulation time. Compared to the PLP/ISAT strategy where chemistry calculations are essentially serial, a speed-up factor of up to 30 is achieved by the adaptive parallel ISAT strategy for chemistry calculations. The study also demonstrates that the adaptive strategy has good parallel scalability. 6
1
Introduction
Numerical calculations of reactive flows with realistic chemical kinetics are computationally expensive. At the same time, they are becoming increasingly important both in understanding the physical processes and in the design and development of practical systems, such as engines and combustors. The computational difficulty is caused by the large number of chemical species and the wide range of time scales involved in chemical kinetics. A realistic description of combustion chemistry for hydrocarbon fuels typically involves tens to thousands of chemical species [3,4], and the time scales usually range from 10−9 s to over 1s [5,6]. The above considerations motivate the well-recognized need for the development of methodologies that radically decrease the computational burden imposed by the direct use of realistic chemistry in reactive flow calculations. Among such methodologies are storage/retrieval approaches including structured look-up tabulation [7], repro-modelling [8], artificial neural networks (ANN) [9,10], in situ adaptive tabulation (ISAT) [1,2], piecewise reusable implementation of solution mapping (PRISM) [11,?], and high dimension model representations (HDMR) [13]. Among the existing storage/retrieval approaches, the ISAT [1] algorithm is currently particularly fruitful. ISAT has been widely used to incorporate the reduced or detailed chemical mechanism in probability density function (PDF) [14] calculations of turbulent non-premixed flames [15–17,?,19–23,?,25,26]. While the computational efficiency of the ISAT algorithm is greatest in statistically stationary reactive flows such as Sandia turbulent jet flames where a speed-up factor of 100 to 1,000 is achieved, ISAT has also been applied to the calculation of transient processes such as combustion in IC engines [18] where a speed-up factor of more than 10 is reported. Recently, ISAT has been incorporated in the LES/FDF approach [27,28] that offers the benefits of both large eddy simulation (LES) to treat the turbulent flow and the PDF approach to treat turbulence-chemistry interactions. The ISAT algorithm has also 7
been applied to incorporate detailed chemical kinetics in the direct numerical simulation (DNS) of reactive flow [29,30]. Besides the wide applications in the field of combustion, the applications of ISAT in other areas have been reported in [31–33]. When ISAT is employed to speed up chemistry calculations in computational fluid dynamics (CFD), which can be direct numerical simulation (DNS), large eddy simulation (LES) or a probability density function (PDF) method, a reaction fractional step is used to separate the chemical reactions from other processes such as convection and molecular diffusion. The task performed by ISAT in the reaction fractional step is to determine the thermochemical compositions after a computational time step (either variable or constant) due to chemical reactions. In the context of PDF methods [14], where the system within the solution domain is represented by a large number of computational particles, the task for ISAT in the reaction step is to determine the particle compositions after reaction. We call a particle is “resolved” when its composition after reaction has been obtained. By tabulating useful information in binary trees called ISAT tables and reusing it, ISAT can substantially reduce the amount of chemical kinetic calculations required and therefore provide significant speed-up for chemistry calculations. Despite the seemingly unending progress in microprocessor performance indicated by Moore’s law, large-scale computations of turbulent reactive flows with realistic chemistry demand that we pursue the additional factors of tens, hundreds, or thousands in total performance which may be obtained by harnessing a multitude of processors for a single calculation. For example, the terascale direct numerical simulations of three-dimensional turbulent temporally evolving plane CO/H2 jet flames with an eleven species skeletal mechanism reported by Hawkes et al. [34] are performed on massively parallel processors. One platform to perform these largescale computations is a distributed memory system using Message Passing Interface (MPI) to perform the message passing. With domain decomposition applied, the whole computational domain is decomposed into sub-domains and each processor performs the computation for 8
one sub-domain. When ISAT is employed to speed up the chemistry calculations in parallel PDF computations, each processor has its own ISAT table. During the reaction fractional step, each processor has an ensemble of particles whose compositions after the reaction step need to be determined. However the original ISAT algorithm by Pope [1] is serial in the following sense: during the reaction fractional step each processor performs its own chemistry calculations without message passing or load redistribution. Due to the nonuniform intensity of chemical reactions or nonuniform distribution of computational particles among the sub-domains, there is usually significant load imbalance in the chemistry calculations. For example, some sub-domains may have intense reaction activity, so the chemistry calculations are more challenging and require more computational resources; whereas others may be essentially inert (e.g., pure air or pure fuel) and the chemistry calculations are trivial. Previous calculations [27,28] show that even for a simple two-dimensional, spatially developing, reacting, plane mixing layer, it is hard to achieve good load balancing in chemistry calculations by using ISAT without any message passing. Hence even though ISAT substantially speeds up the chemistry calculations on each processor, the overall load imbalance in the chemistry calculations among the processors severely affects the parallel efficiency and provides further opportunities to develop algorithms for more efficient chemistry calculations. The above observation motivates the development of parallel ISAT strategies with the objective of minimizing the wall clock time in the chemistry calculations. There are several viable approaches for developing parallel ISAT strategies such as parallelizing the current serial ISAT algorithm or developing distribution strategies to be used in combination with the serial ISAT algorithm. The approach taken in this study is the latter one, and it works as follows. In the parallel calculations of reactive flows, each processor maintains its own ISAT table. During the reaction fractional step, the particles on one processor may be distributed to one or more other processors, and be resolved by the ISAT tables there. Particles are dis9
tributed by message passing before and after ISAT, not within ISAT. Different distribution strategies have been developed and implemented in the software x2f mpi, namely, purely local processing (PLP), uniformly random distribution (URAN), and preferential distribution (PREF). For PLP, there is no message passing during the chemistry calculations, and particles on one processor are locally processed via the local ISAT table. For URAN, the particles in a group of processors are randomly distributed uniformly among all the processors in the group using message passing. For PREF, the particles have preference to some processors: that is, particles can only be passed to those processors that they have not visited during that step. Different parallel ISAT strategies are developed with fixed or adaptive distribution strategies. For parallel ISAT with a fixed distribution strategy, the distribution strategy (e.g., PLP, URAN , or PREF) is pre-specified by the user before a simulation, whereas for the adaptive strategy, the distribution strategy is determined on the fly based on the prediction of future performance. In this study, the performance of the various fixed or adaptive parallel ISAT strategies is investigated in the parallel PDF calculations of the oxidation of methane/air mixtures in multiple partially stirred reactors (PaSR) on a distributed-memory system. The outline of the paper is as follows. In Section 2, the partially stirred reactor (PaSR) burning a methane/air mixture is described. In Section 3, the ISAT algorithm is briefly reviewed, and the serial ISAT performance is characterized. In Section 4, the parallel calculation of reactive flows using ISAT is outlined. The different distribution strategies in the software x2f mpi are detailed. In Section 5, parallel ISAT with fixed distribution strategies are described and demonstrated, and the idea of multi-stage process is introduced. In Section 6, the methodology, the algorithm, and the performance of the adaptive strategy are presented. In Section 7, the relative performance of the parallel ISAT strategies in different computational regimes is investigated. The effect of the number of processors on the parallel ISAT performance is discussed in Section 8, and conclusions are drawn in Section 10. 10
2
Partially stirred reactor (PaSR)
The partially stirred reactor (PaSR) was used previously by Pope [1] to investigate the performance of ISAT in serial computations. It has the advantage of simplicity in terms of controlling the distribution of particle compositions, and therefore allows the performance of ISAT to be explored in different computational regimes (as demonstrated later). Moreover, the amount of computational work spent outside of ISAT (i.e., the reaction fractional step) in a PaSR calculation is negligible, which provides a more efficient use of computational resource for the study of ISAT performance. Due to its simplicity, the PaSR has been widely used to investigate combustion models and numerical algorithms [1,19,35–37]. It is similar to a single grid cell embedded in a large PDF computation of turbulent combustion. In the stochastic simulation of a PaSR based on Monte Carlo methods, at time t, the reactor consists of an even number of particles, N , with the ith particle having composition φi (t). The composition is taken to be the species specific moles (mass fractions over molecular weights) and the sensible enthalpy of the mixture. The particles are arranged in pairs: particles 1 and 2, 3 and 4, · · ·, N − 1 and N are partners. With ∆t being the specified time step, at the discrete times k∆t (k integer), events occur corresponding to outflow, inflow and pairing, which can cause φi (t) to change discontinuously. Between these discrete times, the composition evolves by a mixing fractional step and a reaction fractional step. The mixing fractional step consists of pairs (p and q, say) evolving by dφp = −(φp − φq )/τmix , dt
(1)
dφq = −(φq − φp )/τmix , dt
(2)
where τmix is the specified mixing timescale. In the reaction fractional step, each particle 11
evolves by the reaction equation dφi = S(φi ), dt
(3)
where S is the rate of change of composition given by the chemical kinetics. With τres being the specified residence time, at the discrete times k∆t, outflow and inflow consist of selecting 12 N ∆t/τres pairs at random and replacing their compositions with inflow compositions, which are drawn from a specified distribution. With τpair being the specified pairing timescale, 12 N ∆t/τpair pairs of particles (other than the inflowing particles) are randomly selected for pairing. Then these particles and the inflowing particles are randomly shuffled so that (most likely) they change partners. Between the discrete times, i.e., over a time step ∆t, the composition evolves by one mixing step of ∆t, followed by one reaction step of ∆t. In this study, the fuel considered is methane. We consider both a 16-species skeletal mechanism [38] and the GRI3.0 mechanism [3] (without nitrogen chemistry) consisting of 36 species. The pressure is atmospheric throughout. The specified time scales are τres = 1 × 10⁻² s, τmix = 1 × 10⁻³ s, τpair = 1 × 10⁻³ s, and the time step is constant with ∆t = 4 × 10⁻⁵ s. There are three inflowing streams: air (79% N2 , 21% O2 by volume) at 300 K; methane at 300 K; and a pilot stream consisting of the adiabatic equilibrium products of a stoichiometric fuel/air mixture at a temperature of 2600 K, corresponding to an unburnt temperature of 1113 K. The mass flow rates of these streams are in the ratio 0.85:0.1:0.05. The number of particles in the reactor, N , is 100. Initially, all particle compositions are set to be the pilot-stream composition. In order to explore ISAT performance in the statistically stationary state, a statistically stationary solution is first obtained, then long-run simulations are performed starting from this solution. 12
3
In situ adaptive tabulation (ISAT) for combustion chemistry
In this section, we first outline the essential concepts in the original ISAT algorithm [1]. The recent augmentations made in the new implementation of ISAT, denoted as ISAT5, are detailed in [2]. Then we characterize the performance of ISAT (ISAT5) in the serial PDF calculation of the combustion process in a statistically stationary PaSR.
3.1
ISAT concepts
The in situ adaptive tabulation algorithm (ISAT) introduced by Pope [1] is a storage and retrieval method. Briefly stated, ISAT is used to tabulate a function f (x), where f and x are vectors of length nf and nx , respectively. Consider the application of ISAT for chemistry calculations in PDF calculations of the combustion process in an isobaric PaSR. At time t, the thermochemical composition of the ith particle is represented by the nφ = ns + 1 variables φi (t). The evolution of particle composition due to reaction is treated in a separate fractional step, where the particle composition evolves (at fixed pressure and enthalpy) according to Eq. 3, i.e., dφ(t) = S(φ(t)). dt
(4)
The task in the reaction fractional step is to determine the reaction mapping R(φ0 ) ≡ φ(t0 + ∆t), which is the solution to Eq. 4 after a time-step ∆t from the initial condition φ0 = φ(t0 ) at time t0 . Here for simplicity, ∆t is taken to be a constant. Hence in the context of numerical calculations of the reaction fractional step using ISAT, x is the particle composition prior to the reaction fractional step, φ0 , and f is the particle composition after the reaction fractional step, i.e., the reaction mapping R(φ0 ) = φ(t0 + ∆t). Thus nx and nf are both vectors of length ns + 1. A function evaluation obtains the reaction mapping by 13
integrating Eq. 4. ISAT uses the ODE solver DDASAC to integrate Eq. 4 and stores the relevant information in a binary tree, with each termination node (or leaf) representing a record consisting of (among other information) the tabulation point x, the reaction mapping f , and the mapping gradient matrix A (or sensitivity matrix), defined as Aij = ∂fi /∂xj . For a given query composition xq close to a tabulated point x, from the tabulated quantities at x, a linear approximation to f (xq ), denoted as f l (xq ), can be obtained, i.e., f l (xq ) ≡ f (x) + A(x)(xq − x).
(5)
The incurred local error is simply defined as the scaled difference between the exact mapping and the linear approximation, i.e., ε =| B(f (xq ) − f l (xq )) |,
(6)
where B is a scaling matrix [1]. In addition to x, f , and matrix A, at each leaf, an ellipsoid of accuracy (EOA) is also stored. An EOA is a hyperellipsoid used to approximate the region of accuracy (ROA), which is defined to be the connected region in composition space containing x in which the incurred local error ε (defined by Eq. 6) does not exceed the user-specified error tolerance εtol . For a given query xq , ISAT traverses the tree until a leaf representing some x is reached. This value of x is intended to be close to xq . One of the following events is invoked to obtain an approximation to the corresponding function f (xq ). • Retrieve. If the query point falls within the ellipsoid of accuracy (EOA) of x, a linear approximation to f (xq ) is returned through Eq. 5. This outcome is denoted as a retrieve. • Grow. Otherwise (i.e., xq is outside of the EOA), a function evaluation is performed to de14
termine f (xq ), which is exact and returned. Moreover the error in the linear approximation is measured through Eq. 6. If the computed error is within the user-specified tolerance εtol , the EOA of the leaf node x is grown to include the query point. This outcome is called a grow. • Add. In the previous (grow) process, if the computed error is greater than εtol and the table is not full (i.e., the ISAT table has not reached the allowed memory limit), a new entry associated with xq is added to the ISAT table. This is called an add. • Discarded evaluation. If, however, the computed error is larger than εtol and the table is full, then f (xq ) obtained by the function evaluation is returned without further action. (Hence the function evaluation has no effect on the ISAT table.) This outcome is called a discarded evaluation. (It is worth emphasizing that the above are the basic ISAT processes in the original ISAT algorithm [1]. The up-to-date ISAT algorithm is detailed in [2].) Notice that the events of grow, add, and discarded evaluation all involve one function evaluation. The average CPU time to perform a function evaluation (denoted as tF ) is typically several orders of magnitude larger than the average CPU time to perform a retrieve (denoted as tR ). ISAT speeds up the chemistry calculations by obtaining the reaction mapping using retrieve whenever possible. Moreover, in a large-scale calculation, the grow and add events are in general likely only during the table building period, which typically accounts for only a small fraction of the whole simulation.
3.2
Characterization of serial ISAT performance
The adaptive strategy (described below) is based on predictions of the future computational performance of ISAT. Hence, in this section we characterize the performance of ISAT to 15
provide a basis for such predictions. When ISAT is employed for chemistry calculations in simulating reactive flows, there are many factors affecting its performance, e.g.: the stationarity of the simulation; the length of the simulation; the dimensionality of x and f ; the cost of evaluating f (x); the particular implementation of the ISAT algorithm; the user-specified ISAT error tolerance εtol ; and the user-specified memory allowed for the ISAT table. An ISAT task is defined by the function f (x), the total number of queries Q, the error tolerance εtol , the given implementation of the ISAT algorithm, and the distribution D(x) from which the ith query xi is drawn. In this study, the distribution D(x) considered is stationary (i.e., independent of i), and the simulation results in a very large number of ISAT queries, Q. We consider the case where the physical memory limits the number of ISAT table entries, A, that can be tabulated. Given an ISAT task, to understand the ISAT performance, it is important to investigate the probabilities of different ISAT events and their dependence on the allowed table entries. To characterize the ISAT performance, we consider serial PDF calculations of the statistically stationary nonpremixed methane/air combustion in a PaSR. Each is a long-run calculation resulting in a very large number of ISAT queries Q.
3.2.1
Fully developed ISAT table
When ISAT is used to facilitate chemistry calculations, initially the ISAT table is empty. During the calculation, the ISAT table is built and developed through grows and adds. For a given ISAT task, during the calculation, the probabilities of different events depend on the allowed table entries, A, and the number of queries performed, q. Let pR (q, A), pG (q, A), pA (q, A) and pD (q, A) denote the probabilities of retrieve, grow, add, and discarded evaluation 16
on the q-th query with the allowed table entries A, respectively. We have pR (q, A) + pG (q, A) + pA (q, A) + pD (q, A) = 1.
(7)
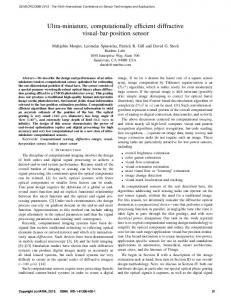
In the calculations, these probabilities can be estimated from the recorded ISAT statistics. Figure 1 shows the probabilities of different events against the number of queries from a PaSR calculation. In the early stage of the simulation, the number of add and grow events are significant and the sum of the probabilities can be more than 10%. In contrast, in the late stage of the simulation, the probability of add and grow decreases monotonically. Conceptually, the operation of ISAT in the simulation can therefore be thought of in terms of a building phase, in which the ISAT table is built and developed by grows and adds; and a retrieving phase in which adds and grows are negligible or non-existent, and essentially all queries are resolved by retrieves or discarded evaluations (if the table is full). For a very long-run calculation considered, the cost of the building phase is likely a negligible fraction of the whole simulation. Based on these observations, in the current implementation, we deem an ISAT table to be “fully developed” when pG + pA < pf d
(8)
with pf d (e.g., pf d = 10−4 ) being a user-specified threshold value. This criteria is based solely on the frequency of the add and grow events, regardless of the computational time spent in different events. Another viable criterion to be investigated is based on the fraction of time spent in grow and add. Under this criterion, an ISAT table is deemed to be “fully developed” when (pG + pA )tF < α(pD tF + pR tR ),
(9) 17
i.e., pG + pA < α(pD + pR tR /tF ),
(10)
where α is a user-specified parameter (e.g., α = 0.1), tR and tF are the average retrieve time and function evaluation time, respectively. The left-hand side of Eq. 9 is an estimate for the fraction of time in grow and add, and the term (pD tF + pR tR ) on the right-hand side is an estimate of the time in retrieve and discarded evaluation. Hence, by this criterion, the table is “fully developed” when the fraction of time spent in grow and add is relatively small.
3.2.2
Probability of function evaluation
A fundamental quantity in the understanding of ISAT performance is the probability of function evaluation pF (q, A), which is defined to be the sum of the probabilities of grow, add, and discarded evaluation, i.e., pF (q, A) ≡ pG (q, A) + pA (q, A) + pD (q, A) = 1 − pR (q, A).
(11)
(Recall that each event of grow, add, or discarded evaluation involves one function evaluation.) Notice that before the ISAT table is full, pD = 0 and hence pF = pA + pG ; after the table is full, pA = 0 and hence pF = pD + pG . The purpose here is to characterize the probability of function evaluation pF for a very long-run simulation with allowed table entries A, i.e, pF (∞, A). For a given ISAT task, during the calculation, suppose that geometrically the whole composition space can be partitioned into three regions: retrieve region, R; grow region, G; and add region A. During the calculation, these three regions R, G, and A evolve, and they depend on the allowed table entries A and the number of queries performed q. The categorization is based on how a query with a particular value of composition xq would be resolved. That 18
is, if a query xq results in a retrieve, then xq is by definition in the retrieve region R; if it results in a grow, it is in grow region G; and if it results in an add, it is in add region A. Let R(q, A), G(q, A) and A(q, A) denote the retrieve region, grow region and add region on the q-th query with allowed table entries A. The probabilities of different events pR (q, A), pG (q, A), and pA (q, A) are just the probabilities of the q-th query xq being in the regions R(q, A), G(q, A), and A(q, A), respectively. Let qf (A) be the query on which the ISAT table becomes full. Consider stopping adding at the query point q = qf (A) and continuing for an infinite number of queries. We consider the following simple model. Due to growing, the retrieve region R grows as much as it can so that for an infinite number of queries, the retrieve region R is the union of the retrieve region and the grow region when the table became full, and the grow region at q = ∞ becomes empty, i.e.,
R(∞, A) = R(qf (A), A) ∪ G(qf (A), A),
G(∞, A) = ∅.
(12)
Notice that this simple model assumes that growing does not cause the EOAs to extend into the add region, and hence any query in the add region results in a discarded evaluation. According to the model (with pA (∞, A) = 0), we have
pR (∞, A) = pR (qf (A), A) + pG (qf (A), A), pG (∞, A) = 0, pD (∞, A) = pA (qf (A), A), pF (∞, A) = pG (∞, A) + pD (∞, A) = pD (∞, A) = pA (qf (A), A).
(13)
Hence, for a very long-run simulation with allowed table entries A, the probability of function evaluation pF (∞, A) is equal to the probability of discarded evaluation pD (∞, A), which can be estimated using the probability of add pA (qf (A), A) when the table becomes full. 19
Figure 2 shows the probability of function evaluation pF , probability of add pA , and probability of grow pG from two PaSR calculations with different settings. As may be seen from the figure, the probability of grow pG becomes very small for a large number of queries, q. Hence for a very long-run simulation, the probability of function evaluation pF (∞, A) is indeed close to the probability of discarded evaluation pD (∞, A). Another important observation is that the quality of the estimation of the probability of function evaluation pF (∞, A) using the probability of add pA (qf (A), A) is case-dependent. The probability of function evaluation pF can be overestimated or underestimated by the simple model presented above. Nevertheless, as shown in Section 6, it is sufficient to use this simple model to estimate pF for a long-run simulation and make the right decisions in the adaptive strategy.
3.2.3
Power law
For a given ISAT task with a large number of queries, according to Eq. 13, the probability of function evaluation for an infinite number of queries pF (∞, A) can be estimated using the probability of add pA (qf (A), A). As revealed by the notation, pA (qf (A), A) depends only on the number of tabulated table entries. The function pA (qf (A), A) is equivalent to the function pA (q(a), a), in short, pA (a), where a is the number of tabulated entries and q(a) is the corresponding number of queries in a simulation. For a given calculation, the functional relation between pA (a) and a can be easily obtained from the ISAT statistics. Figure 3 shows the probability of add, pA , against the number of tabulated table entries, a, from a PaSR calculation. For sufficient large a, the probability of add pA decreases almost monotonically with a (within statistical fluctuation). As shown in the figure, for a sufficiently large number of table entries, the curve of pA is reasonably well represented by an inverse power law. For the particular case shown, the power is 1. For all the cases investigated in 20
the present study, the observed range of the power is from 0.5 to 1.5. (In other studies [39] where PDF calculations of the oxidation of a premixed methane/air mixture in a PaSR are performed, a power up to 1.7 is observed.) Based on these observations, the functional relation between pA (a) and a can be approximated by the following inverse power law pA (a) ∼ (ao /a)r ,
(14)
where ao and r are problem-dependent constants. To sum up, the probability of function evaluation for an infinite number of queries pF (∞, A) can be estimated using the probability of add pA (qf (A), A), which, to a good approximation, obeys the power law in Eq. 14.
3.2.4
Estimate of the average query time tQ
For a long-run calculation, the cost of the building phase is in general negligible, and in the retrieving phase essentially all queries are resolved either by retrieves or by discarded evaluations. Hence in the retrieving phase, the average CPU time for a query, tQ , can be well approximated as tQ = tR pR (∞, A) + tF pF (∞, A) = tR (1 − pF (∞, A)) + tF pF (∞, A) = tR + pF (∞, A)(tF − tR ),
(15)
where tR is the average CPU time to perform a retrieve, and tF is the average CPU time to perform a function evaluation. On the first two lines of Eq 15, the first terms on right hand side are the contributions from retrieve, and the second terms are the contributions from function evaluation. (Recall that pF (∞, A) = pD (∞, A).) The ideal ISAT performance is attained when pF (∞, A) = 0, i.e., when essentially all the queries are resolved by retrieves. Under this circumstance, the average time for a query, tQ , is equal to the retrieve time tR . 21
The variable tR is subject to fluctuations over the course of a calculation because it depends on the configuration of the ISAT table as it develops. But as shown in Fig. 4, to a good approximation, tR is a constant when the table is fully developed (i.e., after the building phase). The average CPU time for a function evaluation tF depends solely on the distribution D(x) from which x is drawn. To a good approximation, tF is a constant along the simulation as shown in Fig. 4. (However the CPU time for a single function evaluation may vary significantly over the distribution D(x), e.g., by an order of magnitude). In general, the function evaluation time tF is much larger than the retrieve time tR , e.g., by several orders of magnitude.
Figure 4 shows the average CPU times tR and tF against the number of queries. As may be seen, to a good approximation, both tR and tF are constant with tR ≈ 35µs and tF ≈ 6 × 10³ µs. For this particular case, tF is more than two orders of magnitude larger than tR . Also plotted in the figure are the query times from both the simulation and the prediction (for q → ∞) according to Eq. 15. In the prediction, pF (∞, A) is estimated using the probability of add when the table becomes full. For a large number of queries, Eq. 15 provides a reasonable estimate for the average query time.
With Eq. 15, two different computational regimes can be identified, namely the supercritical regime and the subcritical regime. In the supercritical regime, the particles can be almost always successfully retrieved from the ISAT table and the contribution from retrieve to the query time is dominant. In contrast, in the subcritical regime, the contribution from function evaluation is dominant. For a given ISAT task (with a given εtol ), which computational regime a long-run calculation is in depends solely on the allowed table entries A. To be more rigorous, we define the critical number of ISAT table entries, A∗ , implicitly by
pF (∞, A∗ ) =
tR . tF − tR
(16)
22
Thus with A∗ table entries, retrieve and function evaluation contribute equally to the average query time. Given that pF (∞, A) is a monotonically decreasing function of A, there is a unique value of A∗ satisfying this equation. With this definition, the average query time can be re-expressed as tQ pF (∞, A) =1+ . tR pF (∞, A∗ )
(17)
Evidently the storage ratio s ≡ A/A∗ determines the effectiveness of ISAT. In the supercritical regime, defined by s ≥ 1, ISAT is very effective and tQ /tR ≤ 2, i.e., within a factor of 2 of the ideal performance. In the subcritical regime, defined by s < 1, the time spent on function evaluations is significant and tQ ≈ pF (∞, A)tF ≥ 2tR . The above discussion highlights the significance of the allowed table entries A to the ISAT performance. An increase in A can effectively move the calculation from the subcritical regime to the supercritical regime, and hence greatly enhances the computational efficiency of the chemistry calculation. Figure 5 shows the average query time from two PaSR calculations with the same settings except the allowed table entries A. As may be seen, with an increase in A from 2 × 10⁴ to 6 × 10⁴ , the average query time decreases from about 300 µs to 100 µs, and the calculation shifts from the subcritical regime to the supercritical regime.
4
Parallel computations of turbulent combustion
In this study, the platform considered to perform parallel calculations is a distributed memory system with Np processors. For CFD of an inhomogeneous reactive flow with domain decomposition, the whole computational domain is decomposed into Np sub-domains and each processor performs the computation for one sub-domain. In the PaSR tests considered here, each of the Np processors is assigned its own PaSR (or PaSRs). Message passing among 23
the processors is performed using MPI 1.1 [40]. When ISAT is used for the combustion chemistry calculations, each processor has its own ISAT table. The same ISAT error tolerance εtol and allowed table entries A are specified on each of the processors. We consider the case in which the physical memory limits the maximum number of ISAT table entries A that can be tabulated on each processor. During the reaction fractional step, each processor has an ensemble of particles whose compositions after the reaction step need to be determined. In other words, each processor has an ensemble of particles that need to be resolved. For each processor, the particles originally located on the processor are referred to as local particles. In parallel computations, the following ISAT processes can be invoked to attempt to resolve a particle: • attempt to retrieve from the local ISAT table, • attempt to retrieve from the ISAT tables on remote processors, • function evaluation (through one of the events grow, add or discarded evaluation) on the local processor, • function evaluation (through one of the events grow, add or discarded evaluation) on a remote processor. Notice that the processes performed on remote processors incur extra message passing time. The retrieve attempts do not guarantee to resolve a particle, whereas function evaluation does. Another important difference between these different processes is the associated computational cost. The retrieve time may be several orders of magnitude smaller than the function evaluation time. The simplest approach to resolve particles is to have local particles processed using the local ISAT table without message passing and load redistribution. This approach is denoted as PLP/ISAT, where PLP stands for “purely local processing”. However, this simple PLP/ISAT strategy is not the computationally-optimal strategy for all chemistry calculation. The ISAT 24
performance depends highly on the number of queries and the composition distributions among different processors. Let Qα denote the number of queries on processor α. Due to the possible nonuniform distribution of computational particles among the sub-domains, the number of queries may vary significantly among processors. Let Dα (x) denote the composition distribution on processor α. Due to the possible nonuniform reaction activity among the sub-domains, the composition distribution may also vary significantly from processor to processor. The important concept, which describes the similarities of the composition distribution Dα (x) among the processors, is query overlap. The two extremes are: coincident query distributions, defined by Dα (x) being identical for each processor; and disjoint query distributions, defined by Dβ (x) being disjoint from Dα (x) for all α 6= β. For a computation using PLP/ISAT, let Pˆαβ denote the probability of queries from processor α being able to be retrieved using the ISAT table on processor β. By definition Pˆαα denotes the probability of retrieving queries from processor α using the local ISAT table on processor α. The query overlap in a calculation can be quantified by the overlap matrix L with the component Lαβ defined by Lαβ = Pˆαβ /Pˆαα ,
(18)
where the summation convention does not apply. In general, when ISAT tables are built using the PLP/ISAT strategy, queries from one processor are more likely to be retrieved from the local ISAT table than from the ISAT tables on remote processors. Hence it is reasonable to expect Pˆαβ ≤ Pˆαα and therefore 0 ≤ Lαβ ≤ 1. For the two extremes, we have Lαβ = 1 for coincident query distributions, and Lαβ = δαβ for disjoint query distributions. Four extreme computational regimes can be identified based on the composition distributions Dα (x) and the number of queries Qα among the processors, namely: coincident and uniform; 25
coincident and nonuniform; disjoint and uniform; and disjoint and nonuniform. As the name indicates, in the coincident and uniform regime, the query distributions among the processors are coincident and the number of queries is uniform among the processors. In this study, the ISAT performance in the above extreme computational regimes is investigated. To fulfill this purpose, the serial PaSR is naturally extended to the multi-processor environment through the creation of the multiple PaSR test case. In the parallel simulation of the multiple PaSR, Mr independent reactors are distributed among the Np processors with each processor having Mr /Np reactor(s), with Mr being an integer multiple of Np . For simplicity, all the cases considered below have the number of reactors equal to the number of processors, i.e., Mr = Np . The multiple PaSR test has the advantage of simplicity in terms of controlling the distribution of particle compositions D(x) and the number of queries on each processor. Therefore it allows one to explore the ISAT performance in the above different computational regimes. All the parallel calculations performed employ the GRI3.0 mechanism without nitrogen chemistry. Each reactor has three inflowing streams: air, fuel, and pilot with the mass flow rates being in the ratio 0.85:0.1:0.05. For the coincident cases presented, all the reactors are statistically identical. There are three inflowing streams: air (79% N2 , 21% O2 in volume) at 300 K; methane at 300 K; and a pilot stream consisting of the adiabatic equilibrium products of a stoichiometric fuel/air mixture at a temperature of 2600 K, corresponding to an unburnt temperature of 1113 K. For the disjoint cases presented, to make the composition distributions disjoint among the processors, by design, the above three inflowing streams on each reactor are diluted by a specified amount of Ar, i.e, on αth reactor (with α = 1, 2, · · · , Np ), each stream is diluted so that the fraction of Ar (by mass) is (α − 1)/(α − 1 + 721/50). (On the αth reactor, the air stream is diluted with Ar such that the ratio (in volume) of N2 , O2 and Ar is 79:21:5(α − 1). The fuel and pilot streams on the αth reactor are correspondingly modified such that the fractions of Ar (by mass) in these two streams are the 26
same as that of the air stream.) Also the inflowing stream temperatures on different processors change linearly, i.e, on αth reactor, the temperature of all the streams are specified at (300 + 50 × (α − 1)) K. For the case with a uniform number of queries, each reactor has 5000 particles. For the nonuniform cases, the reactor on the first processor have Np × 5000 particles while the other reactors have 5000 particles each. All the results presented below are from long-run simulations restarting from pre-obtained statistically stationary solutions (with empty ISAT tables). The ISAT error tolerance εtol and the maximum number of entries allowed A are given below for each case presented.
4.1
Software x2f mpi
In the parallel calculation, even though the straightforward PLP/ISAT strategy substantially speeds up the combustion chemistry calculations on each processor, there is usually significant load imbalance in the combustion chemistry calculations among processors, which severely affects the computational efficiency [27,28]. For example, Fig. 7 shows the wall clock time and CPU time per particle step in the reaction fractional step from a nonuniform coincident PaSR calculation. (The wall clock time and CPU time per particle step are defined as the total wall clock time and the total CPU time on each processor normalized by the average number of queries on all processors.) As may be seen, for PLP/ISAT, there is significant load imbalance due to the nonuniform queries among the processors. For the case considered, the CPU time spent by the first processor, which has the 8 times the number of queries as the other processors, is about 6 times that on the other processors, and thus the other processors have a significant amount of idle time. The above observation motivates the development of more sophisticated parallel ISAT strategies to further improve the efficiency of chemistry calculations in parallel simulations. The 27
objective is to minimize the wall clock time spent in chemistry calculations. We consider the scenario where the message passing time per particle is much smaller than the average function evaluation time TF . If not, then the PLP/ISAT strategy is optimal and there is no reason to use the parallel ISAT strategies that involve message passing. There are several viable approaches for developing parallel ISAT strategies such as parallelizing the current serial ISAT algorithm, or developing distribution strategies to be used in combination with the serial ISAT algorithm. The approach taken in this study is the latter, and it works as follows. In the parallel calculation of reactive flows, each processor has its own ISAT table. During each reaction fractional step, the ensemble of particles to be resolved on one processor may be distributed to one or more other processors using different distribution strategies, resolved by the ISAT tables there, then sent back to the original processor. The message passing happens before and after the serial ISAT algorithm is invoked, not within ISAT. Different distribution strategies have been developed and implemented in the software x2f mpi, namely, purely local processing (PLP), uniformly random distribution (URAN), and preferential distribution (PREF). For PLP, there is no message passing in the chemistry calculations, and particles on one processor are locally processed by the local ISAT table. For URAN, the particles in a group of processors are randomly distributed uniformly among all the processors in the group. For PREF, the particles have preference to some processors: that is, particles can only be passed to those processors that they have not visited during that reaction step. (For more details about PREF, see Appendix A.) One thing worth mentioning is that the various distribution strategies can be used in combination as shown below. Compared to the PLP strategy, the URAN and PREF strategies require message passing and hence extra message passing time. Also these strategies may incur synchronization penalties. However, considering that passing particles among the processors may result in much less computational cost for the resolution of particles and/or better load balancing among processors, the strategies with message passing may still have computational advantages over 28
PLP as far as the wall clock time for the reaction fractional step is concerned.
Besides the above three distribution strategies, there is one additional mode called quick try (QT), in which a retrieve attempt for all the particles is made based on the local ISAT table before using the distribution strategies in x2f mpi. Only the particles unresolved by QT are passed to x2f mpi, and therefore the number of particles requiring message passing can be dramatically reduced.
Figure 6 illustrates how parallel ISAT strategies are used in calculations of reactive flows. In a parallel calculation with Np processor, with domain decomposition the whole solution domain is divided into Np subdomains and each processor performs the computation of one subdomain. During the reaction fractional step, each subdomain has an ensemble of particles to be resolved. At the start of each reaction fractional step, QT may be invoked depending on the user’s setting. Then all the particles unresolved by QT are partitioned into one or more blocks. The blocks are looped and each block of particles is distributed among some or all of the processors based on the distribution strategy specified, and resolved using the ISAT tables there. This process continues until the particles in all the blocks are resolved. We refer to the processes to resolve each block of particles (i.e., the processes inside the “loop over blocks” in Fig. 6) as a “block sub-step”. As illustrated Fig. 6, during each block sub-step, the particles in the blocks are redistributed by x2f mpi among the processors, resolved there, and then passed back to the original processors.
The number of blocks required depends on the available physical memory and the amount of data in the unresolved particles. In general, to minimize interprocessor communication, the size of each block is preferred to be large. Passing particles among processors in small block or even singly increases the latency and synchronization penalties. For a small or medium scale calculation, a single block is in general sufficient. 29
5
Parallel ISAT with fixed distribution strategies
5.1
Parallel ISAT strategies: PLP/ISAT and URAN/ISAT
In contrast to the PLP/ISAT strategy, which has no message passing and no load redistribution, another extreme parallel ISAT strategy, referred to as URAN/ISAT, is to combine uniform random distribution (URAN) with ISAT. In this strategy, during the reaction fractional step, the particles on each processor are randomly distributed uniformly (to within one particle) among all of the processors in the simulation, so that each processor has an equal number of particles to process. The major characteristics of the two extreme ISAT strategies are as follows: • PLP/ISAT: no message passing; the local ISAT table depends on the local particle composition distribution Dk (x); load imbalance is possible due to the nonuniform intensity of chemical reactions or nonuniform distribution of computational particles. • URAN/ISAT: much message passing; the ISAT tables on the Np processors are statistically identical and depend on the union of the composition distributions on all the processors, i.e., ∪α Dα (x); load balancing is near ideal. Figure 7 shows the measured wall clock time and CPU time per particle step in the reaction fractional step from the nonuniform, coincident PaSR calculation. Due to the nonuniform distribution of the number particles among the processors (The first processor has 8 times the number of particles as the other processors), the PLP/ISAT strategy exhibits a significant load imbalance. However, in the URAN/ISAT strategy, by using the load redistribution among the processors, good load balancing is achieved. This is confirmed in Fig. 8 which shows the number of different operations in ISAT on each processor given by the two different parallel ISAT strategies. For the PLP/ISAT strategy, the first processor has a larger number 30
of queries to resolve, so the computation on this processor becomes the bottleneck of the whole simulation. In contrast, the URAN/ISAT strategy distributes the work evenly among all the processors. Compared to PLP/ISAT, even with the extra time spent in message passing, URAN/ISAT achieves a parallel speed-up factor of 3 for this particular case as far as the wall clock time is concerned. For this case, the average message passing time (two way) per particle, tC , is in the same order as retrieve time and tC ≈ 16 µs. The message passing time is measured by passing particles using x2f mpi without performing any computational work. Although the URAN/ISAT strategy guarantees good load balancing among processors, and in some computational regimes it achieves better performance than the PLP/ISAT strategy, this simple URAN/ISAT strategy is in general not the optimal strategy for minimizing the wall clock time. In the following, more sophisticated parallel ISAT strategies are proposed based on the idea of a multi-stage process.
5.2
Multi-stage process
As mentioned in Section 4, the following ISAT processes can be invoked attempting to resolve particles: attempt to retrieve from the local ISAT table; attempts to retrieve from the ISAT tables on remote processors; function evaluation on the local processor; function evaluation on a remote processor. In the multi-stage procedure, a sequence of the above different processes is invoked attempting to resolve particles with the minimum computational cost (i.e., the minimum wall clock time). The computationally cheap processes (e.g., retrieve attempts) are tried first: if the retrieve attempts fail, then computationally more expensive processes (e.g., function evaluations) are invoked to resolve particles. At each stage in a multi-stage process, URAN or PREF 31
is used to redistribute the unresolved particles among the processors. Also at each stage the ISAT processes with comparable computational cost are employed among the processors, e.g., either all try retrieve attempts or all use function evaluations. Consequently good load balancing is in general achieved at each stage and therefore in the chemistry calculations among the processors.
5.3
Multi-stage parallel ISAT strategies: QT/URAN/ISAT and PREF/URAN/ISAT
The simplest parallel ISAT strategy that employs the multi-stage process idea is called QT/URAN/ISAT, where QT stands for “quick try”. During the reaction step, in the QT stage, a retrieve attempt for particles is made based on the local ISAT table; then in the URAN stage, the particles unresolved by QT are randomly distributed uniformly among all the processors and are resolved there either by retrieves or by function evaluations. Note that in QT/URAN/ISAT, the ISAT table that develops on each processor is statistically identical and depends on the union of the composition distributions on all the processors. This is because only the URAN stage affects the ISAT table building on each processor, and in this stage all the unresolved particles are identically distributed (i.i.d.) among all the processors. In QT/URAN/ISAT, by performing QT on the local ISAT table, most particles are successfully resolved, hence the number of the particles that need to be redistributed by URAN is substantially reduced, and so also is the message passing time. Furthermore, the QT/URAN/ISAT strategy puts more effort into trying computationally cheap retrieve attempts: queries that cannot be resolved by retrieves from the local ISAT table may experience another retrieve attempt from another ISAT table on another processor instead of directly resorting to the computationally expensive function evaluation. 32
Notice that in PLP/ISAT, URAN/ISAT and QT/URAN/ISAT strategies, for each particle, retrieve attempts are made on only one or (at most) two processors. Recall that the computational cost of a function evaluation is several orders of magnitude larger than that of a retrieve. Computationally it may be worthwhile to put more effort into sending the particles among the processors and trying more attempts of retrieve. If particles can be resolved by retrieves instead of function evaluations, the wall clock time for resolving particles may still be smaller, even at the expense of extra message passing and retrieve attempts.
Based on the above reasoning, another parallel ISAT strategy, denoted as PREF(nr )/URAN/ISAT, is developed, which allows for more retrieve attempts. In this strategy, for each particle, retrieve attempts are made on at most nr processors, where nr ≤ Np is a user-specified parameter. Specifically, during each of the nr retrieve stages, a retrieve attempt is made for unresolved particles; then particles resolved by this retrieve attempt are passed back to the original processor; and the remaining unresolved particles are passed to another processor using PREF for another retrieve attempt in the next retrieve stage. The same process continues until all particles have been resolved, or the number of retrieve attempts reaches the designated number nr . In the URAN stage, all the unresolved particles are randomly distributed uniformly among all the processors and are resolved there by retrieves or function evaluations. (As discussed in Appendix A, in the first retrieve attempt, if the number of particles to be resolved is uniform or close to uniform among the processors, PREF forces the particles to try the first retrieve attempt from their local ISAT table; otherwise if particles among the processors are significantly nonuniform, PREF distributes particles uniformly among the processors and the first retrieve attempt for particles is not necessarily made on the local ISAT table.) In PREF(nr )/URAN/ISAT, the ISAT tables on the processors are statistically identical (but not independent) and depend on the union of all the composition distributions on all the processors. This is because only the URAN stage affects the ISAT table building on each processor and in this stage all the unresolved particles are identically 33
distributed (i.i.d.) among all the processors. However, an important observation is that the ISAT tables are not independent. This is because the compositions added to one table are those that could not be resolved on the nr processors visited. It is worth mentioning that the URAN/ISAT strategy described before is actually a special case (with nr = 0) of the whole class of PREF/URAN/ISAT strategies. If the number of particles to be resolved is uniform or close to uniform among the processors, PREF(1)/URAN/ISAT performs similarly to QT/URAN/ISAT. Figure 9 shows the measured wall clock time and CPU time per particle step from the uniform, coincident PaSR calculations. For this particular case, with the PLP/ISAT strategy, each processor has a significant fraction of function evaluations (about 1.2%). In contrast, with the multi-stage process, the QT/URAN/ISAT and PREF(8)/URAN/ISAT strategies make more retrieve attempts, and the wall clock time decreases even though there is more message passing and unsuccessful retrieve attempts. This is because more particles are resolved by cheap retrieves instead of expensive function evaluations. This is confirmed in Fig. 10 which shows the number of different operations in ISAT on each processor from the three different parallel ISAT strategies. On each processor, the fractions of function evaluations for QT/URAN/ISAT and PREF(8)/URAN/ISAT are about 0.9% and 0.5%, respectively. Compared to PLP/ISAT, PREF(8)/URAN/ISAT achieves a parallel speed-up factor of about 3 for this particular case as far as the wall clock time is concerned.
6
Adaptive parallel ISAT strategy
As found in [27,28] and illustrated above, none of the parallel ISAT implementations with fixed distribution strategies consistently achieves good performance in all the computational regimes. The optimal distribution strategy depends on the computational regime a calcu34
lation is in. To address this challenge, an adaptive parallel ISAT strategy is developed, in which the distribution strategy is determined on the fly based on the prediction of future calculation time in combustion chemistry. The adaptive strategy is developed based on assumed statistical stationarity (at least approximately) of a calculation.
6.1
Overview
When applying the adaptive parallel ISAT strategy for a reactive flow calculation, the number of processors Np must be an integer power of 2, and each processor maintains its own ISAT table. At the beginning of the simulation, the adaptive strategy involves up to Ms pairing stages with Ms = log2 (Np ). Initially the Np processors in the simulation are partitioned into Ng = Np groups, with each group containing a single processor. In each pairing stage, the simulation runs until either a) the ISAT tables on all the processors are fully developed, or b) the number of table entries in all the tables in one of the groups reaches a specified fraction of the number of allowed table entries. Then, based on the prediction of future calculation time, the adaptive strategy either maintains the existing grouping or forms a new grouping by pairing all of the existing groups. Thus the number of processors g in each group may double after each pairing stage. If a pairing of groups is performed at every pairing stage, then after the Ms -th stage there is only a single group containing all processors in the simulation. With the adaptive ISAT strategy, at any given moment, the simulation has Ng group(s) with g = Np /Ng processor(s) in each group. During the reaction step, the following processes are invoked to resolve particles: • Retrieve attempt(s). The ensemble of particles from each group are distributed among the processor(s) within the group and retrieve is attempted using one or more tables within the group. The distribution strategy employed is the preferential distribution (PREF). The 35
maximum number of retrieve attempts for the unresolved particles is up to the number of processors in the group, g. Synchronization within each group occurs after each retrieve attempt. • Function evaluation (through the events grow, add or discarded evaluation). Those particles that have not been resolved by retrieves, are randomly distributed evenly using the URAN strategy either within each group or among all the processors in the simulation. The unresolved particles are distributed among all the processors in the simulation to achieve good load balancing in workload if the following conditions are satisfied: all the m pairing stages have been performed; and all of the ISAT tables on all the processors are fully developed. Otherwise, the unresolved particles are distributed evenly among the processors in each group so that ISAT tables can continue to be developed based on queries from within the group.
It is worth mentioning some extreme limits of the adaptive strategy. If no group pairing is performed in any pairing stage, then after the m-th stage, there are still Np groups with each containing a single processor. In this limit, if the unresolved particles are not distributed evenly among all the processors in the simulation during the URAN stage, the adaptive parallel ISAT strategy is equivalent to the PLP/ISAT strategy. At the other extreme, if the pairing of groups is performed in every pairing stage, then there is only one single group containing all the processors in the simulation after the pairing stages. In this limit, after all of the ISAT tables are fully developed, the adaptive parallel ISAT strategy mimics the PREF/URAN/ISAT strategy with up to Np retrieve attempts. (There are subtle differences due to the difference in building the ISAT tables.)
In the following, we elaborate on the grouping algorithm. 36
6.2
Grouping algorithm
The adaptive strategy involves up to Ms = log2 (Np ) pairing stages. During the L-th pairing stage (with 1 ≤ L ≤ Ms ), the simulation has Ng groups of processors and the number of processors in each group is g (= Np /Ng ≤ 2L−1 ). For the L-th stage, the simulation runs until a) the ISAT tables on all the processors are fully developed or b) the number of table entries on each processor of one group reaches a∗L , where a∗L is the maximum number of table entries allowed on each processor during the L-th stage. In the current implementation, a∗L is specified as i h 1 2 1 L 1 L 1 1 A ( 2 ) + ( 2 ) + ...( 2 ) = 1 − ( 2 ) if 1 ≤ L < Ms
a∗L =
A
.
(19)
if L = Ms
At the end of the L-th stage, either (1) the existing grouping is maintained, or (2) a new grouping is formed by pairing all existing groups. It is worth mentioning that the above specification of a∗L is tentative. Exploring other specifications and identifying the optimal one are certainly necessary and important for further improving the adaptive strategy. The decision on if and how to perform pairings is based on the estimation of wall clock time per block sub-step for a very long-run simulation assuming the use of all the allowed 0
table entries. We denote by Ti the estimated time for group i to accomplish the combustion chemistry calculations required in a block sub-step (in a long-run simulation using all of the allowable table entries) when the groups remain unpaired. Then the estimated wall clock 37
time per block sub-step for the simulation is 0
0
Tnp = max(Ti ).
(20)
0
We denote by Tij the estimated time (per block sub-step for one block of particles for a long-run simulation using all of the allowable table entries) for the hypothetical pairing of groups i and j (i 6= j). The pairing of the existing groups is not unique. Let Pk denote the k-th pairing, and the estimated wall clock time per block sub-step for the pairing is 0
0
Tp,k = max (Tij ),
(21)
(i,j)∈Pk
where (i, j) ∈ Pk denotes all the pairs of groups (i and j) in the pairing Pk . The optimal 0
pairing among the groups is the pairing with the minimum value of Tp,k . (See Appendix B for more details about the algorithm for determining the optimal pairing.) The estimated wall clock time per block sub-step for the simulation with the optimal pairing is 0
0
Tp = min(Tp,k ).
(22)
k
0
0
If Tp is less than Tnp , the optimal pairing is used to form the new grouping for the next stage, and the number of processors in each group doubles. Otherwise, the existing grouping is maintained. 0
0
In the following two subsections, we discuss how the estimates Ti and Tij are made.
6.3
The estimated time Ti0 with no pairing
When there is no pairing, the existing grouping remains unchanged and the ISAT tables continue to develop based on the queries from within the group. During each block substep, the particles from each group are distributed among the processor(s) within the group 38
and retrieve attempts are made using the PREF distribution strategy. Those particles that have not been resolved by retrieve attempts are distributed evenly using the URAN strategy within each group and resolved by either grow, add, or discarded evaluation. For a very long-run simulation with the existing grouping, one can estimate the time spent in retrieve attempts and function evaluations separately based on the available information. Then the estimated time per block sub-step in the i -th group, Ti0 , is just the sum of these two, i.e., 0
0
0
0 0
Ti = Ni tRi,w + NF i tF i,w ,
(23)
where the first term on right hand side represents the contribution from retrieve attempts 0
and the second term represents the contribution from function evaluation. In Eq. 23, Ni is the average number of particles processed on each processor in group i in each block sub-step; 0
NF i is the estimated number of particles that need to be evaluated using function evaluation 0
0
on each processor in group i in each block sub-step; tRi,w and tF i,w are the average wall clock time per particle spent in retrieve attempts and function evaluations, respectively. 0
0
0
0
0
The quantities Ni , tRi,w , NF i and tF i,w are estimated as follows. The variable Ni is estimated as 0
Ni = Ni ,
(24)
where Ni is the average number of particles processed on each processor in group i in each block sub-step, i.e., Ni ≡ (Ni,1 + Ni,2 + ... + Ni,k + ... + Ni,g )/g
(25)
with Ni,k being the number of particles on the kth processor in the ith group in each block 0
sub-step. The variable tRi,w is estimated as 0
tRi,w = tRi,w ,
(26) 39
where tRi,w is obtained by dividing the measured wall clock time spent in retrieve attempts by the average number of particles treated per processor, i.e., Ni , during retrieve attempts in group i. Notice that tRi,w includes not only the CPU time but also the communication and synchronization times. The variable t0F i,w is estimated as t0F i,w = max(tF i,1 , tF i,2 , ...tF i,k , ...tF i,g ),
(27)
where tF i is the average CPU time per function evaluation and is extracted from ISAT statistics during the simulation. The variable NF0 i is estimated as 0
NF0 i = Ni0 pF i (∞, a0i ),
(28)
0
where pF i (∞, a0i ) is the estimation of the probability of function evaluation in group i for a long-run simulation with a0i table entries. We assume that for the long-run simulation all processors in group i have tabulated the maximum allowed table entries A. Hence a0i is given by 0
ai = gA.
(29)
From Eq. 13, the probability of function evaluation pF i (∞, a0i ) can be estimated using pF i (∞, a0i ) ≈ pAi (a0i ).
(30)
The probability of add pAi (a0i ) can be obtained through the power law Eq. 14 0
0
pAi (ai ) = pAi (ai )
Ã
ai 0 ai
!r
,
(31)
where ai is the total number of tabulated entries in the current pairing stage in group i, and the probability of add pAi (ai ) is obtained by dividing the counted number of adds by the total number of queries in group i at the step when the number of table entries in group 40
i reaches ai . The power r observed in the simulation so far is in the range of 0.5 and 2.0 and the value 1 is used in the current implementation. The effect of different values of r is investigated below.
6.4
The estimated time Tij0 with pairing
When groups i and group j are paired to form a new group, during each block sub-step, for particles from one group, retrieve attempts can be made using not only their original group’s ISAT table(s), but also the one(s) in the other group. Thus the number of retrieve attempts allowed using the PREF distribution strategy doubles. Particles that have not been resolved by retrieves are distributed evenly using the URAN strategy within all the processors in the new group and resolved by function evaluations (through the events grow, add, or discarded evaluation). For a very long-run simulation, with this new grouping, we similarly estimate the time spent in retrieve attempts and function evaluations separately, and the estimated time per block sub-step, Tij0 , is the sum of these two, i.e., 0
0
0
0
0
Tij = Nij tRij,w + NF ij tF ij,w
(32)
0
where Nij represents the estimated average number of particles processed in retrieve at0
tempts per processor when groups i and j are paired in each block sub-step; NF ij is the estimated number of particles per processor that need to be resolved by function evaluation 0
0
in each block sub-step; and tRij,w and tF ij,w are the estimated average wall clock times per particle spent in retrieve attempts and function evaluation when groups i and j are paired, respectively. 0
In the current implementation, Nij is obtained as 0
Nij = (Ni + Nj )/2,
(33) 41
which is the average number of particles processed on each processor when groups i and j 0
are paired; and tF ij,w is obtained as 0
0
tF ij,w = max(tF i,w , t0F j,w ),
0
(34)
0
where tF i,w and tF j,w are obtained through Eq. 27. 0
0
The estimations of NF ij and tRij,w are more subtle and are elaborated in the following.
6.4.1
The estimate NF0 ij of the number of function evaluations required
When groups i and j are paired to form a new group, for a long-run simulation, we denote 0
0
by ai and aj the total number of table entries tabulated in the new group based on particles from group i and group j, respectively, regardless of whether these entries are in the ISAT tables of group i or group j. For example, the table entries based on compositions from group i are not necessarily tabulated on the processors in the former group i, and may be tabulated on the processors in the former group j. We assume 0
0
(1) that ai and aj are proportional to ai and aj , respectively, i.e., 0
ai ai , 0 = aj aj
(35)
where ai and aj are the numbers of table entries in group i and group j, respectively, immediately prior to the current pairing stage. (2) that the maximum allowed number of table entries in the new group are used in a long-run simulation, i.e., 0
0
ai + aj = 2gA,
(36)
where 2g is the number of processors in the new group. 42
With these two assumptions, we have 0
ai = 2gA
ai , ai + aj
(37)
aj . ai + aj
(38)
and 0
aj = 2gA
When groups i and j are paired to form a new group, whether or not particles from one group (say group i) are able to be retrieved using the table entries added based on compositions from the other group (say group j) depends on the composition distributions D(x) on these two groups. For example, if the particle compositions in groups i and j are disjoint, then the table entries added based on compositions from group j are useless for retrieving particle compositions from group i. Let aei denote the effective number of tabulated table entries that are useful for retrieving particle compositions from group i when groups i and j are paired to form a new group. If the particle compositions in groups i and j are disjoint then 0
a ˜i = ai ;
(39)
at the other extreme, if they are coincident then 0
0
a ˜i = ai + aj .
(40)
In general, we model a ˜i as 0
0
a ˜i = ai + aj
Pij , max(Pij , Pjj )
(41)
where Pij is the probability that a particle from group i can be resolved by retrieve from the ISAT table(s) in group j, and Pjj is the probability that a particle from group j can be resolved by retrieve from the ISAT table(s) in group j. Both Pij and Pjj are obtained from 43
the statistics in the current pairing stage. (Notice that for coincident cases, Pij may be far less 0
0
than one because of the small number of table entries allowed. Simply using a ˜i = ai + aj Pij may underestimate the effective number of table entries a ˜i available for group i. The above normalization in Eq. 41 is expected to provide a reasonable prediction of a ˜i .) Similarly, we model a ˜j as 0
0
a ˜j = aj + ai
Pji . max(Pji , Pii )
(42)
Then for a long-run simulation in which groups i and j are paired, with Eq. 13 and the power law in Eq. 14, the probability of a group i particle composition requiring function evaluation is ai 0 pF i (∞, a ˜i ) = pAi (ai )( )r , a ˜i
(43)
where ai is the number of tabulated entries immediately prior to the current pairing stage in group i, and the current probability of add, pAi (ai ), is estimated by dividing the counted number of adds by the total number of queries in group i at the step when the number of tabulated table entries in group i reaches ai . Similarly, 0
pF j (∞, a ˜j ) = pAj (aj )(
aj r ). a ˜j
(44)
The number of unresolved particles after the retrieve attempts are evenly distributed among 0
the two groups’ processors and resolved by function evaluation, thus NF ij can be estimated as 0
0
NF ij
0
Ni pF i (∞, a ˜i ) + Nj pF j (∞, a ˜j ) = , 2
(45)
where Ni and Nj are the average number of particles per processor on group i and group j, respectively. 44
6.4.2
The estimate t0Rij,w of the retrieving time
When groups i and j are paired, retrieve attempts can be made for particles using not only their original group’s ISAT table(s) but also the one(s) paired with the group. The average wall clock time per particle spent in retrieve attempts, tRij,w , for a long-run simulation after pairing is difficult to estimate. There is no trivial functional relation between tRij,w and tRi,w and tRj,w , where tRi,w and tRj,w are the measured average wall clock times per particle spent in retrieve attempts for particles within group i and within group j in the current pairing stage, respectively. To illustrate the complicated relationship between tRi,w , tRj,w and tRij,w , we perform the following PaSR tests. For each PaSR test, two initially identical simulations (each having two groups with one processor in each group) run until the criterion for pairing is reached. Then the two simulations, one with forced pairing between these two groups and the other one with no pairing, continue to run for a sufficiently long time. At the same time, the wall clock time spent in retrieve attempts is measured, and by normalizing the wall clock time by the average number of particles processed, the average retrieve time per particle can be obtained. Figure 11 shows measurements of tRi,w , tRj,w and tRij,w from two uniform PaSR tests, one being coincident and the other one being disjoint. The figure shows the results only after pairing or not (i.e., not prior to the pairing criterion being satisfied). As may be seen from the figure, for the coincident case, tRij,w is slightly larger (about 25%) than tRi,w and tRj,w . However for the disjoint case, tRij,w is much larger (about 60%) than tRi,w and tRj,w . Hence when groups i and j are paired, the retrieving processes among the processors in these two groups are nontrivial and consequently tRij,w is difficult to estimate. Currently, we estimate t0Rij,w by modelling the retrieving processes through the following two-step process. (1) In the first step, retrieve attempts are made on half of the particles from one group (say 45
group i) and half of the particles from the other group (say group j), using the ISAT tables in the group (say group i). The non-local particles are sent by message passing. Specifically, in the first step, the number of particles that need to be processed by each processor in group i and group j is NRi,1 = NRj,1 =
N i + Nj . 2
(46)
The computational time spent in this step in group i can be estimated as Ii =
Ni Nj Nj tRi,w + tRj→i,w + tC , 2 2 2
(47)
where tRj→i,w is the measured average wall clock time per particle for particles from group j spent in retrieve attempts in group i which is obtained from statistics in the current pairing stage, and tC is the average two-way communication time per particle. Similarly for Ij , we have Ij =
Nj Ni Ni tRj,w + tRi→j,w + tC . 2 2 2
(48)
(2) In the second step, retrieve attempts are made on the unresolved particles from the first step based on the ISAT tables in the other group. Hence in this step each group in the potential pairing needs to process the unresolved particles from the other group. The number of particles treated per processor in group i in this step is NRi,2 =
Ni Nj (1 − Pij ) + (1 − Pjj ), 2 2
(49)
where Pij is the probability that a particle composition from group i can be retrieved from ISAT table(s) in group j. Similarly for NRj,2 we have NRj,2 =
Nj Ni (1 − Pji ) + (1 − Pii ). 2 2
(50)
The computational time spent in this step on group i can be estimated as IIi =
Nj Nj Ni (1 − Pij )tRi,w + (1 − Pjj )tRj→i,w + (1 − Pjj )tC , 2 2 2 46
(51)
where the first two terms on the right hand side are the contribution from the retrieve attempts and the last term is the message passing time. Similarly, we have IIj =
Nj Ni Ni (1 − Pji )tRj,w + (1 − Pii )tRi→j,w + (1 − Pii )tC . 2 2 2
(52)
0
The average wall clock time per particle spent in retrieve attempts, tRij,w , can be obtained as 0
tRij,w =
max(Ii , Ij ) + max(II i , II j ) . (Ni + Nj )/2
(53)
0
Also shown in Fig. 11 are tRij,w , the estimated wall clock times per particle in retrieve attempts for the hypothetical pairing between group i and j based on the above two-step empirical procedure for the two uniform cases. As may be seen, for both the coincident and disjoint cases considered, there is good agreement between the measured and estimated wall clock time in retrieve attempts when two groups are paired. For the test cases considered, the above two-step procedure is sufficient for estimating t0Rij,w . It is worth mentioning that the above two-step process is the first attempt to model the complicated retrieving processes among the processors in two groups when they are paired. When computational particles among the processors are significantly nonuniform, during each retrieve attempt, PREF distributes the unresolved particles uniformly among the processors in the two groups; and to a good approximation, half of the unresolved particles from one group are processed by local ISAT tables and another half are processed by remote ISAT tables on the processors in the other group. Therefore for the highly nonuniform cases, the retrieves attempts is realistically (to some extent) represented by the above two-step process. However for the uniform (or close to uniform) cases, PREF forces particles to attempt retrieving from the local table first, and the assumption in the two-step procedure “half of the particles from one group are processed by remote ISAT tables in the other group” is far from realistic. Nevertheless, while not realistic, as shown in Fig. 11, for the uniform test 47
cases considered, the two-step procedure gives a sufficiently good estimate of t0Rij,w . Further exploring and understanding the complicated retrieving processes among the processors in two groups is certainly necessary.
6.5
0 Appraisal of the estimates Tp0 and Tnp
In this subsection, we appraise the above proposed approaches for estimating Tp and Tnp , which are the wall clock times per block sub-step, by making measurements in long-run simulations when there is pairing and no pairing, respectively. We perform the following PaSR tests. For each PaSR test, two initially identical simulations (each having two groups with one processor in each group) run until the criterion for pairing is reached. We then estimate Tp and Tnp based on the approaches described in Section 6.2. Then the two simulations, one with forced pairing between these two groups and the other one with no pairing, continue to run for a sufficiently long time. Based on these two long runs, Tp and Tnp are measured. 0
0
The estimates are then appraised by comparing the estimated times Tp and Tnp with the measured times Tp and Tnp , respectively. 0 It should be appreciated that the estimates Tp0 and Tnp are used solely to make the binary
decision of whether to pair or not. Consequently, it is not essential for the estimates to be quantitatively accurate. Rather, it is important that if Tp is significantly greater or less than 0 Tnp , then, correspondingly, Tp0 is greater or less than Tnp . In this way, the correct pairing
decision is made in the circumstances where the decision makes a significant difference. Figure 12 shows the measured and estimated wall clock times in the reaction fractional step from two uniform PaSR calculations, one being coincident and the other one being disjoint. Figure shows the results only after pairing or not (i.e., not prior to the pairing criterion being 0
0
satisfied). As may be seen, for the coincident case, the estimated quantities Tp and Tnp are 48
Table 1 Effect of r on estimated wall clock time (s) per block sub-step from uniform coincident PaSR calculation with εtol = 1 × 10⁻⁴ and A = 2 × 10³ 0 (s) Tnp
Tp0 (s)
measured
4.2
3.1
estimated (r = 0.5)
4.2
2.9
estimated (r = 1.0)
3.0
1.6
estimated (r = 1.5)
2.1
0.9
lower than the measured ones. The main reason is that the estimated percentages of function evaluation are lower than the observed ones. This is confirmed in the Fig. 13 which shows the estimated and measured percentages of function evaluations (averaged over the processors) for both pairing and no pairing. Nevertheless, the estimation procedure correctly predicts that pairing leads to significantly reduced wall clock time (compared to not pairing). For the disjoint case, there is good agreement between the estimated and measured times. For this particular case, the decision on whether to pair or not is not significant because the calculations with and without pairing achieve comparable computational performance. Recall that in the adaptive strategy, one key ingredient is the power law, i.e, Eq. 14, which is used to estimate the percentage of function evaluations for a long-run simulation. The exponent r in the power law is case-dependent and is not known a prior. For all the cases investigated in the present study, the observed range of the exponent is from 0.5 to 1.5. In the current implementation of the adaptive strategy, we fix r to be 1. Table 1 shows the measured and estimated (with different values of r) wall clock times per block sub-step from a uniform coincident PaSR calculation. As may be seen from the table, 49
a particular specification of r affects the estimates of Tp and Tnp , but nevertheless it does not affect the decisions on pairing in the adaptive strategy: for all the values of r, Tnp is larger than Tp and the adaptive strategy makes the correct pairing decision.
7
Investigation of different parallel ISAT strategies in extreme computational regimes
Here we focus on investigating the relative performance of different parallel ISAT strategies in different extreme computational regimes: namely, coincident and disjoint query distributions both with uniform and nonuniform numbers of queries. These extreme circumstances correspond to extreme nonuniform distributions of reaction activity and computational particles among the sub-domains. The parallel ISAT strategies investigated here are PLP/ISAT, URAN/ISAT, QT/URAN/ISAT, PREF(8)/URAN/ISAT and the adaptive strategy. The decisions of the adaptive strategy in each stage for each case considered are listed in Table 2.
7.1
Coincident query distributions, uniform number of queries
In this regime, the composition distributions D(x) are identical among the processors. Suppose that the chemistry calculation is performed locally, i.e., without message passing and load redistribution among the processors. As in Section 3, we can define a critical number of table entries A∗ , which is identical on each processor. Based on A∗ and the number of processor Np , this regime can be further categorized as • Locally supercritical. The problem is supercritical if s ≡ A/A∗ > 1. In this regime, the ISAT table on each processor is very effective, and the particles can almost always be successfully retrieved from the local ISAT table. Thus, the PLP/ISAT strategy is almost certainly optimal among all the ISAT strategies. 50
Table 2 Decision of adaptive strategy in each stage for different cases Case
Stage 1
Stage 2
Stage 3
particle distribution
composition distribution
εtol
A
uniform
coincident
8 × 10⁻⁴
2000
pair
pair
not pair
uniform
coincident
5 × 10⁻⁴
1000
pair
pair
not pair
uniform
coincident
1 × 10⁻⁴
2000
pair
pair
pair
nonuniform
coincident
8 × 10⁻⁴
2000
pair
pair
pair
nonuniform
coincident
5 × 10⁻⁴
1000
pair
pair
pair
nonuniform
coincident
1 × 10⁻⁴
2000
pair
pair
pair
uniform
disjoint
8 × 10⁻⁴
2000
not pair
not pair
not pair
uniform
disjoint
5 × 10⁻⁴
1000
pair
pair
not pair
uniform
disjoint
1 × 10⁻⁴
2000
pair
pair
not pair
nonuniform
disjoint
8 × 10⁻⁴
2000
not pair
not pair
not pair
nonuniform
disjoint
5 × 10⁻⁴
1000
pair
not pair
not pair
nonuniform
disjoint
1 × 10⁻⁴
2000
pair
pair
pair
• Globally supercritical. The problem is defined to be globally supercritical if the product Np × s is greater than unity and s is less than 1, i.e., A < A∗ < Np A). This means that, among all the processors there is sufficient storage to tabulate the accessed compositions in the simulation. For this regime, PLP/ISAT is likely to be inefficient, because the problem is locally subcritical and PLP/ISAT requires more function evaluations than multi-stage 51
strategies. • Globally subcritical. The problem is globally subcritical if the product Np s is less than 1 (i.e., Np A < A∗ ). Again PLP/ISAT is clearly inefficient, because the problem is globally subcritical and a substantial amount of function evaluations is required. The wall clock time can be substantially reduced by attempting to retrieve from more ISAT tables. Figure 14 shows the results from the calculations of the uniform coincident PaSR cases with different specifications of the ISAT error tolerance and the allowed number of ISAT table entries. The calculations from the top to the bottom in the figure are designed to be from relatively easy to hard by varying εtol and A. Consequently, as shown, for the PLP/ISAT strategy, the normalized number of function evaluations gradually increases from the top to the bottom. For all the cases considered here, URAN/ISAT gives comparable CPU time to PLP/ISAT, but requires a little more wall clock time because of message passing. With quick try, QT/URAN/ISAT substantially improves the performance (by more than 30%) compared to URAN/ISAT. The easiest case investigated here is close to the locally supercritical regime, and the ISAT table on each processor is sufficiently effective. Thus the performance of PLP/ISAT is comparable (within 20%) to the other parallel ISAT strategies (i.e., QT/URAN/ISAT, PREF/URAN/ISAT and the adaptive strategy). However, as the problem becomes harder, the performance of PLP/ISAT becomes worse. This is simply because the PLP/ISAT strategy does not take advantage of ISAT tables on other processors, thus it results in a relatively large amount of function evaluations. For the hardest problem investigated here, the wall clock time by PLP/ISAT is about 3 times that of PREF(8)/URAN/ISAT or of the adaptive strategy. Another observation is that PREF(8)/URAN/ISAT and the adaptive strategy yield comparable performance (within 5%) for the cases considered here. In this regime, the adaptive strategy performs pairing twice for the two relatively easy cases and three times for the hardest case. 52
7.2
Coincident query distributions, nonuniform number of queries
In this regime the major factor affecting the computational efficiency is the load balancing issue due to the nonuniform number of queries among the processors. For the cases presented below, the first processor has 8 times the number of particles as the other processors. Similar to the uniform coincident regime, this regime can be further categorized as: locally supercritical, globally supercritical and globally subcritical. Now, even in the locally supercritical regime, due to the load imbalance, PLP/ISAT is not necessarily optimal among all the ISAT strategies. Figure 15 shows the results from calculations of nonuniform coincident PaSR cases with different specifications of the error tolerance and of the number of ISAT table entries allowed. Similarly, the calculations from the top to the bottom run from relatively easy to hard, as evidenced by the fact that the normalized number of function evaluations in PLP/ISAT gradually increases. In this regime, due to the nonuniform distribution of particles among the processors, the PLP/ISAT strategy exhibits a significant load imbalance and performs poorly: the first processor takes much more CPU time than the other processors, so the other processors have significant idle time. The performance of PLP/ISAT gets worsens as the problem becomes harder. As expected, the strategies with load redistribution among the processors significantly improve the computational performance. For example, even for the easiest case, URAN/ISAT, PREF(8)/URAN/ISAT and the adaptive strategy achieve comparable performance, which is about 80% faster than PLP/ISAT. (For this highly nonuniform case, PREF(8)/URAN/ISAT and the adaptive strategy uniformly distribute particles among processors even in the first retrieve attempt.) Also, as shown for the easiest case, QT/URAN/ISAT gives poor performance (similar to PLP/ISAT), and is significantly worse than URAN/ISAT. This is due to the significant load imbalance in the quick try mode, and is in contrast to the beneficial effect of QT in the uniform case (Fig. 14). As the problem 53
gets harder and the contribution of function evaluations becomes significant, compared to PLP/ISAT and URAN/ISAT, the performance of QT/URAN/ISAT is significantly improved due to the extra retrieve attempt, which results in more particles being resolved by cheap retrieves. Also as the problem gets harder, PREF(8)/URAN/ISAT and the adaptive strategy show greater advantages over URAN/ISAT and QT/URAN/ISAT which attempts to retrieve from only one or two (at most) tables. As it can be seen from Table 2, in this regime, for all the three cases considered, the adaptive strategy performs pairing three times and there is only one single group containing all the 8 processors after the pairing stages. For all three cases considered, PREF(8)/URAN/ISAT and the adaptive strategy yield similar performance, and for the hardest case, they yield a speed-up factor of about 30 compared to PLP/ISAT.
7.3
Disjoint query distributions, uniform number of queries
The essential feature of having disjoint query distributions is that an ISAT table built on one processor using PLP/ISAT has no value in enabling queries from other processors to be retrieved. Also the function evaluation time may vary significantly from processor to processor. When using the PLP/ISAT strategy, load imbalance may arise due to the nonuniform reaction activity among the processors. Figure 16 shows the results from the calculations of the uniform disjoint PaSR cases with different specifications of the error tolerance and of the number of ISAT table entries allowed. Again, the calculations from the top to the bottom run from relatively easy to hard, as evidenced by the fact that the normalized number of function evaluations in PLP/ISAT gradually increases. For the disjoint cases considered here, the conditions of inflowing streams for each reactor are set so that each reactor has intense reaction. However, particle compo54
sitions on each reactor come from the different parts of the composition space and there is no overlap. In this regime, as may be seen from the figure, PLP/ISAT yields relatively good performance since an ISAT table only processes the local particles and only tabulates a particular part of composition region based on the local particles. In contrast, the URAN/ISAT strategy needs to tabulate a much wider composition region in each table with limited memory since each processor can encounter some particles from other processors. As may be seen, the performance of URAN/ISAT becomes very poor (about 4 times slower than PLP/ISAT) for the hardest problem considered here. Similarly, QT/URAN/ISAT performs poorly for all the cases considered. The figure also shows that PREF(8)/URAN/ISAT performs poorly, especially for the relatively easy cases. The reason is similar to the one for URAN/ISAT: it needs to tabulate a wider composition region on each table with limited memory. Another important observation is that in this regime, by properly grouping processors and possibly taking advantage of ISAT table(s) from other processor(s), the adaptive strategy shows consistently good performance for all the three cases considered here. For the easiest case, no pairing is performed (see Table 2) and the adaptive strategy approaches the PLP/ISAT limit. For the two relatively difficult cases considered, the adaptive strategy performs pairing in the first two pairing stages.
7.4
Disjoint query distributions, nonuniform number of queries
The nonuniform disjoint cases are constructed by specifying the first processor to have 8 times the number of particles as the other processors with the stream settings being the same as the uniform disjoint cases. The calculations from the top to the bottom in Fig. 17 again run from relatively easy to hard. Figure 17 shows the results from the calculations of the nonuniform disjoint PaSR cases with 55
different specifications of the error tolerance and the number of table entries allowed. In this regime, as may be seen from the figure, PLP/ISAT, URAN/ISAT, and QT/URAN/ISAT generally have poor performance. In contrast, PREF(8)/URAN/ISAT generally yields the best performance. For the easiest case considered, PREF(8)/URAN/ISAT outperforms the other three strategies by saving 25% to 35% wall clock time. Another key observation is that the performance of the adaptive strategy gradually improves when the problem becomes harder. For the easiest case, no pairing is performed in the adaptive strategy and it achieves performance comparable to PLP/ISAT. As the problem becomes harder, to distribute the expensive function evaluations among the processors and speed up the calculation, the adaptive strategy performs pairing once for the intermediate case and three times for the hardest case, respectively. For the hardest case considered, the adaptive strategy slightly outperforms PREF(8)/URAN/ISAT and both are about 3 and 4 times faster than URAN/ISAT and PLP/ISAT, respectively. As mentioned, for the easiest case, no pairing is performed in the adaptive strategy. Throughout the calculation, ISAT tables are not fully developed based on the current criterion adopted. Based on the current procedure for the URAN stage (see Section 6.1), during the URAN stage, expensive function evaluations are performed locally without redistribution among the processors. (For this case, the adaptive strategy is equivalent to PLP/ISAT.) This significantly deteriorates the performance due to the load imbalance of expensive function evaluations in the URAN stage as shown in Fig. 17. To determine the optimal procedure for the URAN stage and hence to further improve the adaptive strategy is left to future work. To further investigate whether or not the adaptive strategy makes the right pairing decision for this easiest case, the following three calculations are performed, where forced pairing is made at the first pairing stage, at both first and second pairing stages, and at all three pairing stages. The calculations then continue to run with the forced pairing for a sufficiently long time. Figure 18 shows the performance of these three calculations together with the 56
performance of the adaptive strategy (which results in no pairing). As shown, the computational performance degrades as more pairings are performed, which implies that the adaptive strategy makes the right pairing decision for this easiest case. Another interesting observation is that the performance of the calculation with three forced pairings is much worse than that of PREF(8)/URAN/ISAT. Recall that the only differences in the calculations with three forced pairings and with PREF(8)/URAN/ISAT are due to the difference in building the tables. This implies that the performance of a particular parallel ISAT strategy may strongly depends on how the ISAT tables are built among the processors. To understand the effect of table building and hence to further improve the adaptive strategy is left to future work.
8
Effect of the number of processors on the parallel ISAT performance
In this section, we investigate the dependence of the parallel ISAT performance on Np , i.e., the number of processors used in the multi-PaSR calculations. In particular, we investigate the parallel scaling of the adaptive ISAT strategy and the PLP/ISAT strategy on the Velocity 3 cluster at the Center for Advanced Computing at Cornell University. The parallel calculations are performed by maintaining the problem size on each processor constant (i.e., a fixed number of reactors on each processor, which is 1 in all the calculations) while varying the number of processors. Calculations were conducted for 8, 16, 32 and 64 processors. Figure 19 shows the wall clock time and CPU time per particle step against the number of processors in both the PLP/ISAT and adaptive strategies for the uniform coincident cases. Unsurprisingly, the CPU time and wall clock time for the PLP/ISAT remain almost constant over the number of processors considered. However it is interesting to observe that the CPU time and wall clock time for the adaptive strategy also remain almost constant. The reason is 57
that the performance of the adaptive strategy is mainly controlled by the number of pairings performed (i.e., the number of processors in each group), not the number of processors used in the calculation. For the calculations run on 8, 16, 32, and 64 processors, the adaptive strategy performs 3, 3, 4, and 4 pairings, respectively. As may be seen, the wall clock time ratio between these two strategies (about 2) remains almost constant over the number of processors considered, which implies that the adaptive strategy has good scalability up to 64 processors for the case considered here.
9
9.1
Discussions and future work
Primary retrieve and secondary retrieve
In ISAT5 [2], retrieve attempts consist of two different retrieve procedures, namely primary retrieve and secondary retrieve. During a retrieve attempt, ISAT first traverses the binary tree and possibly scans two list-based data structures [2,39] (which store the most frequently used and the most recently used tabulated entries) to check if the query point lies within the EOA of a tabulated point. The query is resolved if it is in any identified EOA and a linear approximation to the solution is returned. This outcome is a primary retrieve. Otherwise, ISAT tests more EOAs of tabulated points, attempting to find an EOA containing the query point. The query is resolved if it is in any identified EOA and a linear approximation to the solution is returned. This outcome is a secondary retrieve. The maximum amount of secondary retrieving attempted is controlled so that the CPU time spent on it (in a given query) is less than a specified fraction of the average CPU time per function evaluation. It is worth mentioning that the computational cost associated with primary retrieve and secondary retrieve may be quite different, e.g., the CPU time per retrieve in secondary retrieve may be orders of magnitude higher than that of primary retrieve. 58
In the multi-stage parallel ISAT strategies, due to the difference in computational cost, it is possible to introduce load imbalance in the PREF rounds when primary and secondary retrieves are used in combination in the retrieve attempts, which may significantly deteriorate the parallel ISAT performance. (Such phenomena are not observed in the current PaSR calculations due to the small tables used and the relatively easy problem considered.) The approach to solve the above issue is to separate primary retrieve attempts and secondary retrieve attempts into different PREF rounds. Instead of performing retrieve attempts with primary retrieve and secondary retrieve combined together, an alternative way is to perform attempts of primary retrieve first and then perform attempts of secondary retrieve with both using the PREF distribution strategy. This separate strategy will be investigated in PDF calculations of realistic flames.
9.2
Quick try (QT)
As mentioned, the advantage of performing QT is that it can significantly reduce the number of unresolved particles requiring message passing. However if the time spent in QT among processors is significantly different, then it can introduce significant load imbalance during this process. The load imbalance in QT may be caused by the nonuniform distribution of particles among processors (as shown in Fig 15) or the way of retrieve attempts in QT. Currently it is still not clear how the optimal QT should be performed. Should it be based on primary retrieve or the combination of primary retrieve and secondary retrieve? Is it possible to adaptively determine how much QT is optimal (i.e., none, primary retrieve, or combination of primary retrieve and secondary retrieve)? For the results reported above, the combination of primary retrieve and secondary retrieve is used in QT. In the current parallel ISAT implementation, QT need to be manually speci59
fied by users (either based on primary retrieve or the combination of primary retrieve and secondary retrieve). As long as memory is not a primary consideration, QT should not be invoked for the PREF strategies and the adaptive strategy. This is due to the following reasons. In the first retrieve attempt in PREF, if the number of particles to be resolved is uniform or close to uniform among the processors, PREF forces the particles to try the first retrieve attempt from their local ISAT table. Hence it is equivalent to QT. Otherwise if particles among the processors are significantly nonuniform, PREF distributes particles uniformly among the processors and the first retrieve attempt for particles is not necessarily made on the local ISAT table. Under this circumstance, QT should not be invoked as PREF does considering the load balancing.
9.3
The number of table entries allowed on the L-th stage a∗L
The number of table entries allowed for each processor on the L-th stage, a∗L , is an important parameter in the adaptive strategy which may affect parallel ISAT performance. There are various ways to specify it. With the current specification given by Eq. 19, most of the table entries are tabulated based on local particles during the first pairing stage, which are considered more useful than those tabulated during later stages for a statistically stationary problem. The advantage of this specification is as following: the local tables contains significant amount of local composition information; thus instead of passing large number of particles and trying to retrieve from remote ISAT tables on the other processors, significant fractions of particles can be resolved by using the local ISAT table; hence the amount of particles requiring message passing are significantly reduced. The disadvantage of this specification is that the ISAT tables may contain significant amount of redundant information, hence the assigned ISAT storage has not been fully utilized. An alternative way to build the ISAT tables and to make better usage of the allowed mem60
ories, is as follows. In the L-th stage of the Ms = log2 (Np ) pairing stages, the simulation runs until a) the ISAT tables on all the processors are fully developed or b) the number of table entries on each processor of one group reaches a∗L = A, i.e., the table is full. At the end of the L-th stage, after the pairing decision is made, all the ISAT tables are deleted and then rebuilt by using PREF(g)/URAN/ISAT with g determined from the adaptive strategy. The disadvantage of this specification is that it spends significant amount of extra time in building ISAT tables. However considering extremely long run simulations where the time spent in building tables is negligible, rebuilding ISAT tables for better future usage may still be beneficial. This specification is worthy of further investigation.
9.4
Application to a very large number of processors
The current study demonstrates good scalability for the adaptive strategy up to 64 processors. Whether or not this strategy is able to perform consistently well with even a larger number of processors (e.g., 104 or 105 ) remains a question and needs to be further investigated. Several limitations in the current adaptive algorithm are • The adaptive strategy requires the computations of Pij and tRj→i,w . To compute them requires at least O(Np2 )) operations, which is inefficient for large Np . • The adaptive strategy requires pairing among groups. The algorithm current used (see Appendix B) for determining optimal pairing among groups runs in O(Np3 log(Np )). The pairing process is inefficient for large Np . • For large Np , with a large number of pairing stages, the pairing phase in the adaptive strategy may take a significant fraction of the simulation time. One possible approach to solve the above limitations is that for a simulation with large Np , at the beginning of the simulation one can partition the Np processors into several groups 61
with each group having a smaller number of processors (e.g., 64) and then apply the adaptive strategy in each group. Another limitation with the current adaptive strategy is that the number of processors used in the simulation, Np , needs to be an power integer of 2. Extension of the strategy to the general number of processor needs to be further considered.
10
Conclusion
The in situ adaptive tabulation (ISAT) algorithm [1] has been widely used for the efficient calculation of combustion chemistry in simulations of reactive flows. When it is employed for combustion chemistry in a parallel calculation, even though ISAT substantially speeds up the chemistry calculation on each processor, the overall load imbalance in the chemistry calculations among the processors severely affects the computational efficiency. To further improve the efficiency in chemistry calculations in parallel calculations, in this work, the original serial ISAT algorithm is extended to the multi-processor environment. The platform considered to perform parallel calculations is a distributed memory system. Message passing among the processors is performed using MPI. The whole computational domain is decomposed into sub-domains using domain decomposition, and each processor performs the computation for one sub-domain. Parallel ISAT strategies have been developed via the use of different distribution strategies combined with the serial ISAT algorithm. In calculations with a parallel ISAT strategy, each processor has its own ISAT table. During the chemistry calculation, particles on one processor may be distributed to one or more other processors by distribution strategies, and be resolved by the ISAT tables there. Particles are distributed by message passing before and after the serial ISAT algorithm, not within ISAT. Three different distribution strategies have been 62
developed and implemented in the software x2f mpi, namely, purely local processing (PLP), uniformly random distribution (URAN), and preferential distribution (PREF). For PLP, there is no message passing in the chemistry calculations, and particles on one processor are locally processed by the local ISAT table. For URAN, the particles in a group of processors are randomly distributed uniformly among all the processors in the group using message passing. For PREF, the particles have preference to some processors, that is particles can only be passed to processors that they have not visited previously during that reaction step. The above three different distribution strategies can be used in combination. Different parallel ISAT strategies are developed with fixed or adaptive distribution strategies. For parallel ISAT with fixed distribution strategies, the distribution strategy is pre-specified by the user before a calculation, whereas for the adaptive strategy, the optimal distribution strategy is determined on the fly based on the prediction of future simulation time. For all the parallel ISAT strategies, computational efficiency in the chemistry calculations is achieved through the use of the multi-stage processes and load re-distribution among processors using MPI. The ISAT performance for chemistry calculations depends highly on the number of queries and the composition distributions among the processors. The relative performance of different parallel ISAT strategies are investigated in four extreme computational regimes, namely, coincident query distributions with uniform and nonuniform numbers of queries, and disjoint query distributions with uniform and nonuniform number of queries. To fulfill this purpose, the serial PaSR is extended to the multi-processor environment, and the parallel PDF calculations of multiple partially stirred reactors burning methane/air mixtures are performed. The multiple PaSR test has the advantage of simplicity in terms of controlling the distribution of particle compositions D(x) and the number of queries on each processor. The results show that the performance of the parallel ISAT strategies with fixed distribution 63
strategies depends strongly on the computational regimes in which the problem is located; no single fixed strategy consistently achieves good performance in all computational regimes. For example, PREF/URAN/ISAT and URAN/ISAT perform poorly in the uniform disjoint regime, whereas the PLP/ISAT performs poorly in the nonuniform coincident regime. In contrast, the adaptive ISAT strategy yields reasonably good performance in all regimes. Compared to the PLP/ISAT strategy, where the chemistry calculation is essentially serial, a speed-up factor of up to 30 is achieved by the adaptive parallel ISAT strategy. The study also demonstrates that the adaptive strategy has very good parallel scalability. It is worth mentioning that the software x2f mpi, with different distribution strategies implemented, can be used for efficient general function evaluations in parallel calculations .
Acknowledgements
This research was conducted using the resources of the Cornell University Center for Advanced Computing, which receives funding from Cornell University, New York State, the National Science Foundations, and other leading public agencies, foundations, and corporations. This work is supported by the National Science Foundation under Grant No. CBET-0426787.
A
Preferential distribution (PREF) algorithm
We consider B batches of particles, resident on P processors. (When PREF is used in the adaptive ISAT strategy, P is the number of processors in each group, i.e., g. Otherwise, P is the number of processors in the calculation, i.e., Np .) There are Nb particles in batch b with 1 ≤ b ≤ B. We define an indicator matrix K of dimension B × P . The components of K have values 0 or 1. Batch b can be processed on processor p only if Kbp equals 1. The task is 64
to assign particle batches to valid processors in such a way that (as nearly as possible) each processor is assigned the same number of particles. We define the following quantities in the algorithm: ¯ = PB Nb /P is the average number of particles to be assigned to each processor • N b=1 • Mb is the number of particles in batch b yet to be assigned; initially Mb = Nb ¯ • Vp denotes the vacancies on processor p; initially Vp = N • Jbp = 1 if some particles in batch b can be assigned to processor p; initially J = K • Fp ≡
PB
b=1
Jbp Mb /Vp is the average number of particles per vacancy that could be assigned
to processor p • Ab ≡
PP
p=1
Jbp Vp /Mb is the average number of available vacancies per particle in batch b.
The strategy employed is as follows. 0
1) Selection of p. Processor p is first selected such that Fp ≤ Fp0 for all p such that Jbp0 = 1 for some b. A processor with a small value of Fp means that the number of particles eligible to visit this processor is relatively small, and in order to distribute all the particles and at the same time (if possible) guarantee load balancing, it is desirable to assign particles to this processor first. 0
2) Selection of b. Batch b is then selected such that Ab ≤ Ab0 for all b such that Jb0 p = 1. A batch with a small value of Ab means that the number of processors eligible for the particles (in the batch) to visit is relatively small, and in order to distribute all the particles and at the same time (if possible) guarantee load balancing, it is desirable to distribute these particles first. After selection of b and p, Mb , Vp and Jbp are updated as follows:
65
if Mb ≤ Vp : assign all Mb particles to processor p Vp ← Vp − Mb , adjust count of vacancies Mb = 0, no more particles to assign J(b, :) = 0, no more particles in batch b if Vp = 0, J(:, p) = 0 no more particles can be assigned to p otherwise (i.e., Mb > Vp ) assign Vp particles from batch b to processor p Mb = Mb − Vp , adjust the number of particles yet to be assigned Vp = 0, no more vacancies J(p, :) = 0, no more vacancies on processor p The process is repeated until the maximum component in J is 0. Notice that for some cases, some particles may be unassigned at the end. In order to assign all of the particles, the ¯ on each processor is increased. Currently N ¯ is increased by 8% each time the vacancy size N strategy does not assign all of the particles. A similar strategy can be defined by selecting b first, and then p (rather than vice versa). It is found that there is no significant difference in terms of performance between these two variants. One thing worth mentioning is, in the first retrieve attempt, if the number of particles to be resolved is uniform or close to uniform among the processors, the current implementation 66
of the PREF algorithm forces, to the extent possible, the particles to try the first retrieve attempt from their local ISAT tables to reduce the amount of message passing; otherwise if the number of particles among the processors are significantly nonuniform, the above algorithm is used to distribute particles uniformly among the processors, and thus the first retrieve attempt for particles is not necessarily made on the local ISAT tables.
B
Algorithm for optimal pairing
We consider the lth stage of the adaptive strategy, in which the simulation has 2 × Ng groups (of processors). Each of the groups i can be paired with one of the other groups j with an 0
estimated wall clock time Tij for the hypothetical pairing. The objective here is to partition the groups into Ng pairs of new groups, such that this partition minimizes the maximum 0
value of Tij over all i and j pairs corresponding to new groups. This problem is closely related to the Maximum Cardinality Matching problem (MCM): Given an undirected (and unweighted) graph consisting of a set of vertices, V, and a set of edges, E, determine the largest possible matching. A matching is a set M of edges such that each vertex belongs to at most one member of M. A matching is said to be perfect if each vertex belongs to exactly one member of M (i.e., all the vertices are used). For the problem we consider here, the set of vertices corresponds to the groups in the simulation, the edges between vertices are hypothetical pairing between different groups, and a matching is to pair each one of the groups in the simulation with exactly one of the other groups. The graph we have here is weighted with the edge weight corresponding to the estimated wall clock time for the hypothetical pairing and the goal is to find the perfect matching M that minimize the maximum weight among all edges of M. The algorithm used here is proposed by Chew [41] which makes use of the MCM subroutine [42]. 67
1) Let G=(V,E) be the graph. Sort the edges by weight. The idea is to use binary search on the sorted list of edges. Let w be the middle weight in the sorted list of edges. 2) Form G’, an unweighted graph by retaining only the edges with weight less than w. 3) Run the MCM algorithm to see if G’ has a perfect match. If it does, make w smaller (as in binary search). If it does not, make w larger (as in binary search). 4) If the binary search range is down to a single weight, report that weight; otherwise go to step 2). The rationale of the algorithm is to gradually exclude the heavy edges in the graph and then use MCM to determine if a perfect match exists within the remaining edges. The MCM subroutine used runs in time O(n3 ), where n is the number of vertices. Thus the above algorithm, based on the MCM subroutine and binary search, runs in time O(n3 log(n)). It is found that with the algorithm, optimal pairing can be obtained efficiently.
References
[1] Pope, S.B., 1997, Computationally efficient implementation of combustion chemistry using in situ adaptive tabulation, Combustion Theory and Modelling, 1, 41-63. [2] Pope, S.B., 2007, ISAT5: Version 5 of the i n situ adaptive tabulation algorithm. Cornell University, in preparation. [3] Smith, G.P., Golden, D.M., Frenklach, M., Moriarty, N.W., Eiteneer, B., Goldenberg, M., Bowman, C.T., Hanson, R.K., Song, S., Gardiner, W.C., Lissianski, V.V. and Qin, Z., http://www.me.berkeley.edu/gri mech/. [4] Curran, H.J., Gaffuri, P., Pitz, W.J. and Westbrook, C.K., 2002, A comprehensive modeling study of iso-octane oxidation, Combustion and Flame, 129, 253-280.
68
[5] Maas, U. and Pope, S.B., 1992, Simplifying chemical-kinetics: intrinsic low-dimensional manifolds in composition space, Combustion and Flame, 88, 239-264. [6] Ren, Z. and Pope, S.B., 2006, The geometry of reaction trajectories and attracting manifolds in composition space, Combustion Theory and Modelling, 10, 361-388. [7] Chen, J-Y., Kollmann, W. and Dibble, R.W., 1989, PDF modelling of turbulent nonpremixed methane jet flames, Combustion Science and Technology, 64, 315-346. [8] Tur´anyi, T., 1994, Parameterization of reaction mechanisms using orthonormal polynomials, Computers & Chemistry, 18, 45-54. [9] Christo, F.C., Masri, A.R. and Nebot, E.M., 1996, Artificial neural network implementation of chemistry with PDF simulation of H2 /CO2 flames, Combustion and Flame, 106, 406-427. [10] Blasco, J.A., Fueyo, N., Dopazo, C. and Ballester, J., 1998, Modelling the temporal evolution of a reduced combustion chemical system with an artificial neural network, Combustion and Flame, 113, 38-52. [11] Tonse, S.R., Moriary, N.W., Brown, N.J. and Frenklach, M., 1999, PRISM: Piecewise Reusable Implementation of Solution Mapping, An economical strategy for chemical kinetics, Israel Journal of Chemistry, 39, 97-106. [12] Bell, J.B., Brown, N.J., Day, M.S., Frenklach, M., Grcar, J.F., Propp, R.M. and Tonse S.R., 2000, Scaling and efficiency of PRISM in adaptive simulations of turbulent premixed flames, Proceedings of the Combustion Institute, 28, 107-113. ¨ 1999, General foundations of high-dimensional model representations, [13] Rabitz, H. and Alis, O., Journal of Mathematical Chemistry, 25, 197-233. [14] Pope, S.B., 1985, PDF methods for turbulent reactive flows, Progress in Energy and Combustion Science, 11, 119-192. [15] Xu, J. and Pope, S.B., 2000, PDF calculations of turbulent nonpremixed flames with local extinction, Combustion and Flame, 123, 281-307.
69
[16] Tang, Q., Xu, J. and Pope, S.B., 2000, PDF calculations of local extinction and NO production in piloted-jet turbulent methane/air flames, Proceedings of the Combustion Institute, 28, 133139. [17] Embouazza, M., Haworth, D.C. and Darabiha N., 2002, Implementation of detailed chemical mechanisms into multidimensional CFD using in situ adaptive tabulation: application to HCCI engines, SAE paper 2002-01-2773. [18] Zhao, W., Montgomery, C.J., Cremer, M.A., Adams, B.R., Eklund, D.R. and Chen J.-Y., 2003, Implementation of reduced mechanism with ISAT into CFD simulations of full-scale combustion systems, IMECE paper IMECE2003-42732. [19] Ren, Z. and Pope, S.B., 2004, An investigation of the performance of turbulent mixing models, Combustion and Flame, 136, 208-216. [20] Masri, A.R., Cao, R., Pope, S.B. and Goldin, G.M., 2004, PDF Calculations of Turbulent Lifted Flames of H2 /N2 issuing into a vitiated co-flow, Combustion Theory and Modelling, 8, 1-22. [21] Gordon, R.L., Masri, A.R., Pope, S.B. and Goldin, G.M., 2007, A numerical study of autoignition in turbulent lifted flames issuing into a vitiated co-flow, Combustion Theory and Modelling, 11(3), 351-376. [22] Goldin, G.M., 2005, Evaluation of LES subgrid reaction models in a lifted flame, AIAA 2005555. [23] Liu, B.J.D. and Pope, S.B., 2005, The performance of in situ adaptive tabulation in computations of turbulent flames, Combustion Theory and Modelling, 9, 549-568. [24] Liu, K., Pope, S.B. and Caughey, D.A., 2005, Calculations of bluff-body stabilized flames using a joint probability density function model with detailed chemistry, Combustion and Flame, 141, 89-117. [25] Cao, R. and Pope, S.B., 2005, The influence of chemical mechanisms on PDF calculations of nonpremixed piloted jet flames, Combustion and Flame, 143, 450-470.
70
[26] Cao, R., Wang, H. and Pope, S.B., 2007, The effect of mixing models in PDF calculations of piloted jet flames, Proceedings of the Combustion Institute, 31, 1543-1550. [27] Lu, L., Ren, Z., Raman, V., Pope, S.B. and Pitsch, H., 2004, LES/FDF/ISAT computations of turbulent flames, Proceedings of CTR Summer Program 2004, Center For Turbulence Research, 283-294. [28] Lu, L., Ren, Z., Lantz, S.R., Raman, V., Pope, S.B. and Pitsch H., 2005, Investigation of strategies for the parallel implementation of ISAT in LES/FDF/ISAT computations, 4th Joint Meeting of the U. S. Sections of the Combustion Institute, Drexel University, Philadelphia, PA, March 20-23. [29] Singer, M.A. and Pope, S.B., 2004, Exploiting ISAT to solve the reaction-diffusion equation, Combustion Theory and Modelling, 8, 361-383. [30] Singer, M.A., Pope, S.B. and Najm, H.N., 2006, Modeling unsteady reacting flow with operatorsplitting and ISAT, Combustion and Flame, 147, 150-162. [31] Wang, L.G. and Fox, R.O., 2003, Application of in situ adaptive tabulation to CFD simulation of nano-particle formation by reactive precipitation, Chemical Engineering Science, 58, 43874401. [32] Hedengren, J.D. and Edgar, T.F., 2005, In situ adaptive tabulation for real-time control, Industrial Engineering Chemistry Research, 44, 2716-2724. [33] Varshney A. and Armaou A., 2005, Multiscale optimization using hybrid PDE/kMC process systems with application to thin film growth, Chemical Engineering Science, 60, 6780-6794. [34] Hawkes, E.R., Sankaran, R., Sutherland, J.C. and Chen, J.H., 2007, Scalar mixing in direct numerical simulations of temporally evolving plane jet flames with skeletal CO/H2 kinetics, Proceedings of the Combustion Institute, 31, 1633-1640. [35] Correa, S.M., 1993, Turbulence-chemistry interactions in the intermediate regime of premixed combustion, Combustion and Flame, 93, 41-60.
71
[36] Chen, J-Y., 1997, Stochastic modeling of partially stirred reactors, Combustion Science and Technology, 122, 63-94. [37] Yang, B. and Pope, S.B., 1998, An investigation of the accuracy of manifold methods and splitting schemes in the computational implementation of combustion chemistry, Combustion and Flame, 112, 16-32. [38] James, S., Anand, M.S., Razdan M.K. and Pope, S.B., 2001, In situ detailed chemistry calculations in combustor flow analyses, Journal of Engineering for Gas Turbines and Power, 123, 747756. [39] Lu, L. and Pope S.B., A systematic investigation of in situ adaptive tabulation for combustion chemistry. Cornell University, in preparation. [40] http://www.mpi-forum.org/docs/mpi-11-html/mpi-report.html. [41] Chew, L.P., Private Communication. [42] ftp://dimacs.rutgers.edu/pub/challenge/graph/.
72
0
10
pR pA pD
−2
10
pG
−4
10
−6
10
4
10
6
10
8
q
10
10
10
Fig. 1. The probabilities of retrieve pR , add pA , discarded evaluation pD and grow pG at query q against the number of queries q in the PaSR calculation with the skeletal mechanism, εtol = 1×10⁻³ and A = 2.0 × 10³ . The probability of discarded evaluation is nonzero only after the table is full. The probability of add is zero after the table is full, although it is drawn as a flat line for the sake of illustration. The turning point where the pA curve becomes flat indicates the point where the ISAT table becomes full.
73
a)
0
10
p =p +p +p F
G
A
D
pA
−1
10
pG
−2
10
−3
10
−4
10
−5
10
4
10
b)
6
10
8
q
10
10
10
0
10
p =p +p +p F
G
A
D
pA
−1
10
pG −2
10
−3
10
−4
10
−5
10
−6
10
4
10
6
10
8
q
10
10
10
Fig. 2. The probabilities of function evaluation pF , add pA , and grow pG against the number of queries q from PaSR calculations with the skeletal mechanism a) εtol = 1 × 10⁻⁴ and A = 6 × 10⁴ , b) ε −3 and A = 2 × 10³ . In the plots, after the tables are full, to facilitate comparison, tol = 1 × 10 the values of pA (which are zero) are artificially set to be the values at the points where the tables become full. Hence the turning points where the pA curves become flat indicate the points where the ISAT tables become full.
74
0
10
−1
10
pA
(18/a)1.0 −2
10
−3
10
−4
10
0
5
10
a
10
Fig. 3. Probability of add pA against the number of tabulated table entries a. Symbols: results from the PaSR calculation with skeletal mechanism and εtol = 2 × 10⁻⁴ ; line: the inverse power law (ao /a)r with ao = 18 and r = 1.0.
75
4
10
t
F
3
t
CPU time (µ s)
10
Q
tR 2
t = t + p (∞,A) (t − t )
10
Q
R
F
F
R
1
10
0
10 4 10
5
10
6
10
7
8
10
q
9
10
10
4
10
t
F
3
CPU time (µ s)
10
tQ tR
2
10
1
10
t =t + p (∞,A) (t − t ) Q
R
F
F
R
0
10 4 10
5
10
6
7
10
10
8
10
9
10
q
Fig. 4. Average CPU time for a function evaluation tF , a query tQ , and a retrieve tR against the number of queries from the PaSR calculation with the skeletal mechanism a) εtol = 1 × 10⁻⁴ and A = 6 × 10⁴ ; b) εtol = 1 × 10⁻³ and A = 2 × 10³ . Also shown are the gray dashed lines of the predicted query time using Eq. 15. In the prediction pF (∞, A) is estimated using the probability of add when the table becomes full.
76
4
10
CPU time (µ s)
3
10
tF tQ t
R
2
2 tR
10
1
10 4 10
5
10
6
10
7
q
8
10
9
10
10
4
10
t
F
tQ
CPU time (µ s)
3
10
tR
2t
R
2
10
1
10 4 10
5
10
6
10
7
q
10
8
10
9
10
Fig. 5. Average CPU time for a function evaluation tF , a query tQ and a retrieve tR against the number of queries. Figure shows results from a) a subcritical (tQ > 2tR ) case with εtol = 1 × 10⁻⁴ and A = 2 × 10⁴ and b) a supercritical (tQ < 2tR ) case with εtol = 1 × 10⁻⁴ and A = 6 × 10⁴ . Also shown are the gray dashed lines of 2tR .
77
CFD code Full representation φ Subdomain 1 Start of reaction step
Yes
...
Yes
QT or not?
QT for all particles No
Subdomain α ... Start of reaction step
Yes
QT or not?
QT for all particles
Put all unresolved particles ˆb blocks in N
Subdomain Np Start of reaction step
QT or not?
QT for all particles
No
Put all unresolved particles in Nˆb blocks
No
Put all unresolved particles in Nˆb blocks
Set parallel ISAT strategy
ˆb blocks and resolve particles in each block Loop over N
End of reaction steps
Block ˆib on processor 1
. . . Block ˆib on processor α
. . .
0
X1
X1
F1
F1
ISAT Table 1
0
0
Xα Xα Fα
0
x2f mpi software
ISAT Table α
Fα
ISAT Table Np φ(0), φ(∆(t)) 0
Block ˆib on processor Np
XNp
XNp
FNp
FNp
0
Retrieve
Add
φ(0)
φ(∆(t))
ODE Integrator dφ dt
φ
= S(φ) S(φ)
Detailed Chemical Mechanism
Fig. 6. Sketch showing the use of the parallel ISAT algorithm in a parallel calculation of reactive flow with Np processor. With domain decomposition the whole solution domain is divided into Np subdomains and each processor performs the computation of one subdomain. The bottom subplot illustrates the processes in each block sub-step, where the particles in the blocks are redistributed by x2f mpi among the processors, resolved there, and then passed back to the original processors.
78
Average time per particle step(µ s)
250
200
150
100
50
0
1
2
3
4 5 6 Processor index, k
7
8
Fig. 7. The wall clock time and CPU time per particle step (in microseconds) for each processor from the nonuniform coincident PaSR calculation with εtol = 5 × 10⁻⁴ and A = 1 × 10³ . The wall clock time and CPU time per particle step are defined as the total wall clock time and the total CPU time on each processor normalized by the average number of queries on all processors. Solid symbol: wall clock time; open symbol: CPU time. Symbol ◦: results from PLP/ISAT; .: results from URAN/ISAT. The calculations result in an average of 1.9 × 10⁸ queries per processor.
79
0
Normalized number of operations
Normalized number of operations
0
10
−2
10
−4
10
queries retrieves function evaluations −6
10
10
−2
10
−4
10
queries retrieves function evaluations
−6
1
2
3
4 5 Processor index
6
7
10
8
1
2
3
4 5 Processor index
6
7
8
Fig. 8. Normalized number of operations for different events performed by ISAT on each processor from the nonuniform coincident PaSR calculations with εtol = 5×10⁻⁴ and A = 1×10³ . The number of operations is normalized by the average number of queries among all the processors. Left plot: PLP/ISAT; right plot: URAN/ISAT. Symbol ◦: queries; ∗: retrieves; ×: function evaluations. The calculations result in an average of 1.9 × 10⁸ queries per processor.
80
Average time per particle step(µ s)
600 500 400 300 200 100 0
1
2
3
4 5 6 Processor index, k
7
8
Fig. 9. Wall clock time and CPU time per particle step (in microseconds) for each processor from the uniform coincident PaSR calculations with εtol = 1 × 10⁻⁴ and A = 2 × 10³ . Solid symbol: wall clock time; open symbol: CPU time. Symbol ◦: PLP/ISAT; /: QT/URAN/ISAT; ¦: PREF(8)/URAN/ISAT. The calculations result in an average of 1.0 × 10⁸ queries per processor.
81
Normalized number of operations
0
10
−2
10
−4
10
queries retrieves function evaluations
−6
10
1
2
3
4 5 Processor index
6
7
8
Normalized number of operations
0
10
−2
10
−4
10
queries retrieves function evaluations
−6
10
1
2
3
4 5 Processor index
6
7
8
Normalized number of operations
0
10
−2
10
−4
10
queries retrieves function evaluations
−6
10
1
2
3
4 5 Processor index
6
7
8
Fig. 10. Normalized number of operations for different events performed by ISAT on each processor from the nonuniform coincident PaSR calculations with εtol = 1 × 10⁻⁴ and A = 2 × 10³ . The 82 number of operations are normalized by the average number of queries among all the processors. Top plot: PLP/ISAT; middle plot: QT/URAN/ISAT; bottom plot: PREF(8)/URAN/ISAT. Symbol ◦: queries; ∗: retrieves; ×: function evaluations; Each calculation results in an average of 1.0 × 10⁸ queries per processor.
a) 80
Wall clock time per retrieve (µ s)
tRij,w 70
t
60
tRj,w
Ri,w
t’
Rij,w
50 40 30 20 10 0
b)
500
1000 1500 reaction fractional step
2000
2500
80
Wall clock time per retrieve (µ s)
tRij,w 70
t
60
tRj,w
Ri,w
t’
Rij,w
50 40 30 20 10 0
500
1000 1500 reaction fractional step
2000
2500
Fig. 11. Wall clock time per particle in retrieve attempts from the uniform PaSR calculations with Np = 2, εtol = 1 × 10⁻⁴ and A = 2 × 10³ ; a) coincident case b) disjoint case. Black dashed line: tRij,w , measured wall clock time for the case with group i and j being paired; black solid line: tRi,w , measured wall clock time for group i without pairing performed; black dot line: tRj,w , measured 0 wall clock for group j with no pairing performed; blue solid line: tRij,w , the estimated wall clock time per particle in retrieve attempts for the hypothetical pairing between group i and j. Each calculation results in an average of 1.0 × 10⁷ queries per processor. Figure shows the results only after pairing or not (i.e., not prior to the pairing criterion being satisfied).
83
20 Wall clock time per block sub−step (s)
T
np
T
p ’
Tnp
15
’
Tp 10
5
0
500
1000 1500 reaction fractional steps
2000
2500
20 Wall clock time per block sub−step (s)
T
np
T
p ’
Tnp
15
’ p
T 10
5
0
500
1000 1500 reaction fractional steps
2000
2500
Fig. 12. Wall clock time per block sub-step from the uniform PaSR calculations with Np = 2, εtol = 1 × 10⁻⁴ , and A = 2 × 10³ ; a) coincident case b) disjoint case. Black dashed line: Tnp , measured wall clock time (per block sub-step) with no pairing; black solid line: Tp , measured wall 0 clock time with pairing; blue dashed dot line: Tnp , estimated wall clock time with no pairing; blue 0 solid line: Tp , estimated wall clock time with pairing. Figure shows the results only after pairing or not (i.e., not prior to the pairing criterion being satisfied).
84
0.1 pF,np p
0.08
’ F,np
pF,p p’
F,p
pF
0.06
0.04
0.02
0
500
1000 1500 reaction fractional steps
2000
2500
Fig. 13. The estimated and measured percentages of function evaluations (averaged over processors) from the uniform coincident PaSR calculations with no pairing and pairing. In the calculations, Np = 2, εtol = 1 × 10⁻⁴ , and A = 2 × 10³ . Blue solid line: pF,np , measured with no pairing; red 0 dashed line: pF,np , estimated with no pairing; black solid line: pF,p , measured with pairing; black 0 dashed line: pF,p , estimated with pairing. Figure shows the results only after pairing or not (i.e., not prior to the pairing criterion being satisfied).
85
60 Normalized number of operations
Average time per particle step (µ s)
0
50 40 30 20 10 0
10
−2
10
−4
10
queries retrieves function evaluations −6
1
2
3
4 5 Processor index
6
7
10
8
1
2
3
4 5 Processor index
6
7
8
120 Normalized number of operations
Average time per particle step (µ s)
0
100 80 60 40 20 0
10
−2
10
−4
10
queries retrieves function evaluations
−6
1
2
3
4 5 Processor index
6
7
10
8
1
2
3
4 5 Processor index
6
7
8
600 Normalized number of operations
Average time per particle step (µ s)
0
500 400 300 200 100 0
10
−2
10
−4
10
queries retrieves function evaluations
−6
1
2
3
4 5 Processor index
6
7
10
8
1
2
3
4 5 Processor index
6
7
8
Fig. 14. For the uniform coincident PaSR tests, figure showing the performance of different parallel ISAT strategies. a) εtol = 8 × 10⁻⁴ and A = 2 × 10³ ; b) εtol = 5 × 10⁻⁴ and A = 1 × 10³ ; c) εtol = 1 × 10⁻⁴ and A = 2 × 10³ . Left column: wall clock time (solid symbol) and CPU time (open symbol) in reaction fractional step (in microseconds per particle step) for each processor. Symbol ◦: PLP/ISAT; .: URAN/ISAT; /: QT/URAN/ISAT; ¦: PREF(8)/URAN/ISAT; ¤: adaptive. Right column: normalized number of operations for different events performed by ISAT on each processor from PLP/ISAT. Symbol ◦: queries; ∗: retrieves; ×: function evaluations; Each calculation results in an average of 1.0 × 10⁸ queries per processor.
86
80
0
Normalized number of operations
Average time per particle step (µ s)
90
70 60 50 40 30 20
10
−2
10
−4
10
queries retrieves function evaluations
10 0
−6
1
2
3
4 5 Processor index
6
7
10
8
1
2
3
4 5 Processor index
6
7
8
250 Normalized number of operations
Average time per particle step (µ s)
0
200
150
100
50
0
10
−2
10
−4
10
queries retrieves function evaluations −6
1
2
3
4 5 Processor index
6
7
10
8
1
2
3
4 5 Processor index
6
7
8
4 0
Normalized number of operations
Average time per particle step (µ s)
10
3
10
2
10
1
10
10
−2
10
queries retrieves function evaluations
−4
10
−6
1
2
3
4 5 Processor index
6
7
10
8
1
2
3
4 5 Processor index
6
7
8
Fig. 15. For the nonuniform coincident PaSR tests, figure showing the performance of different parallel ISAT strategies. a) εtol = 8 × 10⁻⁴ and A = 2 × 10³ ; b) εtol = 5 × 10⁻⁴ and A = 1 × 10³ ; c) εtol = 1 × 10⁻⁴ and A = 2 × 10³ . Left column: wall clock time (solid symbol) and CPU time (open symbol) in reaction fractional step (in microseconds per particle step) for each processor. Symbol ◦: PLP/ISAT; .: URAN/ISAT; /: QT/URAN/ISAT; ¦: PREF(8)/URAN/ISAT; ¤: adaptive. Right column: normalized number of operations for different events performed by ISAT on each processor from PLP/ISAT. Symbol ◦: queries; ∗: retrieves; ×: function evaluations; Each calculation results in an average of 1.0 × 10⁸ queries per processor.
87
120 Normalized number of operations
Average time per particle step (µ s)
0
100 80 60 40 20 0
10
−2
10
−4
10
queries retrieves function evaluations −6
1
2
3
4 5 Processor index
6
7
10
8
1
2
3
4 5 Processor index
6
7
8
160
0
Normalized number of operations
Average time per particle step (µ s)
180
140 120 100 80 60 40
10
−2
10
−4
10
queries retrieves function evaluations
20 0
−6
1
2
3
4 5 Processor index
6
7
10
8
1
2
3
4 5 Processor index
6
7
8
2500 Normalized number of operations
Average time per particle step (µ s)
0
2000
1500
1000
500
0
10
−2
10
−4
10
queries retrieves function evaluations
−6
1
2
3
4 5 Processor index
6
7
10
8
1
2
3
4 5 Processor index
6
7
8
Fig. 16. For the uniform disjoint PaSR tests, figure showing the performance of different parallel ISAT strategies. a) εtol = 8 × 10⁻⁴ and A = 2 × 10³ ; b) εtol = 5 × 10⁻⁴ and A = 1 × 10³ ; c) ε −4 and A = 2 × 10³ . Left column: wall clock time and CPU time in reaction tol = 1 × 10 fractional step (in microseconds per particle step) for each processor. Solid symbol: wall clock time; open symbol: CPU time. Symbol ◦: PLP/ISAT; .: URAN/ISAT; /: QT/URAN/ISAT; ¦: PREF(8)/URAN/ISAT; ¤: adaptive. Right column: normalized number of operations for different events performed by ISAT on each processor from PLP/ISAT. Symbol ◦: queries; ∗: retrieves; ×: function evaluations; Each calculation results in an average of 1.0 × 10⁸ queries per processor.
88
120 Normalized number of operations
Average time per particle step (µ s)
0
100 80 60 40 20 0
10
−2
10
−4
10
queries retrieves function evaluations −6
1
2
3
4 5 Processor index
6
7
10
8
1
2
3
4 5 Processor index
6
7
8
300 Normalized number of operations
Average time per particle step (µ s)
0
250 200 150 100 50 0
10
−2
10
−4
10
queries retrieves function evaluations −6
1
2
3
4 5 Processor index
6
7
10
8
1
2
3
4 5 Processor index
6
7
8
3000 Normalized number of operations
Average time per particle step (µ s)
0
2500 2000 1500 1000 500 0
10
−2
10
queries retrieves function evaluations
−4
10
−6
1
2
3
4 5 Processor index
6
7
10
8
1
2
3
4 5 Processor index
6
7
8
Fig. 17. For the nonuniform disjoint PaSR tests, figure showing the performance of different parallel ISAT strategies. a) εtol = 8 × 10⁻⁴ and A = 2 × 10³ ; b) εtol = 5 × 10⁻⁴ and A = 1 × 10³ ; c) ε −4 and A = 2 × 10³ . Left column: wall clock time and CPU time in reaction tol = 1 × 10 fractional step (in microseconds per particle step) for each processor. Solid symbol: wall clock time; open symbol: CPU time. Symbol ◦: PLP/ISAT; .: URAN/ISAT; /: QT/URAN/ISAT; ¦: PREF(8)/URAN/ISAT; ¤: adaptive. Right column: normalized number of operations for different events performed by ISAT on each processor from PLP/ISAT. Symbol ◦: queries; ∗: retrieves; ×: function evaluations; Each calculation results in an average of 1.0 × 10⁸ queries per processor.
89
Average time per particle step (µ s)
400 350 300 250 200 150 100 50 0
1
2
3
4 5 Processor index
6
7
8
Fig. 18. For the nonuniform disjoint PaSR test with εtol = 8 × 10⁻⁴ and A = 2 × 10³ , figure showing the ISAT performance with forced pairing in the adaptive strategy. Solid symbol: wall clock time; open symbol: CPU time. Symbol ¤: adaptive with no pairing; 4: adaptive with single pairing forced at first pairing stage; 5: adaptive with two pairings forced at first and second pairing stages; ?: adaptive with three pairings forced at all three pairing stages. Each calculation results in an average of 1.0 × 10⁸ queries per processor.
90
Average time per particle step (µ s)
800 700 600 500 400 300 200 100 0 0
10
20
30 40 50 Num. of processors
60
70
Fig. 19. For the uniform coincident PaSR calculations with εtol = 1 × 10⁻⁴ and A = 2 × 10³ , figure showing the average wall clock time and CPU time in reaction fractional step (per particle step in microseconds) against the number of processors; Solid symbol: wall clock time; open symbol: CPU time. Symbol ◦: PLP/ISAT; ¤: adaptive.
91