Lung Cancer (2005) 48, 171—185
Cost-effectiveness analysis of screening for lung cancer with low dose spiral CT (computed tomography) in the Australian setting Renee Mansera,d,∗, Andrew Daltonb, Rob Carterb, Graham Byrnesc, Mark Elwoode, Donald A. Campbellf a
Clinical Epidemiology and Health Service Evaluation Unit, Ground Floor Charles Connibere Building, Royal Melbourne Hospital, Grattan Street, Parkville, Vic. 3050, Australia b Program Evaluation Unit, Department of Public Health, The University of Melbourne, Vic. 3010, Australia c Centre for Genetic Epidemiology, The University of Melbourne, Vic. 3010, Australia d Department of Respiratory Medicine, St. Vincent’s Hospital Melbourne (Public), 55 Victoria Parade, Fitzroy, Vic. 3065, Australia e National Cancer Control Initiative, 1 Rathdowne Street, Carlton, Vic. 3053, Australia f Monash Institute of Health Services Research, Monash Medical Centre, Level 1, Block E, Clayton, Vic. 3168, Australia Received 15 June 2004 ; received in revised form 1 November 2004; accepted 3 November 2004 KEYWORDS Lung neoplasm; Cost-effectiveness; Economic evaluation; Screening; Mass screening; Computed tomography
Summary Introduction: Low dose spiral computed tomography (CT) is a sensitive screening tool for lung cancer that is currently being evaluated in both non-randomised studies and randomised controlled trials. Methods: We conducted a quantitative decision analysis using a Markov model to determine whether, in the Australian setting, offering spiral CT screening for lung cancer to high risk individuals would be cost-effective compared with current practice. This exploratory analysis was undertaken predominantly from the perspective of the government as third-party funder. In the base-case analysis, the costs and health outcomes (life-years saved and quality-adjusted life years) were calculated in a hypothetical cohort of 10,000 male current smokers for two alternatives: (1) screen for lung cancer with annual CT for 5 years starting at age 60 year and treat those diagnosed with cancer or (2) no screening and treat only those who present with symptomatic cancer.
* Corresponding author. Tel.: +61 3 9342 8772; fax: +61 3 9342 7060.
E-mail address:
[email protected] (R. Manser).
0169-5002/$ — see front matter © 2004 Elsevier Ireland Ltd. All rights reserved. doi:10.1016/j.lungcan.2004.11.001
172
R. Manser et al. Results: For male smokers aged 60—64 years, with an annual incidence of lung cancer of 552 per 100,000, the incremental cost-effectiveness ratio was $57,325 per life-year saved and $105,090 per QALY saved. For females aged 60—64 years with the same annual incidence of lung cancer, the cost-effectiveness ratio was $51,001 per life-year saved and $88,583 per QALY saved. The model was used to examine the relationship between efficacy in terms of the expected reduction in lung cancer mortality at 7 years and cost-effectiveness. In the base-case analysis lung cancer mortality was reduced by 27% and all cause mortality by 2.1%. Changes in the estimated proportion of stage I cancers detected by screening had the greatest impact on the efficacy of the intervention and the cost-effectiveness. The results were also sensitive to assumptions about the test performance characteristics of CT scanning, the proportion of lung cancer cases overdiagnosed by screening, intervention rates for benign disease, the discount rate, the cost of CT, the quality of life in individuals with early stage screen-detected cancer and disutility associated with false positive diagnoses. Given current knowledge and practice, even under favourable assumptions, reductions in lung cancer mortality of less than 20% are unlikely to be cost-effective, using a value of $50,000 per life-year saved as the threshold to define a ‘‘cost-effective’’ intervention. Conclusion: The most feasible scenario under which CT screening for lung cancer could be cost-effective would be if very high-risk individuals are targeted and screening is either highly effective or CT screening costs fall substantially. © 2004 Elsevier Ireland Ltd. All rights reserved.
1. Introduction Survival from lung cancer is related to stage at diagnosis [1,2]. However, more than three-quarters of individuals with lung cancer present with symptoms only once the tumour has spread to either regional lymph nodes or distant sites [1,3]. Screening for the detection and treatment of early stage lung cancer therefore has the potential to reduce lung cancer mortality. However, evidence from prior controlled trials does not support screening for lung cancer with chest radiography or sputum cytology [4]. Low dose spiral computed tomography (CT) is more sensitive than chest radiography, but has yet to be evaluated in randomised controlled trials (RCT) [5]. A multicentre RCT is under way in the USA and others are planned, but the results will not be available in the near future [6—8]. Even if trials show that CT screening is efficacious, the costs could be prohibitive under certain conditions, in particular, the high false positive rate reported for some observational studies is of concern [5,9,10]. Preliminary cost-effectiveness analyses conducted in North America have drawn conflicting conclusions about the economic efficiency of screening, partly because they have examined different approaches to estimating efficacy and different lung cancer risk groups [11—13]. It is not clear how generalisable the results of these analyses are to other settings. Over and above differences between countries in disease incidence/prevalence and health sector financing and organisation, the impact of interventions
under carefully designed study conditions (‘‘efficacy’’) may not be achieved to the same extent under routine health service conditions (‘‘effectiveness’’), due to lower intensity/quality of service delivery and/or lower adherence by patients. Adjustment for these real life factors requires evidence from naturalistic studies and/or pilot studies, preferably under Australian conditions. The National Cancer Control Initiative in Australia has recently published a report on lung cancer screening by helical CT that examined the evidence for screening and the potential role of Australia in future trials [14]. One of their recommendations was that an economic analysis be undertaken using currently available data that could be updated, as more information on efficacy/effectiveness becomes available [14]. Such an analysis could also be used to inform the research agenda at the local level. In particular, it could explore what degree of mortality and morbidity reduction from screening would be necessary for low dose CT screening to be acceptable and feasible in the Australian system. A quantitative decision analysis was conducted to examine the risks and benefits of screening and the cost-effectiveness in individuals at risk for lung cancer. In particular, we assessed whether offering screening with spiral CT for lung cancer to highrisk individuals was a cost-effective option for improving health outcomes in individuals with lung cancer compared with current practice (no screening plus usual care post diagnosis). In endeavouring to answer this question, the perspective taken is
Screening for lung cancer with low dose spiral CT essentially that of the government as third-party funder. Health sector costs and some patient out of pocket expenses are considered in the analysis. In this cost-effectiveness analysis, the incremental costs and effects of screening were compared with usual care. Health benefits were considered both in terms of ‘‘life-years saved’’ and ‘‘quality-adjusted life years’’. Given the level of uncertainty about the efficacy of screening, the model also closely examines the potential harms of screening such as false positive diagnoses.
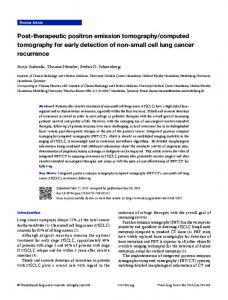
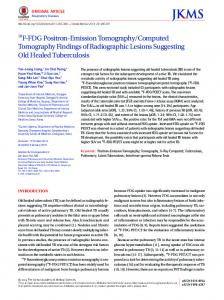
2. Methods 2.1. Model structure The decision-analysis model compared two main interventions in a hypothetical cohort of 10,000 individuals: (1) screen for lung cancer with annual spiral CT and treat those diagnosed with cancer and (2) do not screen for lung cancer and treat only those who present with symptomatic cancer. A Markov model was used to estimate the years of life and accumulated costs for 15 years after the onset of screening [15]. A Markov model is a recursive model that uses the probability of individuals moving between specified health states within a given time period or ‘cycle’, in order to estimate the changing distribution (or proportions) between health states over extended periods of time. A cycle period of 3 months and 10 health states were used [15,16]. The model was developed using Microsoft Excel 97. The decision tree used for this analysis is displayed in Figs. 1 and 2. Individuals who died of lung cancer were presumed to have progressed through a terminal health state for 3 months prior to death.
2.2. Population In the base-case analysis screening of high-risk male current smokers aged between 60 and 64 years was examined. The annual incidence of non-small cell lung cancer was assumed to be 552 per 100,000 in the non-screened cohort. This represents the estimated annual risk of all types of lung cancer in a current smoker aged 60 year who has smoked 40 cigarettes per day for 40 years [17]. The prevalence of lung cancer in the screened group was increased to reflect the fact that the diagnosis of some cancers are drawn forward by screening, the incidence of lung cancer being approximately one third of the prevalence in several series [18—20]. Females were considered separately because all-cause sur-
173 vival differs by gender. In separate analyses screening in individuals aged 65—69 years and lower and higher risk smokers were also examined.
2.3. Screening In the base-case analysis, a scenario where opportunistic annual screening with low dose CT is offered for a 5-year interval starting at age 60 year was considered. In this scenario, individuals would be referred for screen taking by their local medical officer and the scan would be conducted and interpreted at an appropriate radiological service. Suspicious lesions would be referred (by local medical officer) to an appropriate specialist for evaluation, further diagnostic work up and treatment, as would currently occur in clinical practice, for any significant abnormalities detected on CT. Evaluation and support services were not considered in this evaluation. Furthermore, this is a ‘‘steady-state analysis’’ (i.e. the intervention is assumed to be fully implemented and performing in accordance with its full efficacy potential), and therefore we have not allowed for any learning curve issues or start-up costs. 2.3.1. Recruitment and attendance In the base-case analysis, no active recruitment was considered. It was assumed that screening would be offered ‘opportunistically’ to appropriate individuals when they sought medical care from their local medical officer. It was assumed that only those who would be medically fit to receive treatment for lung cancer would be offered screening. Only those who took up the offer of screening initially were considered in the analysis, and therefore 100% of a cohort of 10,000 was initially screened in the base-case analysis. In addition, it was assumed that all individuals attended for follow-up and management of any abnormalities detected. During the active screening period, individuals who were not known to have had lung cancer and were still alive were offered repeat annual screening. Based on the weighted average of four studies, it was assumed that for each annual repeat screening, 86% of individuals attended screening CT and follow-up and management of abnormalities detected [18—20,22]. Adherence with screening was examined by way of sensitivity analysis using the range described in Table 2. 2.3.2. Detection of cancers For the base-case analysis, sensitivity and specificity of CT and intervention rates for false positives were based on the weighted averages of six stud-
174
R. Manser et al.
Fig. 1 Decision tree for usual care arm.
ies that have examined CT screening in high-risk populations [5,9,10,18,21,22]. A plausible range for these estimates was based on the results of these six studies. A series of one-way sensitivity analyses was then conducted based on these ranges as outlined in Table 2. A best and worst-case scenario was also examined. There has been no Australian CT screening studies. The Australian experience is likely to fall however somewhere within the range of results reported overseas.
2.3.3. Follow-up and confirmation of diagnosis Positive screening CT scans were followed by a repeat detailed CT as per the Early Lung Cancer Action Project protocol [5]. The majority of positives would be false positives and a small proportion of individuals with false positive examinations would require further evaluation (such as bronchoscopy or fine needle biopsy) including a very small number of surgical biopsies (thoracotomy or video-assisted thoracoscopy). Individuals with pos-
Screening for lung cancer with low dose spiral CT
Fig. 2 Decision tree for screening arm.
175
176 itive detailed scans who were not referred for tissue diagnosis after initial evaluation were assumed to be followed with a repeat detailed CT at 3 and 6 months and repeat annual low dose screening thereafter.
2.4. Mortality There has been no large CT screening RCTs reported as yet [4]. Outcomes in the model were estimated by assuming that the improvement in stage distribution demonstrated in uncontrolled CT screening studies will translate into a reduction in the long-term mortality from lung cancer. Deaths from lung cancer in the model were estimated by applying survival data by stage to the expected stage distribution of cancers in the screened and nonscreened groups. The model assumes that individuals receive ideal therapy for stage according to current treatment recommendations [23,24]. Treatment related deaths were considered in the model including those associated with surgical biopsy for benign disease. 2.4.1. Control group The stage distribution of cancers in the nonscreened cohort was based on data from the South Australian Cancer Registry, but a similar proportion of early stage cancers have been reported elsewhere [1,3,25,26]. Small cell cancers were excluded because they comprise between 0 and 8% of those detected by CT [10,19,20,22]. Published annual probabilities of death from non-small cell lung cancer by stage were fitted to a logistic regression model [27]. The regression model was then used to calculate three monthly probabilities of death from lung cancer by stage at diagnosis. Probabilities of death from all causes were calculated from Australian life tables (1998—2000) [28]. Three monthly probabilities were derived from the annual probabilities using linear interpolation. These probabilities were based on the general population, and therefore life tables for smokers and nonsmokers were derived by taking into account current smoking rates in the Australian population and the relative risk of death from all causes in smokers [29,30]. Statistical analysis was undertaken using STATA [31]. 2.4.2. Screened group The stage distribution of cancers in the screened cohort was based on the weighted average reported for CT screening studies examining high-risk cohorts [5,10,18,19,21,22]. Survival was based on data for non-small cell lung cancer. Survival of screen de-
R. Manser et al. tected cancer is likely to be better than those with symptomatic lung cancer, at least in part due to overdiagnosis and lead time bias [32]. We, therefore, estimated the survival of stage I screen detected cancers based on screened populations [33]. Annual probabilities were not available; however, lung cancer specific mortality survival curves plotted by Flehinger et al. [33] and Martini et al. [34] give cumulative survival at the end of 5 and 10 years and are consistent with slowly decreasing hazard. Therefore, hazard was again modeled as a logistic function of time, with parameters chosen to fit the 5 and 10 years survival estimates. This fitted hazard was then used to predict the probability of cancer-specific death in each 3 months period, given survival to the start of the period. Survival of more advanced screen detected cancers reported by Flehinger et al. was similar to symptomatic lung cancer reported by Mountain [27]. All cause mortality was estimated as described for the control group. There are several unknown variables that could bias the estimates of survival for the screened cohort. Firstly, the average lead-time of lung cancer is unknown. This refers to the time period between when the cancer can be detected by screening (preclinical) and when it would have presented with symptoms. For more aggressive cancers, the leadtime will be short, but for slow growing tumours the lead-time could be several years [35]. Sobue et al. have estimated that the average lead-time is 12 months for cancers detected by chest X-ray screening [36]. Therefore, in this model, we have assumed a lead-time of 12 months. A further unknown variable is what proportion of cancers detected by screening might be ‘‘overdiagnosed’’. Overdiagnosis refers to the detection by screening, of cases of cancer that would never have become symptomatic or led to death in that individual’s lifetime had they not been detected by screening [37]. The rate of overdiagnosis was estimated from several autopsy studies [38,39]. Between 12 and 20% of all lung cancers detected at autopsy are incidental [38,39]. In the base-case analysis, it was assumed that 12% of cancers detected by screening were overdiagnosed, the incidence of cancer in the screened cohort was increased above that reported for symptomatic cases to reflect this rate of overdiagnosis. The benefit attributed to screening was adjusted to exclude these cases so that cases of overdiagnosis were assigned a probability of death due to all causes but not specifically due to lung cancer. A sensitivity analysis was conducted to assess the impact of increasing the rate of overdiagnosis to 20% or reducing it to zero.
Screening for lung cancer with low dose spiral CT
Table 1
177
Health states and utility values used in base-case analysis (other than well and dead)
Health state
Duration
Utility
Source
Post-operative after surgery for false positive Post-operative following surgery for lung cancer Localised NSCLCb (disease free after treatment) Regional NSCLC (disease free after treatment) Lung cancer ‘overdiagnosed’ by screening Metastatic NSCLC Terminal phase lung cancer False positive (anxiety associated with expectant management)
3 months 6 months Until relapse or death from other causes Until relapse or death from other causes Until death from other causes Until death 3 months prior to death from lung cancer 6 months until follow-up CT
0.88 0.80 0.88 0.80 0.88 0.69 0.69 0.98
[41]a Estimate [41] [41] Estimate [41] [41] [41]
a b
Reported for Thoracoscopy. Non-small cell lung cancer.
2.5. Quality of life In addition to life-years saved, for the base-case analysis, quality-adjusted life years (QALYs) were also examined. QALYs used in economic analysis generally integrate both length of life and quality of life into a single index by multiplying each year of life in the model by a quality weight. By convention, a weight of 0.00 is assigned to death (or a state as bad or worse than death) and a weight of 1.00 is assigned to normal health. Methods or instruments possessing the necessary theoretical foundations are used to elicit, from subjects, values between 0.00 and 1.00 that represent their strength of preference between the health states contained in the model [40]. In economics, these values are referred to as ‘utilities’. The total QALYs for each cohort is the sum of the life years estimated to have been spent in each health state, after multiplying each year by the utility weight (that is, the quality of life weight) concerned [40]. For the present analysis, we used utility weights reported by Earle et al. [41,42]. Utilities are outlined in Table 1. Little data is available on the quality of life of individuals with screen detected lung cancer compared with that diagnosed in symptomatic individuals and in the base-case analysis for this study, they are presumed to be equivalent. However, it is possible that quality of life is better in the screen detected group, and therefore a sensitivity analysis was conducted to examine the impact of assigning a utility of 0.93 to screen detected localized lung cancers and cases of overdiagnosis.
2.6. Costs Only health care sector resources, including some out-of-pocket patient expenses (the Medicare gap)
were considered in this analysis. Patient/carer time costs in attending interventions, whilst acknowledged as ‘‘economic costs’’ associated with the interventions [43], were not included in this preliminary analysis. The health services involved were valued in Australian dollars for the reference year 2002, using the appropriate schedule fee (not the rebate). For lung cancer deaths prevented by screening, the future costs of medical care unrelated to the treatment of lung cancer or its complications were not evaluated. The inclusion of such costs in economic evaluations is controversial and not warranted in this preliminary analysis [43].
2.7. Screening costs The cost of CT scanning was based on the 2002 Medicare Benefits Schedule [44]. The costs of further investigations and medical review of individuals with positive screening tests were also based on the Medicare Benefits Schedule. It was assumed that individuals who were interested in screening would consult their general practitioner (brief consultation) and receive advice, counseling and referral for scanning and then be reviewed to discuss the results of the scan once it had been conducted and reported. It was assumed that every individual with an abnormal scan would require an initial referral to a specialist physician. Variable recruitment costs or the cost of reminders to attend repeat screens were not considered in the base-case analysis but a sensitivity analysis was conducted to explore the impact of these. The cost of recruitment ($16 per individual recruited) using a letter recommending screening was based on that reported for an Australian co-ordinated breast cancer screening program and inflated to present day value using the health deflator from the Australian Institute of Health and
178
R. Manser et al.
Welfare (AIHW) Health Expenditure Series [45,46]. The cost of annual recruitment or reminders to attend repeat screens was assumed to be half this amount. The Early Lung Cancer Action Project study was based on single slice CT; however, with multi-slice CT scanning, there is no need for a follow-up detailed CT scan. Furthermore, more recent studies suggest that for smaller nodules detected by CT, repeat CT examinations at 3 and 6 months can be deferred until 12 months [22]. Therefore, a sensitivity analysis was conducted to examine the impact of deleting these costs from the analysis as outlined in Table 2. In addition, it may not be necessary for all those with nodules detected at baseline to be referred to a physician and the impact of deleting these costs from the analysis was also examined in a sensitivity analysis. Table 2
2.8. Treatment costs Treatment costs were limited to those incurred by hospital based care and do not include the costs of visits to primary care doctors or out of hospital pharmacy costs. The costs of surgical resections and chemotherapy were taken from Australian Refined Diagnosis Related Groups (Version 4.2) using Victorian cost weights for 2002—2003 [47]. For the base-case analysis, a weighted average for the cost of surgery was calculated based on the expected major complication rate for lung cancer thoracic surgery of 20% in high volume institutions [48]. In the sensitivity analyses, the impact of assuming a higher surgical cost with a major complication rate of 44% was also examined [48]. The hospital costs of terminal care were based on a previous study conducted in 1992 and inflated to present day value using the AIHW health deflator [46,49]. All patients
Sensitivity analyses
Variable
Base-case
Best-case scenario
Worst-case scenario
Source
Screening variables Sensitivity, baseline Specificity, baseline Sensitivity, annual screen Specificity, annual screen Proportion of cancers in screened group that are stage I Cancers detected that are ‘overdiagnosed’ (%)
0.81 0.76 0.86 0.97 0.69 0.12
1 0.95 1 0.99 0.85 0
0.65 0.49 0.65a 0.87 0.4 0.2
[18,22,21] [9,22] [18] [9,18] [5,21] [38,39]
0.033
0.003
0.086
[21,10]
0.019
0.006
0.067
[10,21]
0.02 Yes
0.016 None
0.04 Yes
[53—55] [5,22]
280 110
140 0
420 110
[44] [44]
Investigation and treatment variables Probability of false positive examinations being further investigated with fine needle aspiration or bronchoscopy Probability of false positive results being referred for surgical biopsy Surgical mortality rateb CT follow-up of nodules not requiring immediate biopsy (detailed CT & repeat CT at 3 and 6 months) Cost variables Cost of CT scan ($) Cost of physician consultation for those with positive CT but not requiring immediate invasive investigation ($) Average cost of surgery ($) Cost offsets (treatment costs by stage) Recruitment costs (per individual recruited) ($)
9704
9704
12,467
DRGs
0
0
16
[45]
Other Utility in individuals with nodules being followed on CT Utility in individuals with screen detected localized cancer Adherence with baseline screening (%) Adherence with annual screening (%) Annual discount rate for costs and benefits (%)
0.98 0.88 100 86 3
1 0.93 100 98 0
0.96 0.88 86d 74 7
[41] [41] [5] [9,18] [51]
a b c d e
c
e
Range taken from results of baseline screening. For limited resections and lobectomy. Treatment costs by stage for base-case analysis are outlined in the text. The lower limit was based on the weighted average for adherence with annual screening. 50% increase in cost of late stages.
Screening for lung cancer with low dose spiral CT
Table 3
179
Key cost variables in the model
Variable
Cost (undiscounted) ($)
Source
Average cost of diagnostic work up for individuals with abnormal CT results referred for further investigation Average cost of pre surgical staging and work up Average cost of surgery (major complication rate of 20%) Average cost of surgery (major complication rate of 44%) Cost of chemotherapy (palliative) Cost of chemoradiation (radical treatment) Cost of terminal care
899.41
MBSa
1485 9704 12,467 8066 13,546 6815
MBSa DRGsb [48] DRGs [48] DRGs MBSa [49]
a b
Schedule fee. Diagnosis related groups.
who died from lung cancer were assumed to have progressed through a terminal phase requiring terminal care prior to death. It was also assumed that during the year prior to death, 50% of patients required a course of palliative radiotherapy. The costs of medical follow-up and radiotherapy were based on the Medicare Benefits Schedule. Costs of followup were limited to those incurred by regular medical review for the first 2 years after diagnosis. Frequency of follow-up after surgery was based on the recommendations of experts [50]. It was assumed that individuals had an annual CT during the first 2 years of follow-up although the benefits of this approach are not proven [50]. Key treatment costs used in the model are summarised in Table 3. From this data the average costs for stage I, stage II, stage IIIA, stage IIIB and stage IV lung cancer were estimated to be $15,029, $17,041, $18,406, $21,792 and $10,701, respectively. The impact of assumptions about cost offsets was examined in a one-way sensitivity analysis in which the costs of late stage disease (stages III—IV) were increased by 50%.
2.9. Adjustment for differential timing Both costs and benefits were discounted to their present value. An annual discount rate of 3% was used in the base-case analysis, in keeping with the recommendations of a consensus panel of health Table 4
economists [51]. This rate has also been used in the Australian burden of disease studies [52]. In a sensitivity analysis, the impact of varying the discount rate between 0 and 7% was examined.
3. Results 3.1. Cost-effectiveness For the base-case analysis, total screening, followup, diagnostic and treatment costs are outlined in Table 4 with an incremental discounted cost of $16,486,239 or an average of $1,649 per participant. At 15 years of follow-up from the onset of screening, the total number of life years was 104,121 in the screened group and 103,834 for the usual care group (for a cohort of 10,000 males aged 60—64 years with an annual probability of lung cancer of 0.0052). The incremental cost-effectiveness ratio was $57,325 per life-year saved and $105,090 per QALY saved. For males aged 65—69 years with the same annual probability of lung cancer, the costeffectiveness ratio was $68,079 per life-year saved and $137,798 per QALY saved. For females aged 60—64 years with the same annual probability of lung cancer, the cost-effectiveness ratio was $51,001 per life-year saved and $88,583 per QALY
Total costs (base-case) Screening group
No screening group
Discounted (3% p.a.)
Undiscounted
Discounted (3% p.a.)
Undiscounted
Screening costs (CT scan) ($) Follow-up of abnormal screening tests and diagnostic costs ($) Treatment costs ($)
11,939,834 4,031,230
12,607,292 4,121,128
0 215,968
0 234,205
4,159,595
4,405,535
3,428,451
3,768,623
Total ($)
20,130,658
21,133,955
3,644,419
4,002,828
180
R. Manser et al.
saved. For males aged 60—64 years with an annual probability of lung cancer of 0.00283 (the probability for a current smoker aged 60 year who has smoked 15 cigarettes per day for 40 years [17]), the cost-effectiveness ratio was $114,056 per life-year saved and $278,219 per QALY saved. For males aged 60—64 years with an annual probability of lung cancer of 0.00984 (the probability for a current smoker aged 60 year with a history of asbestos exposure who has smoked 50 cigarettes per day for 45 years [17]), the cost-effectiveness ratio was $32,617 per life-year saved and $53,968 per QALY saved.
3.2. Sensitivity analyses Changes in variables (using the range in Table 2), which either increased or decreased the cost-
Table 5
effectiveness ratio (in QALYs) by more than 25% are shown in Table 5. In addition, a 50% increase or decrease in several cost variables (including diagnostic evaluation, pre-operative work up, chemotherapy, chemoradiation, surgery and terminal care) did not substantially impact on cost-effectiveness (less than 25% change in cost-effectiveness ratio). When recruitment costs of $16 per participant recruited were included in the analysis, the cost-effectiveness ratio was only marginally increased at $107,267 per QALY. When the cost of physician follow-up for individuals with positive CT examinations not requiring immediate biopsy or invasive investigation was assumed to be zero, the cost-effectiveness ratio was minimally reduced to $55,932 per life-year saved and $102,536 per QALY.
Results of one-way sensitivity analyses
Variable
Incremental increase in costs (screened group) ($)
Incremental cost per life year saved ($)
Incremental cost per quality-adjusted life year ($)
Base-case analysis (males aged 60—64 years) Low sensitivity (65%) High sensitivity (100%) Low specificity (49% at baseline) High specificity (95% at baseline) Detailed CT and 3 and 6 month CT examinations not required Proportion of overdiagnosed cancers (0) Proportion of overdiagnosed cancers (0.2) Proportion of cancers detected by screening that are stage I = 85% Proportion of cancers detected by screening that are stage I = 40% High rate of surgical and non surgical biopsy for benign disease Low rate of surgical and non surgical biopsy for benign disease Discount rate 0 Discount rate 7% Cost of CT $140 Cost of CT $420 Cost offsets: 50% increase in cost of stage III to IV cancera Utility in individuals with screen detected localised cancer (including ‘‘overdiagnosed’’ cases) = 0.93 Utility in individuals with nodules being followed by CT = 0.96 Utility in individuals with nodules being followed by CT = 1
16,486,239
57,325
105,090
16,347,526 16,608,960 23,033,292 13,452,752 13,808,113
82,426 44,988 85,713 45,274 48,012
186,941 75,337 289,695 69,510 88,018
16,164,862 16,753,569 16,415,915
55,377 58,990 41,480
83,691 132,228 63,024
16,613,701
181,466
Dominated
18,020,221
69,993
145,645
16,037,884
54,226
96,697
17,142,163 15,719,153 9,514,822 23,457,656 15,797,001
44,360 80,055 33,084 81,565 54,927
73,586 187,859 60,651 149,529 100,695
16,486,239
57,325
80,406
16,486,239
57,325
131,960
16,486,239
57,325
87,311
a Changes in the cost of late stage disease did not alter the cost-effectiveness by more than 25% but these figures are presented here because of the potential importance of cost offsets in relation to screening.
Screening for lung cancer with low dose spiral CT
181
Fig. 3 Base-case analysis: relationship between cost utility and effectiveness.
3.3. Best and worst-case scenarios Best and worst-case analyses were conducted by altering the values of those variables that had the greatest impact on cost-effectiveness as listed in Table 5. The values used for these analyses are listed in Table 2 under best and worst-case scenario. In the best-case scenario, the cost-effectiveness ratio was $10,569 per life-year saved and $10,834 per QALY saved. In the worst-case analysis, screening was harmful with 67 years of life lost in the screened group relative to usual care and (319 quality-adjusted years of life lost).
3.4. Relationship between efficacy of screening and cost-effectiveness The model was used to examine the relationship between efficacy in terms of the expected reduction in lung cancer mortality at 7 years (based on best available data) and anticipated cost-effectiveness. In the absence of evidence from naturalistic studies or demonstration projects, no specific adjustment was made for the impact of a real life setting. In the base-case analysis, lung cancer mortality
(including deaths related to surgery but excluding deaths from other causes in individuals with lung cancer) was reduced by 27% and all cause mortality by 2.1%. The relationship between efficacy and cost-effectiveness was examined in the model by varying the stage distribution of cancers detected by screening. The results are displayed in Fig. 3. Using a threshold value of $50,000 per QALY, a 40% or greater reduction in lung cancer mortality by screening would be considered cost-effective. However, these values are dependent on assumptions used in the model, for example, if the cost of CT is reduced to $140 then a 30% or greater reduction in lung cancer mortality would be considered cost-effective using a threshold value of $50,000 per QALY. To explore further what level of effectiveness in practice would be considered cost-effective under more favourable assumptions, the graph was repeated for a very high risk population (annual incidence of 0.00984) and assuming a cost of $140 and a high baseline specificity of 95%. These variables were chosen for this analysis because they could feasibly change, in particular specificity could be improved as experience is gained with diagnostic protocols and the cost of CT scanning could fall with increased CT utilization. The results are
Fig. 4 Relationship between cost-utility and effectiveness (in very high-risk cohort with low-cost CT and high specificity).
182 displayed in Fig. 4. This graph highlights that even under favourable assumptions, reductions in lung cancer mortality of less than 20% are unlikely to be cost-effective based on current knowledge and practice.
4. Discussion Based on the assumptions in the present analysis, the cost-effectiveness of CT screening for lung cancer appears to be marginal compared with other accepted cancer screening interventions and commonly accepted health care interventions in general [56—58]. The most feasible scenario under which screening could be cost-effective would be if very high-risk individuals are targeted and screening is either highly effective or CT screening costs fall substantially. Optimising specificity and intervention rates for benign disease are also likely to be important for improving cost-effectiveness. Many of the variables in the present model are imprecise largely because of the high level of uncertainty about how to estimate effectiveness from the currently available studies, which are all uncontrolled. Importantly, in keeping with the findings of Mahadevia et al., we found in the worstcase analysis that, under certain conditions, which are plausible given current knowledge, the net effect of screening could be harmful [11]. Indeed, our findings are similar to those of Mahadevia et al. who concluded from their analysis that helical CT screening is ‘‘unlikely to be cost-effective without substantial reductions in mortality, high rates of adherence, lower rates of overdiagnosis and lower costs per screening test’’ [11]. Others have reported more favourable estimates of the cost-effectiveness of CT screening for lung cancer in high-risk individuals. However, in one-such analysis, no allowance was made for overdiagnosis or lead-time bias [13]. While in other analyses, the models were based on the results of a single trial (which reported that 85% of screen detected lung cancers were stage I) and assumed a sensitivity of 100% [12,59,60]. The present analysis examines opportunistic screening rather than an organised programme. Such programmes might ensure comprehensive access and promote quality and accountability, but in general there has been little evaluation of the costeffectiveness of organised programmes relative to opportunistic screening [61,62]. An organised programme may require significant additional investment but some of these costs may be offset by gains in quality and a reduction in over-screening com-
R. Manser et al. pared with opportunistic screening [62]. There was insufficient data on costs available to thoroughly evaluate a screening programme at this stage, but this type of analysis could be conducted in the future if data from Australian pilot studies becomes available. Whilst we did not consider a comprehensive screening programme, we did examine in a sensitivity analysis what the impact of including some recruitment costs would be. Although systematic approaches to recruitment may improve the uptake of screening such interventions tend to be expensive [62]. More intensive recruitment strategies may increase uptake but may be less costeffective in some circumstances [45,63]. No cost data was available in relation to recruitment costs for lung cancer screening and costs were estimated from a breast cancer-screening programme. The inclusion of such recruitment costs did not alter the cost-effectiveness ratio substantially, but a more comprehensive recruitment strategy involving media and/or a registry may well have. The present model has several assumptions that favour screening. In particular, the change in stage distribution of the screened cohort was used to model survival, but because current diagnostic tools may not detect occult metastases, it is not clear that this represents a true stage shift, and therefore could overestimate the benefit of screening. Furthermore, the model only considered whether or not individuals were adherent with attending CT screening or not. Individuals with abnormal CT examinations or cancer were assumed to be compliant with subsequent investigations and treatment, however some individuals with abnormal results may decline further investigation and treatment or no longer be fit for treatment because of incident co-morbid disease. Such non-adherence would decrease cost-effectiveness further. In addition, test performance characteristics and intervention rates were based on the results of clinical trials and it is not clear how this might compare with actual practice. Because CT screening is still an experimental tool, there is currently little local expertise with this approach. If future controlled trials show that screening is both efficacious and potentially cost-effective, the issue of effectiveness in actual clinical practice would need to be addressed. Clinicians and radiologists would require appropriate skills to implement screening. Importantly, the present analysis shows that changes in test performance and intervention rates for benign disease (which may be operator dependent) can impact significantly on cost-effectiveness. A further limitation of this analysis is that we have not examined in the model the potential impact of radiation exposure from CT examinations. However,
Screening for lung cancer with low dose spiral CT based on current estimates this is likely to be minimal [64]. It could be argued that our examination of the impact of uncertainty in the clinical and economic data is crude; however, we consider this analysis to be primarily explorative with a view to informing the current research agenda in relation to this issue. Once more data on the efficacy and effectiveness of CT screening is known then probabilistic sensitivity analysis would better inform policy decisions. Comprehensive cost data by lung cancer stage were not available for this analysis and the exclusion of out of hospital costs is a limitation. In particular, if the costs of advanced stage disease have been underestimated, this could bias the results against screening. However, sensitivity analysis showed that the cost-effectiveness ratio was relatively insensitive to large changes in cost components apart from the cost of CT scanning. The costs of surgery and CT scans were considerably higher in overseas studies suggesting that such analyses may not be generalisable [11]. If CT screening studies (either observational or controlled trials) are conducted locally, prospective data on costs should be collected including cost impacts on patients so that future analyses might be under taken from a broader perspective. If future local studies were to be conducted then information on the incidence of lung cancer in relation to risk factors in the Australian population would also be valuable. Our estimates of lung cancer incidence in relation to risk factors were based on overseas data [17], but variation in levels of risk have been described between different populations [65]. Another issue that this preliminary evaluation highlights is the need for trials to gather data on quality of life and to give consideration to how health state preferences should be valued. Preference weighting of health states may be ascertained using different theoretical approaches and different populations [66]. Different methods may produce variations in scores when applied to specific health states or diseases [66,67]. According to current recommendations, community preferences for health states are the most appropriate for the basecase analysis [66]. The values used in this analysis were derived from expert opinion and to our knowledge, community based preferences have not been published for lung cancer across the range of disease stages and treatments that apply to this model [40,41,68,69]. We found that the cost utility ratio was dependent on assumptions about quality of life in individuals with screen detected localized cancer and the disutility associated with a false positive diagnosis. Ideally lung cancer screening trials should evaluate long-term quality of life using
183 methods that can be appropriately adapted for economic evaluations. The findings of this analysis highlight that based on current evidence, there is substantial uncertainty about the potential benefits of helical CT screening for lung cancer and at worst, screening could result in net harm. In the 1960s, the World Health Organisation outlined several principles of early disease detection and more recently guidelines for assessing screening recommendations have been published [70,71]. In keeping with these principles, it is important to establish whether early detection and treatment of lung cancer will improve prognosis before wide spread screening can be recommended [70,71]. Unless screening costs fall substantially, large reductions in lung cancer mortality will be required for CT screening to be costeffective and the large randomised controlled studies under way or being planned internationally are likely to have sufficient statistical power to detect these reductions [7,72]. However, it would be important for such trials to evaluate approaches that maximise specificity and limit excessive evaluation of false positive findings. One preliminary study suggests this could be feasible [22]. Furthermore, poor quality of life after a diagnosis of lung cancer reduces the potential health benefit from screening. Further studies are needed to determine the quality of life in individuals with screen detected early stage lung cancer and the disutility associated with false positive test results.
Acknowledgement Renee Manser is supported by a NHMRC postgraduate scholarship number 201713.
References [1] Ries LAG. Influence of extent of disease, histology and demographic factors on lung cancer survival in the SEER population-based data. Semin Surg Oncol 1994;10:21—30. [2] Nesbitt J, Putnam JB, Walsh GL, Roth JA, Mountain CF. Survival in early-stage non-small cell lung cancer. Ann Thor Surg 1995;60:466—72. [3] Goumas C, O’Connell DL, Smith DP, Armstrong BK. Lung cancer in NSW in 1973 to 1998. Sydney: The Cancer Council NSW; 2001. [4] Manser R, Irving LB, Byrnes G, Abramson M, Stone C, Campbell D. Screening for lung cancer (cochrane review). In: The Cochrane Library. Oxford: Update Software; 2001. [5] Henschke C, McCauley DI, Yankelevitz DF, Naidich DP, McGuinness G, Miettinen OS, et al. Early Lung Cancer Action Project: overall design and findings from baseline screening. Lancet 1999;354:99—105.
184 [6] Patz E, Goodman PC, Bepler G. Screening for lung cancer. N Engl J Med 2000;343:1627—33. [7] Marcus P. Lung cancer screening: an update. J Clin Oncology 2001;19(Suppl 18):83s—6s. [8] Diederich S, Wormanns D, Heindel W. Lung cancer screening with low-dose CT. Eur J Radiol 2003;45:2—7. [9] Swensen S, Jett JR, Sloan JA, Midthun DE, Hartman TE, Sykes AM, et al. Screening for lung cancer with low-dose spiral computed tomography. Am J Respir Crit Care Med 2002;165:508—13. [10] Diederich S, Wormanns D, Semik M, Thomas M, Lenzen H, Roos N, et al. Screening for early lung cancer with lowdose spiral CT: prevalence in 817 asymptomatic smokers. Radiology 2002;222(3):773—81. [11] Mahadevia P, Fleisher LA, Frick KD, Eng J, Goodman SN, Powe NR. Lung cancer screening with helical computed tomography in older adult smokers: a decision and costeffectiveness analysis. JAMA 2003;289(3):313—22. [12] Marshall D, Simpson KN, Earle CC, Chu C. Economic decision analysis model of screening for lung cancer. Eur J Cancer 2001;37(14):1759—67. [13] Chirikos T, Hazelton T, Tockman M, Clark R. Screening for lung cancer with CT: a preliminary cost-effectiveness analysis. Chest 2002;121:1507—14. [14] NCCI Working Group on Lung Cancer Screening. Lung cancer screening by helical computed tomography. Melbourne (Australia): National Cancer Control Initiative; March 2003. [15] Sonnenberg F, Beck JR. Markov models in medical decision making: a practical guide. Med Decis Making 1993;13(4):322—38. [16] Black W. Should this patient be screened for cancer? Eff Clin Pract 1999;2(2):86—95. [17] Bach P, Kattan MW, Thornquist MD, Kris MG, Tate RC, Barnett MJ, et al. Variations in lung cancer risk among smokers. J Natl Cancer Inst 2003;95(6):470—8. [18] Sobue T, Moriyama N, Kaneko M, Kusumoto M, Kobayashi T, Tsuchiya R, et al. Screening for lung cancer with low-dose helical computed tomography: anti-lung cancer association project. J Clin Oncol 2002;20(4):911—20. [19] Swensen S, Jett JR, Hartman TE, Midthun DE, Sloan JA, Sykes AM, et al. Lung cancer screening with CT: Mayo clinic experience. Radiology 2003;226(3):756—61. [20] Henschke C, Naidich DP, Yankelevitz DF, McGuinness G, McCauley D, Smith JP, et al. Early lung cancer action project: initial findings on repeat screening. Cancer 2001;92:153—9. [21] Tiitola M, Kivisaari L, Huuskonen MS, Mattson K, Koskinen H, Lehtola H, et al. Computed tomography screening for lung cancer in asbestos-exposed workers. Lung Cancer 2002;35:17—22. [22] Pastorino U, Bellomi M, Landoni C, De Fiori E, Arnaldi P, Picchio M, et al. Early lung-cancer detection with spiral CT and positron emission tomography in heavy smokers: 2 year results. Lancet 2003;362:593—7. [23] Reif M, Socinski MA, Rivera MP. Evidence-based medicine in the treatment of non-small cell lung cancer. Clin Chest Med 2000;21(1):107—20. [24] Scott C, Zalcberg J, Irving L. Treatment principles in advanced non-small-cell lung cancer. Aust N Z J Surg 1996;66:688—93. [25] Department of Human Services SACR. Epidemiology of cancer in South Australia: incidence, mortality and survival 1977 to 1999. Incidence and Mortality 1999. Adelaide: Department of Human Services; 1999. Report no.: Cancer series no. 22. [26] Richardson G, Thursfield VJ, Giles GG. Reported management of lung cancer in Victoria in 1993: comparison with best practice. Med J Aust 2000;172:321—4.
R. Manser et al. [27] Mountain C. Revisions in the international system for staging lung cancer. Chest 1997;111:1710—7. [28] Australian Bureau of Statistics. Deaths, Australia. Canberra: Australian Bureau of Statistics; 2000. December 2001. Report no. 3302.0. [29] Hill D, White VM, Scollo MM. Smoking behaviours of Australian adults in 1995: trends and concerns. Med J Aust 1998;168:209—13. [30] Doll R, Peto R, Wheatley K, Gray R, Sutherland I. Mortality in relation to smoking: 40 years’ observations on male British doctors. BMJ 1994;309:901—11. [31] Coorporation S. Stata. In: 6.0 for Windows ed. Texas; 1999. [32] Naruke T, Kuroishi T, Suzuki T, Ikeda S, The Japanese Lung Cancer Screening Research Group. Comparitive study of survival of screen-detected compared with symptomdetected lung cancer cases. Semin Surg Oncol 1993;9: 80—4. [33] Flehinger BJ, Kimmel M, Melamed MR. The effect of surgical treatment on survival from early lung cancer. Implications for screening. Chest 1992;101(4):1013—8. [34] Martini N, Rusch VW, Bains MS, Kris MG, Downey RJ, Flehinger BJ, et al. Factors influencing ten-year survival in resected stages I to IIIA non-small cell lung cancer. J Thorac Cardiovasc Surg 1999;117:32—8. [35] Aoki T, Nakata H, Watanabe H, Nakamura K, Kasai T, et al. Evolution of peripheral lung adenocarcinomas: CT findings correlated with histology and tumour doubling time. AJR 2000;174:763—8. [36] Sobue T, Suzuki T, Matsuda M, Kuroishi T, Ikeda S, Naruke T. Survival for clinical stage I lung cancer not surgically treated: comparison between screen-detected and symptom-detected cases. Cancer 1992;69:685—92. [37] Black W. Overdiagnosis: an underrecognised cause of confusion and harm in cancer screening. J Natl Cancer Inst 2000;92(16):1280—2. [38] Chan C, Wells CK, McFarlane MJ, Feinstein AR. More lung cancer but better survival: implications for secular trends in ‘‘necropsy surprise’’ rates. Chest 1989;96:291—6. [39] Suen K, Lau LL, Yermakov V. Cancer and old age: an autopsy study of 3,535 patients over 65 years old. Cancer 1974;33:1164—8. [40] Tengs T, Wallace A. One thousand quality-of-life estimates. Med Care 2000;38:583—637. [41] Earle C, Chapman RH, Baker CS, Bell CM, Stone PW, Sandberg EA, et al. Systematic overview of cost-utility assessments in oncology. J Clin Oncol 2000;18(18):3302—17. [42] Raab S, Hornberger J. The effect of patient’s risk taking attitude on the cost-effectiveness of testing strategies in the evaluation of pulmonary lesions. Chest 1997;111(6):1583—90. [43] Luce B, Manning WG, Siegel JE, Lipscomb J. Estimating costs in cost-effectiveness analysis. In: Gold MRSJ, Russel LB, Weinstein MC, editors. Cost-effectiveness in health and medicine. New York: Oxford University Press; 1996. p. 176—213. [44] Australian Department of Health and Ageing. Medicare Benefits Schedule. Canberra; 2002. [45] Hurley SJD, Livingston PM, Reading D, Cockburn J, FlintRichter D. Effectiveness, costs, and cost-effectiveness of recruitment strategies for a mammographic screening program to detect breast cancer. J Natl Cancer Inst 1992;84:855—63. [46] Australian Institute of Health and Welfare. Health expenditure bulletin no. 17: Australia’s health services expenditure to 1999-00. Canberra: Australian Institute of Health and Welfare; 2001. Report no.: Health and Welfare Expenditure series no. 12.
Screening for lung cancer with low dose spiral CT [47] Duckett S. Casemix funding in Victoria: the first year: what worked, what didn’t. Med J Aust 1995;162:650—4. [48] Bach P, Cramer LD, Schrag D, Downey RJ, Gelfand SE, Begg CB. The influence of hospital volume on survival after resection for lung cancer. N Eng J Med 2001;345(3):181—8. [49] Aristides M, Shiell A. The effects on hospital use and costs of a domicillary palliative care nursing service. Aust Health Rev 1993;16:405—13. [50] Younes R, Gross JL, Deheinzelin D. Follow-up in lung cancer: how often and for what purpose? Chest 1999;115:1494—9. [51] Lipscomb J, Weinstein MC, Torrance GW. Time preference. In: Gold MR, Siegel JE, Russel LB, Weinstein MC, editors. Cost-effectiveness in health and medicine. New York: Oxford University Press; 1996. p. 214—238. [52] Mathers C, Vos ET, Stevenson CE, Begg SJ. The Australian burden of disease study: measuring the loss of health from diseases, injuries and risk factors. MJA 2000;172:592—6. [53] British Thoracic Society. Society of cardiothoracic surgeons of Great Britain and Ireland working party. Guidelines on the selection of patients with lung cancer for surgery. Thorax 2001;56:89—108. [54] Licker M, de Perrot M, Hohn L, Tschopp JM, Robert J, Frey JG, et al. Perioperative mortality and major cardiopulmonary complications after lung surgery for non-small cell carcinoma. Eur J Cardiothorac Surg 1999;15(3):314—9. [55] Keagy B, Starek PJ, Murray GF, Battaglini JW, Lores ME, Wilcox BR. Major pulmonary resection for suspected but unconfirmed malignancy. Ann Thorac Surg 1984;38(4): 314—6. [56] George B, Harris A, Mitchell A. Cost-effectiveness analysis and the consistency of decision making: evidence from pharmaceutical reimbursement in Australia (1991 to 1996). Pharmacoeconomics 2001;19(11):1103—9. [57] Carter R, Glasziou P, van Oortmarssen G, de Koning H, Stevenson C, Salkeld G, et al. Cost-effectiveness of mammographic screening in Australia. Aust J Public Health 1993;17:42—50. [58] Salkeld G, Young G, Irwig L, Haas M, Glasziou P. Costeffectiveness analysis of screening by faecal occult blood testing for colorectal cancer in Australia. Aust N Z J Public Health 1996;20(2):138—43. [59] Wisnivesky J, Mushlin AI, Sicherman N, Henschke C. The cost-effectiveness of low-dose CT screening for lung cancer: preliminary results of baseline screening. Chest 2003;124:614—21.
185 [60] Marshall D, Simpson KN, Earle CC, Chu C. Potential costeffectiveness of one-time screening for lung cancer in a high risk cohort. Lung Cancer 2001;32(3):227—36. [61] Hakama M, Chamberlain J, Day NE, Miller AB, Prorok PC. Evaluation of screening programmes for gynaecological cancer. Br J Cancer 1985;52:669—73. [62] Madlensky L, Goel V, Polzer J, Ashbury FD. Assessing the evidence for organised cancer screening programmes. Eur J Cancer 2003;39:1648—53. [63] Hyndman J, Straton JAY, Pritchard DA, Le Sueur H. Cost-effectiveness of interventions to promote cervical screening in general practice. Aust N Z J Public Health 1996;20:272—7. [64] Diederich S, Lenzen H. Radiation exposure associated with imaging of the chest: comparison of different radiographic and computed tomography techniques. Cancer 2000;89(Suppl 11):2457—60. [65] Stellman SD, Takezaki T, Wang L, Chen Y, Citron ML, Djorkjevic MV, et al. Smoking and lung cancer risk in American and Japanese men: an international case-control study. Cancer Epidemiol Biomarkers Prev 2001;10:1193—9. [66] Gold M, Patrick DL, Torrance GW, Fryback DG, Hadorn DC, Kamlet MS, et al. Identifying and valuing outcomes. In: Gold MR, Siegel JE, Russel LB, Weinstein MC, editors. Costeffectiveness in health and medicine. New York: Oxford University Press; 1996. p. 82—124. [67] Nease R, Kneeland GT, et al. Variation in patient utilities for outcomes of the management of chronic stable angina: implications for clinical practice guidelines. Ischemic heart disease patient outcomes research team. JAMA 1995;273:1185—90. [68] Montazeri A, Gillis CR, McEwan J. Quality of life in patients with lung cancer: a review of literature from 1970 to 1995. Chest 1998;113:467—81. [69] Trippoli S, Vaiani M, Lucioni C, Messori A. Quality of life and utility in patients with non-small cell lung cancer. Qualityof-Life Study Group of the Master 2 Project in Pharmacoeconomics. Pharmacoeconomics 2001;19(18):855—63. [70] Wilson J, Jungner G. Principles and practice of screening for disease. Geneva: WHO; 1968. Report no. 34. [71] Barratt A, Irwig L, Glasziou P, et al. Users’ guides to the medical literature XVII: how to use guidelines and recommendations about screening. JAMA 1999;281(21):2029—34. [72] Diederich S, Wormanns D, Heindel W. Lung cancer screening with low-dose CT. Eur J Radiol 2003;45:2—7.