y=
50
0.0000004589x4
70
90
0.0001898524x3
110
0.0281224146x2
+ - 1.6234882439x + 33.2280734891 R! = 0.9876081369
130
HR (b/min)
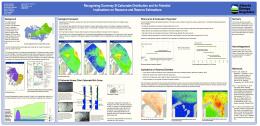
Figure 2. Graph (example, par-cipant EB001) of HR/VO2/EE Measurement Values for a Metabolic Profile Over a Range of Ac-vi-es (BMR -‐ 70% Age Predicted HRmax), resultant polynomial regression curve and equa-on, and correla-on (r2)
Table 8. Polynomial (4th order) Regression Equa-on Coefficients Derived from HR/EE Graphs of HR/VO2/EE Measurement Values for a Metabolic Profile Over a Range of Ac-vi-es (BMR -‐ 70% Age Predicted HRmax)
4)Substrate-‐specific (CHO, FAT) EE measurement values were derived from RQ (VCO2/VO2), for a Metabolic Profile over a range of ac-vi-es (BMR -‐ 70% Age Predicted HRmax, Figure 3). The peak fat oxida-on HR is iden-fied and followed with changes in aerobic fitness, along with the HR associated with CHO metabolic crossover level with the Fat oxida-on curve (Benoit 2015). 5)The VO2/HR exercise profile also provides the data to extrapolate the VO2max associated with the age-‐predicted HRmax, using the linear regression equa-on (Figure 4) 6)The exercise VO2/Ve measurements also provide the data to interpolate the inflec-on at the change in slope corresponding to the Respiratory Threshold (RT). The RT is an indicator of aerobic fitness that can be established and followed to define benefits of exercise interven-on (Figure 4). +,#123#!./"4"56(2"#123#!"# $!./#'74#8#,"29(57:;55"2>;0?#@5"?(6A;)*#
12334)5)6*7)8)9:;)
171! 40171!
!")-.!$%&'(!-.*/011!!
"#!2!"'!3!)-.!
49171! 48171! 46171!
!"#$%&'("
Figure 9. Mean % change week 2 – week 1 for energy values, measured and computed for all par-cipants.
IV. What is the apparent effect of Energy Balance on BMR? A. Energy Balance Effect on Basal Metabolic Rate 1. Results a. BMR-‐ All par-cipants b. For each par-cipant 1) ENERGY BALANCE = EdBC = Ei -‐ Eo a) BMR vs. EB (change in body composi-on) The BMR response to EB is represented in two ways. First, BMR (kcal/day) is normalized rela3ve to lean 3ssue content (kcal/day/kg-‐lean, which is largely responsible for BMR), and associated changes in body composi3on energy (EdBC, kcal/day) that most directly reflect actual EB and -ssue altera-ons. The correla-on of BMR/kg-‐lean with EdBC should illustrate the strongest rela-onship (Figure 10). The rela-onship of BMR to EB does not show a significant linear trend or correla-on (r2 = 0.08696) for the par-cipants as a group. The EB change is imposed through a daily imposi-on of Eo by walking exercise equivalent to 10% of week-‐1 EB Eo. The posi-ve EB values imply that the increase in walking Eo can be counterbalanced by replacing more strenuous ac-vi-es and/or diminishing non-‐exercise ac-vity levels. The trend of change in BMR vs. EB (based on EdBC) using a polynomial regression more closely follows the dynamic response across the range of EB (r2 = 0.73908). This dynamic may indicate an op-mum balance between acutely imposed daily exercise and nega-ve EB at the inflec-on of the curve at -‐2000 kcal/week (Figure 11). -./)01#+(*'234'5-6-0'01#+(*''
!"#$67$2!$.$8))$
/,**"
)$%$$"
),**" %,**"
&$%$$"
',**"
$'****,**"
$3***,**"
$4***,**"
$/***,**"
$%***,**"
*,**" *,**" $',**"
%***,**"
/***,**"
$%,**"
01$$$$%$$"
0*$$$%$$"
0.$$$%$$"
0)$$$%$$"
$),**"
/$%$$" 0/$$$%$$" $%$$"
/$$$%$$"
)$$$%$$"
2!$3$+!4$%&'()*5//&.(6-1$
!"#"$%$$$&'"("&)%&*+" ,-"#"$%$*.+."
$/,**"
!"#$%,**!'
!"#"$%&$'%()"$"'&$*+(%"$"*,***-("."*,/))/" 01"#"*,+)2*3"
Figure 10. BMR (kcal/day/kg-‐lean) at the end of each week related to EB based on the body composi-on change in energy content (EdBC), for all par-cipants collec-vely.
Figure 11. Change in BMR (kcal/day/kg-‐lean) at the end of each week related to EB based on the body composi-on change in energy content (EdBC), for all par-cipants collec-vely.
The BMR vs. EB rela-ons can most per-nently be examined for the individual trends, where specific responses to singular condi-ons are demonstrated dis-nctly for each par-cipant. Three of the four trends show a decline in BMR with more nega-ve EB (EdBC)(Figure 12). BMR vs EB: Ei-Eo [individual-polynomial]
BMR (kcal/d kg-lean) vs EB (Body Comp Change) 40.00
Table 13. (see below) Changes in Body Composi-on Energy; Fat, Lean, Total (DEXA, Date Span, %, kg, kcal) 2. Walking Exercise Energy Expenditure and Targeted Energy Deficit a. The addi-onal walking -me calculated and employed to increase Eo (based on HR) by approximately 10% in the second week was around 19 minute per day, using the 4.0 mph pace HR on the treadmill. 3. Energy Balance Calcula-ons Summary The energy balance equa-on can be arranged three different ways, using two values to calculate the third, allowing comparison between measured values and computed values for each component of the EB equa-on. a. Energy of BC Changes (from DEXA) = Energy Intake – Energy Output (EdBC = Ein -‐ Eo) Changes in the energy content of body cons-tuents directly reflect actual energy balance, since the difference between energy intake and output draws on energy content of body -ssues. The three DEXA measurements produced two calculated energy balance values, for the first and second weeks, and a third for the total change over two weeks, from the first to the third measurements. The technical accuracy is mainly dependent on the two repeated measures each session, and the period of -me between measurements (±718 kcal/day error for a 7 day interval, ±359 kcal/day error for a 14 day interval; Elia,2003). The rela-ve accuracy depends on the total change in the type and amount of body -ssues (error % of measured energy change). 1) Results: Measured BC E Changes The general energy deficit imposed by an increase in walking -me in the second week, with Ei held constant at first-‐week EB levels, resulted in an overall average net loss in adipose (-‐0.52 ±0.63 %, -‐0.43 ±0.33 kg, -‐3604 ±2844 kcal), and net gain in lean -ssue (+0.52 ±0.63 %, 0.40 ±1.13 kg, 468 ±1308 kcal), which reflected a total EdBC deficit (-‐3145 (±2530 kcal)(Table 13, see above). b. Energy Output (HR) = Energy Intake – BC Changes [Eo(HR) = Ei -‐ EdBC] A comparison to the es-mate of energy output from the HR/E equa-on (Table 14) is produced by the difference between energy of intake and body content changes over the interval of a week. This comparison may provide a means to roughly calibrate the HR/E equa-ons. c. Energy Intake (food) = Energy Output + BC Changes [Ein(food) = Eo + EdBC] Since food can be accurately quan-fied for a single day it was combined with the Daily TEE to calculate a Daily Energy Balance with reasonable precision over a week average (Table 14). This in turn more exactly matches food intake to the different ac-vity of each unique day that predicts energy differences of body composi-on changes. d. Results: Comparison of Measured and Calculated Values for each Par-cipant The data demonstrates disparity in values from direct measurements, and when Eo(HR) is involved directly or as part of a computed EB component for each par-cipant over one-‐week spans (Table 14), and collec-vely averaged over the en-re 14 day span of the trial (Table 15, Figures 7 & 8). The differences imply that Eo(HR) produces a systema-c overes-mate of energy expenditure (Eo) in comparison to the values computed by the other directly measured components, Ei – EdBC = Eo. However, the overlap of SD ranges may imply a non-‐significant difference, and substan-al individual variance. The measured and computed values for each specific component are displayed adjacently to illustrate the comparison of each component most directly (Figure 7). The measured and computed EB components are also grouped separately, to illuminate the dis-nc-ons of the different parts of the whole EB equa-ons (Figure 8).
!"'!$%&'(!+,*!
6444!
17444!
73!:;"0;>"1;??!@A-B".C@!
16444!
D. Ac-vity Records 1. Par-cipants were asked to record the -me and type of major changes in ac-vity in a Daily Ac-vity Log. a. Ac-vity records appear to have been consistently completed, specifying the nature of events, their subjec-ve intensity, and when changes occurred. b. The frequency of event recording varied between days and par-cipants. c. The specificity of event descrip-ons had some varia-on. When there were events with short periods and frequent changes the event descrip-ons tended to be generalized (i.e. working, loading and unloading trucks, for 13 hours). d. In certain situa-ons par-cipants would record events on smaller, more easily carried paper, and then transcribe the notes to the official record. E. Rela-vely Normal Living Condi-ons 1. Time Required for Measurements The -me required to perform the measurements was es-mated through informal verbal recall ques-ons, -me scheduled in the labs, and daily records of exercise -me. a. Recall es-mates An analysis of the es-mated -me invested, distribu-on of -me for the various types of measurements, and subjec-ve impact is provided in the table below. The responses were not available for all par-cipants for the two weeks. No informa-on was obtained from EB006, and only one week for EB007 (par-al) and EB009. 1) Results The -me es-mated to perform measurements each day, excluding lab measurements and exercise, ranged from 51 to 104 minutes per day. The independent responses were fairly consistent for the two par-cipants who provided informa-on on both weeks (104 and 96, 64 and 51). These es-mated imply that rou-ne measurements were perceived to be slightly more efficient in the second week. b. Lab measurements The records indicate that lab measurements required approximately 2 hours on one day (7 days average of 17 min/day) and three hours on a second day (7 days average of 26 min/day), summing to 5 hours per week (7 days average of 43 min/day). c. Exercise -me Exercise -me demanded 30 minutes per day in the first week, and average of 49 minutes (±5.9 min) per day in the second week to achieve an approximate 10% increase in Eo (based on Ei-‐EdBC) from the first week. d. Total -me requirement In the first week the total -me invested for all measurements averaged 71 (±27 min/d) for general ac-vi-es + 26 (min/d) avg. for Full labs + 17 min/d avg. for BMR Labs + 30 min/d walking, totaling an average of 144 min/d, or 16.8 hours/week. In the second week improved efficiency for general ac-vi-es combined with an increased walking -me elevated the average total daily -me invested to 171 min/d, or 20.0 hours/week. III. To what degree can individual energy balance values be calculated for the par-cipants on the basis of the laboratory and field measurements? A. Energy Balance 1. Calculated Total Energy Expenditure (TEE) and HR Record Comple-on The completed daily HR data was entered in to an Excel spreadsheet and applied to the refined HR/E rela-onship polynomial regression equa-on to generate an es-mate of Total Energy Expenditure for 24-‐ hour periods for all par-cipants. The 14-‐day average TEE was computed for all par-cipants (3231 ±1587 kcal/day, and range of 6592 – 2728 kcal/day). The % Completeness of HR record was also included (65 ±14.1 kcal/day, range 95 – 57 kcal/day, Table 12). a. Results Body Comp. Changes DEXA
Table 12. 14-‐Day Average Daily % HR Record Comple-on and Energy Expenditure, Eo(HR)
9444!
17444!
Time of Day (hh:mm)
Figure 5. Daily HR Record (example, par-cipant EB001)
9444!
!"#$%&#'(
80
(!"
!"#$%&#'(
!"#$%&'()'*+,'#-.'/0'1234'
120 100
)*+,-'(.#$#*"+(/0120*+*3(4#$5+6( 78,+"3(9+#65,+(:6;(/01253+&(?(7#'(@:+,#-+(
;BC7=(D(@$$(C5EF+"36(
)*+,-'(.#$#*"+(/0120*+*3(4#$5+6( 78,+"3(9+#65,+(:6;(/01253+&(