Pathophysiology/Complications O R I G I N A L
A R T I C L E
Conduction Slowing in Diabetic Sensorimotor Polyneuropathy SAMANTHA K. DUNNIGAN, HAMID EBADI, MD1 ARI BREINER, MD1 HANS D. KATZBERG, MD1
MSC
1
LEIF E. LOVBLOM, MSC2 BRUCE A. PERKINS, MD, MPH2 VERA BRIL, MD1
OBJECTIVEdMild demyelination may contribute more to the pathophysiology of nerve fiber injury in diabetic sensorimotor polyneuropathy (DSP) than previously thought. We investigated the clinical and electrodiagnostic classifications of nerve injury in diabetic patients to detect evidence of conduction slowing in DSP. RESEARCH DESIGN AND METHODSdType 1 diabetic subjects (n = 62) and type 2 diabetic subjects (n = 111) with a broad spectrum of DSP underwent clinical examination and nerve conduction studies (NCS). Patients were classified as having axonal (group A), conduction slowing (group D), or combined (group C) DSP based on electrodiagnostic criteria. Patients with chronic immune-mediated neuropathies were not included. The groups were compared using ANOVA, contingency tables, and Kruskal-Wallis analyses. RESULTSdOf the 173 type 1 and type 2 diabetic subjects with a mean age of 59.1 6 13.6 years and hemoglobin A1c (HbA1c) of 8.0 6 1.8% (64 6 19.7 mmol/mol), 46% were in group A, 32% were in group D, and 22% were in group C. The severity of DSP increased across groups A, D, and C, respectively, based on clinical and NCS parameters. The mean HbA1c for group D subjects (8.9 6 2.3% [74 6 25.1 mmol/mol]) was higher than for group A and group C subjects (7.7 6 1.4% [61 6 15.3 mmol/mol] and 7.5 6 1.3% [58 6 14.2 mmol/mol]; P = 0.003), and this difference was observed in those with type 1 diabetes. CONCLUSIONSdThe presence of conduction slowing in patients with suboptimally controlled type 1 diabetes indicates the possibility that this stage of DSP may be amenable to intervention via improved glycemic control. Diabetes Care 36:3684–3690, 2013
D
iabetic sensorimotor polyneuropathy (DSP) is a common complication of both type 1 diabetes and type 2 diabetes, and it is thought to occur because of hyperglycemia-related peripheral nerve damage (1). The diagnosis of DSP is based on clinical examination and electrodiagnostic studies. Because DSP varies from subclinical to symptomatic, nerve conduction studies (NCS) that provide an objective and quantitative estimation of peripheral nerve function are critical in confirming a diagnosis of DSP and estimating severity (1,2). The prevailing view of the pathophysiology is that axonal degeneration and progressive loss of nerve fibers are paramount
(3). These axonal changes are identified by reduced motor and sensory action potential amplitudes, with normal or slightly reduced conduction velocities secondary to loss of the largest and fastest conducting axons (4). However, diverse pathophysiologies may be factors in DSP. For example, some studies have demonstrated slowing of nerve conduction velocity out of proportion to axonal loss in DSP when compared with nerve conduction velocity in strictly axonal disorders, such as idiopathic axonal polyneuropathy or motor neuron disease (5). Moreover, diabetic patients also may present with NCS demonstrating definitive evidence of demyelination (with or without accompanying axonal loss), and these
c c c c c c c c c c c c c c c c c c c c c c c c c c c c c c c c c c c c c c c c c c c c c c c c c
From the 1Department of Medicine, Division of Neurology, University Health Network, University of Toronto, Toronto, Canada; and the 2Department of Medicine, Division of Endocrinology and Metabolism, Mount Sinai Hospital, University of Toronto, Toronto, Canada. Corresponding author: Vera Bril,
[email protected]. Received 28 March 2013 and accepted 5 June 2013. DOI: 10.2337/dc13-0746 © 2013 by the American Diabetes Association. Readers may use this article as long as the work is properly cited, the use is educational and not for profit, and the work is not altered. See http://creativecommons.org/ licenses/by-nc-nd/3.0/ for details.
3684
DIABETES CARE, VOLUME 36, NOVEMBER 2013
patients usually are considered to have a superimposed immune-mediated polyneuropathy, such as chronic inflammatory demyelinating polyneuropathy (CIDP) (6). CIDP is important to distinguish from DSP, because it may be amenable to treatment with immunomodulatory therapies, including intravenous immunoglobulin, corticosteroids, and plasma exchange, even in the presence of underlying DSP (6,7). Given the potential for diabetic patients to have a spectrum of pathophysiologiesd from a classical axonopathy, to evidence of minor or mild demyelinating findings, to evidence of a primary demyelinating disease as seen in CIDPdit is important to distinguish between them because differentiation may lead to effective targeted therapies. Therefore, we sought to examine the spectrum of electrophysiological abnormalities in diabetic patients through examination of our cohort of type 1 and 2 diabetic patients. In this cohort, we aimed to classify subjects according to axonal and conduction slowing patterns of electrophysiological abnormality, to determine the frequency of these classifications, and to compare their clinical characteristics. RESEARCH DESIGN AND METHODS Subjects One hundred seventy-three diabetic subjects (62 with type 1 diabetes and 111 with type 2 diabetes) were recruited between November 2008 and December 2012 as part of an ongoing longitudinal cohort study funded by the Juvenile Diabetes Research Foundation (operating grant 17–2008–715) and a cross-sectional cohort study funded by the Canadian Diabetes Association (operating grant OG-3–10–3123BP). All subjects were 18 years of age or older and had a confirmed diagnosis of type 1 or type 2 diabetes as well as DSP according to the following criteria: at least one abnormal sural NCS result, one abnormal peroneal NCS result, and at least one neuropathic sign or one symptom (1,2). As part of the initial cohort study, each participant underwent comprehensive medical and neurologic evaluations for the assessment of neuropathy-related symptoms and comorbidities, physical examination, and biochemical testing (hemoglobin A 1c care.diabetesjournals.org
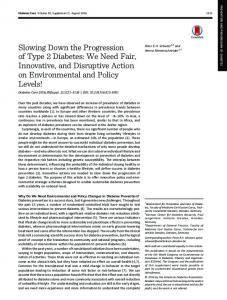
Dunnigan and Associates [HbA1c]). None of these subjects had a diagnosis of immune-mediated polyneuropathy or CIDP based on the clinical and electrodiagnostic criteria of the Neuropathy Association (8) and Magda et al. (9) as evaluated by a neuromuscular expert (V.B.). Our current study involved the extraction of demographic data, clinical history, physical examination, laboratory test results, and electrophysiological data from the research database. The Research Ethics Board of the University Health Network approved the current study protocol. Subjects were evaluated for DSP by neurological examination, the 19-point Toronto Clinical Neuropathy Score (10), vibration perception thresholds (VPT), and sural and peroneal NCS. NCS were performed using the Sierra Wave Electromyography Instrument (Cadwell Laboratories, Kennewick, WA). Age-adjusted and height-adjusted NCS reference values were used according to the standards of the Toronto General Hospital (University Health Network) electrophysiology laboratory. Limb temperature was measured before NCS and, if required, warming was performed to ensure a surface temperature of $32.08C for the hands and $31.08C for the feet. Unilateral sural and peroneal NCS were performed using surface stimulating and recording techniques according to the standards of the Canadian Society of Clinical Neurophysiology and the American Association of Neuromuscular and Electrodiagnostic Medicine (11,12). The electromyography instrument calculated latencies, amplitudes, and conduction velocities automatically. Peroneal nerve motor amplitudes were measured as baseline to peak for the compound muscle action potential (CMAP) at the ankle and the knee, and as baseline to negative peak for the sural sensory nerve action potential amplitude, or from the positive peak (if present) to the negative peak. The sural nerve latency was measured at the onset of the initial deflection from baseline. The F-wave latency was determined as the minimum reproducible latency obtained after 10 supramaximal stimuli were applied. Defining criteria for detection of conduction slowing in DSP patients Patients were categorized as having axonal or conduction slowing DSP based on a combination of latency, conduction velocity, and amplitude parameters, as demonstrated in Fig. 1. Although four groups can be identified using the different combinations, the first and third groups were care.diabetesjournals.org
combined because only one patient qualified for the third group and both were defined as axonal neuropathy. Based on our observations in routine clinical practice, we defined patients as having evidence of conduction slowing (group D) if amplitudes were preserved and at least two parameters showed slowed conduction as suggested by the European Federation of Neurological Societies criteria for CIDP (6). Specifically, preservation of the peroneal CMAP amplitude or the sural sensory nerve action potential amplitude to $90% of the lower limit of normal was required for the group D classification. In addition, group D classification required at least two of the following changes: prolonged F-wave latencies or distal motor or sensory latencies $110% of the upper limit of normal, or motor and sensory nerve conduction velocities #90% of the lower limit of normal. If no abnormalities or one demyelinating abnormality was noted, then the patient was classified as axonal (group A), regardless of the degree of abnormality in the motor and sensory amplitudes. If two or more demyelinating features were present but the sural sensory nerve action potential and peroneal CMAP responses were both reduced to ,90% of lower limit of normal, then the patient was classified as having combined DSP (group C). Statistical analysis Statistical analysis was performed using JMP (version 9.0.2 for Macintosh; SAS). Demographic data were expressed as means 6 SD for normally distributed data or as median and interquartile range
for data not normally distributed. Differences in categorical variables were assessed using the x2 test, whereas differences in continuous variables were assessed using the ANOVA or the Kruskal-Wallis test for nonparametric data. Correlation between peroneal CMAP amplitude and conduction velocity was investigated using linear regression methods. P , 0.05 was considered significant. RESULTSdThe demographic data of the 173 type 1 and type 2 diabetic subjects recruited to the study are shown in Table 1. DSP was categorized as axonal (group A) in 79 (46%), conduction slowing (group D) in 56 (32%), and combined (group C) in 38 (22%) subjects. The mean age of all subjects was 59.1 6 13.6 years and mean HbA1c was 8.0 6 1.8% (64 6 19.7 mmol/mol). Subjects in group C were more likely to have type 2 diabetes (P = 0.01), were older (P , 0.0001), and had a longer duration of polyneuropathy (P = 0.002), but they had a similar duration of diabetes (P = 0.54) and BMI (P = 0.19) compared with group A and group D subjects. Group C subjects had higher systolic blood pressure (P = 0.0001) and higher VPT (P = 0.0003; P = 0.0006; P , 0.0001) than both group A and group D subjects. Subjects did not differ in terms of diastolic blood pressure (P = 0.21), retinopathy (P = 0.56), nephropathy (P = 0.24), and hypertension (P = 0.29). The broad distribution of the Toronto Clinical Neuropathy Score and NCS parameters shown in Table 1 indicates that DSP subjects with a wide spectrum of
Figure 1dSchematic of four groups used to categorize patients as having axonal, conduction slowing, or combined DSP based on a combination of NCS amplitude and latency and conduction velocity parameters. Axonal injury is measured by amplitude, and demyelinating injury is measured by latency and conduction velocity. Demyelinating features are as follows: peroneal F-wave latency $61.6 ms, peroneal distal latency $6.7 ms, peroneal conduction velocity #37.5 m/s, sural distal latency $3.7 ms, and sural conduction velocity #36.0 m/s. SNAP, sensory nerve action potential. DIABETES CARE, VOLUME 36, NOVEMBER 2013
3685
Conduction slowing in DSP Table 1dClinical characteristics and NCS of 62 type 1 and 111 type 2 diabetic subjects according to study criteria for axonal, conduction slowing, or combined neuropathy Type 1 and type 2 diabetes (n = 173)
n Age (years)* Male, n (%) BMI (kg/m2) Type 2 DM, n (%) Duration of DM (years) Duration of PNP (years) Systolic blood pressure (mmHg) Diastolic blood pressure (mmHg) VPT, upper right VPT, upper left VPT, lower right VPT, lower left TCNS, median (IQR) DTR, median (IQR)† Retinopathy, n (%) Nephropathy, n (%) Hypertension, n (%) HbA1c, % (mmol/mol)‡ Nerve conduction parameters Sural nerve amplitude potential (mV) Sural nerve distal latency (ms) Sural nerve conduction velocity (m/s) Peroneal nerve amplitude potential, ankle (mV) Peroneal nerve amplitude potential, knee (mV) Peroneal nerve distal latency (ms) Peroneal nerve conduction velocity, fibular head (m/s) Peroneal nerve conduction velocity, popliteal fossa (m/s) Peroneal nerve F-wave (ms) Conduction block (%)
Axonal
Conduction slowing
Combined
ANOVA P for trend
79 58.2 6 11.9 51 (65) 28.7 6 5.9 51 (65) 21.2 6 12.4 7.7 6 4.0 130.5 6 14.6 73.6 6 7.1 5.1 6 2.0 5.2 6 2.1 17.5 6 9.2 17.5 6 8.9 9 (7–11) 2 (1.5–6) 16 (20) 15 (19) 39 (49) 7.7 6 1.4 (61.0 6 15.3)
56 55.0 6 16.0 37 (67) 28.9 6 5.6 29 (52) 24.0 6 15.6 7.6 6 5.6 140.3 6 18.0 76.4 6 9.9 6.3 6 4.1 6.3 6 4.1 25.3 6 13.1 24.7 6 12.4 11 (7–14) 4 (2–6) 14 (25) 8 (15) 27 (48) 8.9 6 2.3 (74.0 6 25.1)
38 66.8 6 9.3 26 (70) 31.1 6 6.5 31 (82) 22.3 6 16.0 13.0 6 6.8 150.5 6 20.2 77.0 6 8.6 7.7 6 3.0 7.5 6 2.6 33.4 6 11.9 33.9 6 11.6 12 (11–15.5) 6 (4–6) 11 (29) 11 (29) 24 (63) 7.5 6 1.3 (58.0 6 14.2)
,0.0001 0.82 0.19 0.01 0.54 0.002 0.0001 0.2 0.0003 0.0006 ,0.0001 ,0.0001 ,0.0001 0.0005 0.56 0.24 0.29 0.003
4.11 6 2.1 (0–11.1)x 3.34 6 0.3 (2.6–3.8) 41.9 6 3.5 (36.4–51.9) 3.53 6 1.5 (0.2–7.8)
2.29 6 1.8 (0–6.6) 3.72 6 0.4 (3.0–4.6) 37.9 6 3.6 (30.4–46.7) 2.15 6 1.5 (0–7.3)
0.32 6 0.6 (0–1.8) 3.69 6 0.2 (3.4–3.9) 38.0 6 1.7 (35.9–41.2) 0.28 6 0.3 (0–0.8)
,0.0001 ,0.0001 ,0.0001 ,0.0001
3.24 6 1.8 (0.2–13.1)
1.84 6 1.3 (0–5.4)
0.23 6 0.3 (0–0.8)
,0.0001
4.59 6 0.6 (3.4–6.2) 39.9 6 2.7 (29.5–48.3)
5.22 6 1.0 (3.9–9.8) 35.2 6 3.4 (24.4–42.9)
6.18 6 1.4 (4.1–9.3) 31.8 6 4.9 (22.0–39.2)
,0.0001 ,0.0001
41.6 6 3.0 (32.1–47.5)
37.0 6 3.4 (27.0–44.0)
34.7 6 4.9 (22.3–41.2)
,0.0001
55.3 6 5.5 (28.2–65.5) 7.90 6 31.6
62.5 6 4.9 (53.8–76.0) 14.0 6 13.9
NR (NR–NR) 18.8 6 24.6
,0.0001 0.14
Data are means 6 SD unless otherwise indicated. Differences in categorical variables were assessed in three group comparisons using the x2 test, whereas differences in continuous variables were assessed using the ANOVA, except in the case of TCNS, in which the Kruskal-Wallis test was applied. DM, diabetes; DTR, deep tendon reflexes of the lower limb; IQR, interquartile range; NR, nonrecordable; PNP, polyneuropathy; TCNS, Toronto Clinical Neuropathy Score. *The mean age for the 173 type 1 and type 2 diabetic subjects was 59.1 6 13.6 years. †TCNS is a clinical indicator of the severity of neuropathy, with 0–4, 5–8, and $9 indicating no, mild, and moderate to severe neuropathy, respectively. Values ,5 are normal. For the DTR segment of the TCNS, the normal value is 0. ‡The mean HbA1c, indicating the percentage of HbA1c, for 108 of the 173 type 1 and type 2 diabetic subjects was 8.0 6 1.8% (64.0 6 19.7 mmol/mol). xBelow the NCS mean parameter values; the range for that parameter is shown in parentheses.
nerve fiber injury were included in the study. The severity of DSP increased from group A to group D to group C as shown by an increasing overall Toronto Clinical Neuropathy Score (P , 0.0001). Increasing severity across these groups also was demonstrated in all NCS parameters with progressive loss of nerve amplitudes and slowing of conduction velocities (P , 0.0001 for all comparisons). Peroneal F-wave latencies and peroneal distal latencies were longest for group C subjects, the next longest were for group D subjects, and 3686
the shortest were found for group A subjects (P , 0.0001). No difference in conduction block was seen among study groups. Despite 32% of subjects reporting subjective weakness (24% in group A, 36% in group D, and 42% in group C), none of the subjects had proximal weakness or significant distal weakness during clinical examination. Although a positive linear correlation between peroneal CMAP amplitude and conduction velocity was found among group D and group C (P = 0.03 and P = 0.009, respectively), the relationship
DIABETES CARE, VOLUME 36, NOVEMBER 2013
for group D was weaker (r2 = 0.09) than that for group C (r2 = 0.3). Group A did not demonstrate this finding (P = 0.15). The mean HbA1c values did not follow the pattern of worsening from group A to group D to group C, but they were significantly higher in the group D subjects (8.9 6 2.3% [74 6 25.1 mmol/mol]) than in group A and group C subjects (7.7 6 1.4% [61 6 15.3 mmol/mol] and 7.5 6 1.3% [58 6 14.2 mmol/mol]; P = 0.003). When the analyses were repeated for the type 1 and type 2 diabetic subjects care.diabetesjournals.org
Dunnigan and Associates separately, similar findings were demonstrated, except that the differences in HbA1c values were found only in type 1 diabetic subjects (Table 2), with no difference across categories in type 2 diabetic subjects (Table 3), and the duration of diabetes became a factor and was longer in group C. CONCLUSIONSdWe examined a cohort of type 1 and type 2 diabetic patients with a broad spectrum of DSP to detect evidence of conduction slowing in DSP. By investigating the electrodiagnostic
features of nerve injury in these patients, we observed that subjects could be classified into different pathophysiological types of axonal, conduction slowing, or combined DSP with different clinical characteristics. Further, our study defined different electrophysiological characteristics in type 1 and type 2 diabetic patients, supporting the hypothesis that pathophysiological differences may exist. The hallmarks of nerve injury in DSP are considered to be axonal degeneration and loss of nerve fibers (3,4). Previous groups have demonstrated a linear
relationship between reduction in CMAP amplitude and decrease in motor conduction velocity in axonal DSP (5,13,14). Demyelinating change is not expected in DSP; however, our study identified a group with evidence of conduction slowing in NCS. Although slowing of conduction is not synonymous with demyelination, it may be that these patients have mild demyelination or other factors such as loss of ion channels that might produce similar findings. Although conduction slowing greater than expected in most axonal neuropathies can
Table 2dClinical characteristics and NCS of 62 type 1 diabetic subjects according to study criteria for axonal, conduction slowing, or combined neuropathy Type 1 diabetes (n = 62) Axonal n Age (years)* Male, n (%) BMI (kg/m2) Duration of DM (years) Duration of PNP (years) Systolic blood pressure (mmHg) Diastolic blood pressure (mmHg) VPT, upper right VPT, upper left VPT, lower right VPT, lower left TCNS, median (IQR) DTR, median (IQR)† Retinopathy, n (%) Nephropathy, n (%) Hypertension, n (%) HbA1c, % (mmol/mol)‡ Nerve conduction parameters Sural nerve amplitude potential (mV) Sural nerve distal latency (ms) Sural nerve conduction velocity (m/s) Peroneal nerve amplitude potential, ankle (mV) Peroneal nerve amplitude potential, knee (mV) Peroneal nerve distal latency (ms) Peroneal nerve conduction velocity, fibular head (m/s) Peroneal nerve conduction velocity, popliteal fossa (m/s) Peroneal nerve F-wave (ms) Conduction block (%)
ANOVA P for trend
Conduction slowing
Combined
28 51.5 6 11.2 14 (50%) 26.8 6 4.9 32.0 6 11.2 9.3 6 3.5 129.4 6 15.2 72.2 6 6.8 4.9 6 2.0 5.1 6 2.1 16.0 6 8.7 16.4 6 8.9 8 (4.25–10) 3 (0.5–5.5) 9 (32) 5 (18) 10 (36) 7.5 6 1.1 (58.0 6 12)
27 48.0 6 17.2 13 (48%) 26.6 6 5.6 33.1 6 14.8 9.9 6 5.5 140.0 6 18.5 75.9 6 9.6 6.6 6 5.3 6.6 6 5.2 21.5 6 11.1 20.8 6 12.9 11 (6–15) 4 (2–6) 10 (37) 3 (11) 10 (37) 9.6 6 2.4 (81.0 6 26.2)
7 57.9 6 6.5 3 (43%) 30.9 6 4.6 46.6 6 12.4 18.7 6 5.0 148.1 6 19.0 71.1 6 6.6 9.3 6 4.4 8.6 6 3.4 33.6 6 12.4 35.3 6 11.9 14 (11–18) 4 (4–8) 6 (86) 5 (71) 6 (86) 8.4 6 1.3 (68.0 6 14.2)
4.15 6 2.1 (0–8.7)x 3.35 6 0.2 (2.9–3.8) 41.7 6 2.7 (36.8–48.3) 3.68 6 1.5 (0.2–6.0)
2.43 6 2.0 (0–6.6) 3.68 6 0.3 (3.1–4.3) 38.2 6 3.1 (32.6–45.2) 1.96 6 1.4 (0–5.1)
0.76 6 0.8 (0–1.8) 3.75 6 0.1 (3.6–3.8) 37.3 6 1.1 (36.8–38.9) 0.37 6 0.4 (0–0.8)
0.0001 ,0.0001 0.0002 ,0.0001
3.16 6 1.5 (0.2–5.7)
1.66 6 1.3 (0–4.9)
0.31 6 0.5 (0–0.8)
,0.0001
4.71 6 0.7 (3.6–6.2) 39.6 6 3.6 (29.5–48.3)
5.45 6 1.2 (4.1–9.8) 34.8 6 4.3 (24.4–42.9)
6.50 6 1.2 (5.6–8.3) 31.0 6 4.0 (24.8–34.1)
0.0008 ,0.0001
41.3 6 3.2 (32.1–47.5)
35.0 6 3.9 (27.0–44.0)
35.0 6 3.2 (30–38.1)
,0.0001
54.5 6 3.8 (48.5–61.1) 14.1 6 17.7
62.7 6 7.4 (53.8 –76.0) 17.7 6 14.0
NR (NR–NR) 15.0 6 14.9
0.24 0.94 0.19 0.03 0.003 0.02 0.19 0.04 0.086 0.0006 0.0002 0.003 0.15 0.03 0.006 0.039 0.004
0.0006 0.72
Data are means 6 SD unless otherwise indicated. Differences in categorical variables were assessed in three group comparisons using the x2 test, whereas differences in continuous variables were assessed using the ANOVA, except in the case of TCNS, in which the Kruskal-Wallis test was applied. DM, diabetes; DTR, deep tendon reflexes of the lower limb; IQR, interquartile range; NR, nonrecordable; PNP, polyneuropathy; TCNS, Toronto Clinical Neuropathy Score. *The mean age for the 62 type 1 diabetic subjects was 50.7 6 14.0 years. †TCNS is a clinical indicator of the severity of neuropathy, with 0–4, 5–8, and $9 indicating no, mild, and moderate to severe neuropathy, respectively. Values ,5 are normal. For the DTR segment of the TCNS, the normal value is 0. ‡The mean HbA1c, indicating the percentage of HbA1c, for the 62 type 1 diabetic subjects was 8.4 6 2.0% (68.0 6 21.9 mmol/mol). xBelow the NCS mean parameter values; the range for that parameter is shown in parentheses.
care.diabetesjournals.org
DIABETES CARE, VOLUME 36, NOVEMBER 2013
3687
Conduction slowing in DSP Table 3dClinical characteristics and NCS of 111 type 2 diabetic subjects according to study criteria for axonal, conduction slowing, or combined neuropathy Type 2 diabetes (n = 111)
n Age (years)* Male, n (%) BMI (kg/m2) Duration of DM (years) Duration of PNP (years) Systolic blood pressure (mmHg) Diastolic blood pressure (mmHg) VPT, upper right VPT, upper left VPT, lower right VPT, lower left TCNS, median (IQR) DTR, median (IQR)† Retinopathy, n (%) Nephropathy, n (%) Hypertension, n (%) HbA1c, % (mmol/mol)‡ Nerve conduction parameters Sural nerve amplitude potential (mV) Sural nerve distal latency (ms) Sural nerve conduction velocity (m/s) Peroneal nerve amplitude potential, ankle (mV) Peroneal nerve amplitude potential, knee (mV) Peroneal nerve distal latency (ms) Peroneal nerve conduction velocity, fibular head (m/s) Peroneal nerve conduction velocity, popliteal fossa (m/s) Peroneal nerve F-wave (ms) Conduction block (%)
Axonal
Conduction slowing
Combined
ANOVA P for trend
51 61.9 6 10.7 37 (73) 30.6 6 6.1 14.9 6 7.9 7.1 6 4.1 132.2 6 13.8 75.8 6 7.2 5.2 6 2.1 5.3 6 2.1 18.4 6 9.4 18.2 6 9.0 9 (7–11.5) 2 (1.5–6) 7 (15) 10 (21) 29 (69) 7.9 6 1.6 (63.0 6 17.5)
29 61.5 6 11.8 24 (86) 31.5 6 4.4 15.2 6 10.6 5.4 6 4.8 140.8 6 17.7 77.1 6 10.5 5.9 6 2.5 6.0 6 2.5 29.1 6 14.0 28.5 6 13.0 11 (8–14) 4 (2–6) 4 (14) 5 (18) 17 (71) 8.1 6 2.0 (65.0 6 21.9)
31 68.9 6 8.7 23 (77) 31.2 6 7.0 16.4 6 10.3 10.6 6 6.0 151.6 6 21.4 79.9 6 8.1 7.3 6 2.5 7.3 6 2.3 33.4 6 12.0 33.5 6 11.7 12 (10.8–15) 6 (3.5–6) 5 (19) 6 (23) 18 (75) 7.2 6 1.1 (55.0 6 31.6)
0.007 0.39 0.86 0.78 0.03 0.02 0.43 0.002 0.001 ,0.0001 ,0.0001 0.003 0.004 0.89 0.89 0.87 0.18
4.08 6 2.1 (0–11.1)x 3.33 6 0.3 (2.6–3.8) 42.0 6 3.9 (36.4–51.9) 3.45 6 1.5 (0.2–7.8)
2.18 6 1.6 (0–5.0) 3.75 6 0.4 (3.0–4.6) 37.6 6 4.0 (30.4–46.7) 2.32 6 1.6 (0–7.3)
0.22 6 0.6 (0–1.8) 3.63 6 0.2 (3.4–3.9) 33.7 6 2.2 (35.9–41.2) 0.26 6 0.3 (0–0.8)
,0.0001 ,0.0001 0.0001 ,0.0001
3.29 6 1.9 (0.2–13.1)
2.0 6 1.3 (0–5.4)
0.2 6 0.2 (0–0.7)
,0.0001
4.52 6 0.5 (3.4–6.0) 40.0 6 2.1 (35.5–45.2)
5.01 6 0.7 (3.9–6.2) 35.5 6 2.5 (29.8–39.0)
6.11 6 1.5 (4.1–9.3) 32.0 6 5.1 (22.0–39.2)
,0.0001 ,0.0001
41.8 6 2.8 (36.4–47.2)
37.2 6 2.7 (30.8–40.9)
34.7 6 5.3 (22.3–41.2)
,0.0001
55.8 6 6.2 (28.2–65.5) 4.5 6 36.8
62.4 6 3.7 (56.3–70.0) 10.7 6 13.3
NR (NR–NR) 19.8 6 26.7
0.0004 0.15
Data are means 6 SD unless otherwise indicated. Differences in categorical variables were assessed in three group comparisons using the x2 test, whereas differences in continuous variables were assessed using the ANOVA, except in the case of TCNS, in which the Kruskal-Wallis test was applied. DM, diabetes; DTR, deep tendon reflexes of the lower limb; IQR, interquartile range; NR, nonrecordable; PNP, polyneuropathy; TCNS, Toronto Clinical Neuropathy Score. *The mean age for the 111 type 2 diabetic subjects was 63.7 6 10.9 years. †TCNS is a clinical indicator of the severity of neuropathy, with 0–4, 5–8, and $9 indicating no, mild, and moderate to severe neuropathy, respectively. Values ,5 are normal. For the DTR segment of the TCNS, the normal value is 0. ‡The mean HbA1c, indicating the percentage of HbA1c, for the 111 type 2 diabetic subjects was 7.7 6 1.6% (61.0 6 17.5 mmol/mol). xBelow the NCS mean parameter values; the range for that parameter is shown in parentheses.
be present at diagnosis of type 1 diabetes (15), the patients in this study had diabetes for a mean duration of 33 years. This is an indication that slowing of conduction plays some role in the disease manifestations even in advanced stages of diabetes. Slowing of conduction velocity independent of the CMAP amplitude also has been described in DSP in contrast to subjects with amyotrophic lateral sclerosis, a clear axonal process (5,13,14). The results of the current study confirm that in 3688
DSP, conduction velocity slowing cannot be explained by axon loss alone in a larger study population (173 patients compared with 27–57), but they help to define the clinical characteristics that may signal evidence of mild demyelination and the different patterns of nerve injury in type 1 and type 2 diabetes. A fundamentally important result in the current study is the demonstration that metabolic factors determine different pathophysiologic behaviors; for example,
DIABETES CARE, VOLUME 36, NOVEMBER 2013
evidence of conduction slowing is associated with worse glycemic control in patients with type 1 diabetes. This observation may allow the opportunity for effective intervention in this group of patients to avoid progression to the more severe stages of DSP. In our study, the observed spectrum of electrophysiological changes appears to reflect progression of the disorder, because the combined axonal and conduction slowing group had the most severe neuropathy based on the clinical care.diabetesjournals.org
Dunnigan and Associates score and electrodiagnostic parameters, consistent with the longer duration of polyneuropathy and older age in this group of patients. Some authorities have argued that the only way to distinguish the pathophysiology accurately in patients with DSP is with specific serum biomarkers (7); however, no biomarkers are currently available for use in clinical practice. For this reason, a careful reexamination of the electrophysiological behavior patterns in DSP may allow a better understanding of the different stages of DSP. The current study has several limitations. First, the patients with DSP were not compared with a group of patients with definite demyelinating polyneuropathy such as immune-mediated inflammatory neuropathy, as performed by Tankisi et al. (14). Despite the lack of an inflammatory neuropathy group for comparison, different patterns of axonal and conduction slowing are identifiable, as indicated by our results. Future work comparing different patient populations may lead to a better understanding of the underlying pathophysiology of DSP. Nonetheless, 32% of DSP patients might be characterized as having evidence of possible mild demyelination. In this group with conduction slowing, the patients did not have proximal weakness on clinical examination; therefore, it is unlikely that a diagnosis of CIDP was overlooked. It is possible that some of these patients may develop CIDP in the future. The lack of conduction block in these patients supports a concept of diffuse nerve injury along the length of the nerve fibers caused by metabolic impairments and leading to conduction slowing changes. This observation contrasts with the conduction block commonly observed in CIDP, in which nerve injury is multifocal. Another limitation of the study is the lack of confirmatory pathological documentation of demyelination causing conduction slowing, as might be observed in nerve biopsy specimens. However, sural nerve biopsy would be required, and this invasive procedure would not be well tolerated by most patients; furthermore, it is not considered essential for the accurate diagnosis of CIDP. Of course, slowing of conduction velocity might be attributable to loss of ion channels in the internodal region or other factors without true demyelination. Finally, we did not use the rigorous American Academy of Neurology criteria for the presence of demyelination in chronic inflammatory neuropathies (16). Those criteria are highly specific but lack care.diabetesjournals.org
sensitivity (17), so many other criteria have been developed to help diagnose CIDP (18). Instead, we used those limits for NCS parameters that trigger our suspicion for possible demyelinating neuropathy in the clinic and applied these criteria a priori to our DSP population; therefore, the results of this study are independent of cut point selection bias. Despite that the conduction slowing DSP group is separate from patients with CIDP, the mechanism of nerve fiber injury may have similarities. This hypothesis is in keeping with prevailing views that type 1 diabetes is an immune-mediated disorder (19), so disordered immune activity may be operative in both CIDP and conduction slowing DSP. The discovery in this analysis of a substantial subset of subjects with evidence of an electrophysiological pattern of isolated conduction slowing, seen more prominently and in association with worse glycemic control in those with type 1 diabetes, suggests that evidence of mild demyelination may result from higher glycemic exposure or may result from exaggerated autoimmunity to b-cells and nerves alike. In contrast, a similar relationship is not found in type 2 diabetic patients, suggesting that the pathophysiology differs in this form of diabetes. This also may be one explanation for the differences in neuropathy outcomes in long-term studies of patients with type 1 diabetes and type 2 diabetes and DSP (20–24). The presence of poor glycemic control in type 1 diabetic patients with evidence of conduction slowing indicates that this stage in the evolution of DSP may be amenable to treatment, in contrast to axonal and combined pathologies, which may be more resistant to therapy. This observation offers a window of opportunity to improve DSP via improved glycemic control in patients with type 1 diabetes.
AcknowledgmentsdThe work in this report was funded by grants from the Toronto General Hospital / Toronto Western Hospital Foundation. No potential conflicts of interest relevant to this article were reported. S.K.D. researched and performed statistical analysis of the data, prepared the first draft of the manuscript, and prepared the final manuscript. H.E. contributed to the study design. A.B. contributed to the study design and methods. H.D.K. contributed to the discussion. L.E.L. provided technical advice regarding data collection and analysis. B.A.P. contributed to the study design and discussion. V.B. created the hypothesis and objective and
designed the study. All authors reviewed the manuscript for scholarly content and accuracy. V.B. is the guarantor of this work and, as such, had full access to all the data in the study and takes responsibility for the integrity of the data and the accuracy of the data analysis.
References 1. Dyck PJ, Albers JW, Andersen H, et al.; on behalf of the Toronto Expert Panel on Diabetic Neuropathy. Diabetic polyneuropathies: update on research definition, diagnostic criteria and estimation of severity. Diabetes Metab Res Rev 2011; 27:620–628 2. England JD, Gronseth GS, Franklin G, et al.; American Academy of Neurology; American Association of Electrodiagnostic Medicine; American Academy of Physical Medicine and Rehabilitation. Distal symmetric polyneuropathy: a definition for clinical research: report of the American Academy of Neurology, the American Association of Electrodiagnostic Medicine, and the American Academy of Physical Medicine and Rehabilitation. Neurology 2005;64: 199–207 3. Dyck PJ, Lais A, Karnes JL, O’Brien PC, Rizza R. Fiber loss is primary and multifocal in sural nerves in diabetic polyneuropathy. Ann Neurol 1986;19:425–439 4. Behse F, Buchthal F, Carlsen F. Nerve biopsy and conduction studies in diabetic neuropathy. J Neurol Neurosurg Psychiatry 1977;40:1072–1082 5. Herrmann DN, Ferguson ML, Logigian EL. Conduction slowing in diabetic distal polyneuropathy. Muscle Nerve 2002;26: 232–237 6. Van den Bergh PYK, Hadden RDM, Bouche P, et al.; European Federation of Neurological Societies; Peripheral Nerve Society. European Federation of Neurological Societies/Peripheral Nerve Society guideline on management of chronic inflammatory demyelinating polyradiculoneuropathy: report of a joint task force of the European Federation of Neurological Societies and the Peripheral Nerve Society–first revision. Eur J Neurol 2010; 17:356–363 7. Latov N. Biomarkers of CIDP in patients with diabetes or CMT1. J Peripher Nerv Syst 2011;16(Suppl. 1):14–17 8. Berger AR, Bradley WG, Brannagan TH, et al.; Neuropathy Association, Medical Advisory Committee. Guidelines for the diagnosis and treatment of chronic inflammatory demyelinating polyneuropathy. J Peripher Nerv Syst 2003;8:282–284 9. Magda P, Latov N, Brannagan TH 3rd, Weimer LH, Chin RL, Sander HW. Comparison of electrodiagnostic abnormalities and criteria in a cohort of patients with chronic inflammatory demyelinating polyneuropathy. Arch Neurol 2003;60:1755– 1759
DIABETES CARE, VOLUME 36, NOVEMBER 2013
3689
Conduction slowing in DSP 10. Bril V, Perkins BA. Validation of the Toronto Clinical Scoring System for diabetic polyneuropathy. Diabetes Care 2002;25:2048– 2052 11. Bolton CF, Benstead TJ, Grand’Maison F, Tardif GS, Weston LE. Minimum standards for electromyography in Canada: a statement of the Canadian Society of Clinical Neurophysiologists. Can J Neurol Sci 2000; 27:288–291 12. American Association of Electrodiagnostic Medicine. Guidelines in electrodiagnostic medicine. Recommended policy for electrodiagnostic medicine. Muscle Nerve 1999; (Suppl. 8):S91–S105 13. Wilson JR, Stittsworth JD Jr, Kadir A, Fisher MA. Conduction velocity versus amplitude analysis: evidence for demyelination in diabetic neuropathy. Muscle Nerve 1998;21:1228–1230 14. Tankisi H, Pugdahl K, Johnsen B, FuglsangFrederiksen A. Correlations of nerve conduction measures in axonal and demyelinating polyneuropathies. Clin Neurophysiol 2007;118:2383–2392 15. Young RJ, Ewing DJ, Clarke BF. Nerve function and metabolic control in teenage diabetics. Diabetes 1983;32:142–147
3690
16. Research criteria for diagnosis of chronic inflammatory demyelinating polyneuropathy (CIDP). Report from an Ad Hoc Subcommittee of the American Academy of Neurology AIDS Task Force. Neurology 1991;41:617–618 17. Sander HW, Latov N. Research criteria for defining patients with CIDP. Neurology 2003;60(Suppl. 3):S8–S15 18. Koski CL, Baumgarten M, Magder LS, et al. Derivation and validation of diagnostic criteria for chronic inflammatory demyelinating polyneuropathy. J Neurol Sci 2009;277:1–8 19. Skog O, Korsgren S, Melhus A, Korsgren O. Revisiting the notion of type 1 diabetes being a T-cell-mediated autoimmune disease. Curr Opin Endocrinol Diabetes Obes 2013;20:118–123 20. The Diabetes Control and Complications Trial Research Group. The effect of intensive treatment of diabetes on the development and progression of long-term complications in insulin-dependent diabetes mellitus. N Engl J Med 1993;329: 977–986 21. Albers JW, Herman WH, Pop-Busui R, et al.; Diabetes Control and Complications
DIABETES CARE, VOLUME 36, NOVEMBER 2013
Trial/Epidemiology of Diabetes Interventions and Complications Research Group. Effect of prior intensive insulin treatment during the Diabetes Control and Complications Trial (DCCT) on peripheral neuropathy in type 1 diabetes during the Epidemiology of Diabetes Interventions and Complications (EDIC) Study. Diabetes Care 2010;33:1090– 1096 22. UK Prospective Diabetes Study (UKPDS) Group. Intensive blood-glucose control with sulphonylureas or insulin compared with conventional treatment and risk of complications in patients with type 2 diabetes (UKPDS 33). Lancet 1998;352: 837–853 23. Holman RR, Paul SK, Bethel MA, Matthews DR, Neil HAW. 10-year followup of intensive glucose control in type 2 diabetes. N Engl J Med 2008;359:1577– 1589 24. Shichiri M, Kishikawa H, Ohkubo Y, Wake N. Long-term results of the Kumamoto Study on optimal diabetes control in type 2 diabetic patients. Diabetes Care 2000;23(Suppl. 2):B21– B29
care.diabetesjournals.org