J. Dijkstra. W.A.H. Roelen. H.J.P. Timmermans. Eindhoven University of Technology. Faculty of Architecture, Building and Planning. Eindhoven. The Netherlands.
Conjoint measurement in virtual environments: a framework J. Dijkstra W.A.H. Roelen H.J.P. Timmermans Eindhoven University of Technology Faculty of Architecture, Building and Planning Eindhoven The Netherlands
ABSTRACT Conjoint analysis (also called stated preference analysis) involves the use of designed hypothetical choice situations to measure individuals’ preferences and predict their choice in new situations. Conjoint experiments involve the design and analysis of hypothetical decision tasks. Alternatives are described by their main features, called attributes. Multiple hypothetical alternatives (product profiles) are generated and presented to respondents, who are requested to express their degree of preference for these profiles. Conjoint experiments have become a popular tool to model individual preferences and decision-making in a variety of research areas. Most studies of conjoint analysis have involved a verbal description of product profiles, although some studies have used a pictorial presentation of product profiles. This paper describes a framework for a conjoint analysis system in a virtual environment. Product profiles are generated in a virtual environment and respondents are requested to choose in that virtual environment the product profile they prefer. Advantages of a virtual environment in this area of research include 3D presentation, improved experience and the possibility to include measurable attributes such as time and sound. This framework is a first attempt to explore the possibilities of virtual reality systems in conjoint analysis.
1 INTRODUCTION Conjoint analysis is a generic term coined by Green and Srinivasan (1978) to refer to a number of paradigms in psychology, economics and marketing that are concerned with the quantitative description of consumer preferences or value trade-offs (Louviere, 1995). Conjoint analysis sometimes referred to as stated preference modelling involves the use of hypothetical choice situations generated according to the principles underlying the design of statistical experiments to measure individuals’ preferences, examine consumer choice behaviour and/or predict their choice in new situations (Oppewal, 1995). In a conjoint study, a researcher (i) select the attributes (characteristics) that are assumed to influence the choice behaviour of interest, (ii) classifies these attributes into numerical or categorical levels, and (iii) combines these attribute levels into profiles according to some statistical design. Thus, implicitly it is assumed that choice alternatives can be viewed as a bundle of attributes. Respondents are assumed to trade-off the attributes of interest according to some algebraic rule to arrive at an overall preference. In order to estimate this preference function, these
profiles are presented to respondents who are requested to express their overall preference. These profiles are typically represented verbally. While a verbal description might be a valid means of describing profiles in many contexts, one could argue that some attributes are better represented visually. This paper takes this argument one step further and explores the possibilities of developing a virtual reality based system of conjoint analysis. Such a system is of particular interest when respondents have to experience the context of choice and/or the attributes describing the choice alternatives. This paper is organised as follows. First, we will discuss some basic principles of conjoint analysis. Then, in section 3, we will discuss the potential of virtual reality systems for conjoint measurement. This is followed by a discussion of a framework that we developed to link virtual reality systems to conjoint analysis. This is illustrated in a simple example of wayfinding. Finally we point at some future avenues of research.
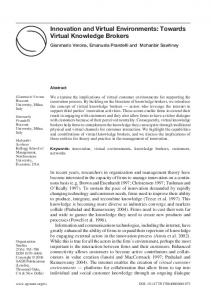
2 BASIC CONCEPTS OF CONJOINT ANALYSIS Conjoint analysis involves the measurement of consumer preferences or choices. It implies the study of the joint effects of multiple product attributes on product choice. The researched products (or services or new conditions) are described in terms of product profiles. Each profile is a combination of attribute levels for the selected attributes. Figure 1: Relationship among a profile, attributes and levels
Conjoint analysis has two objectives: 1. to determine the contributions of predictor variables (levels) and their respective values (utilities or part-worths) to consumer preferences, and 2. to establish a valid model of consumer judgements useful in predicting the consumer acceptance of any combination of attributes (Hair et al, 1995).
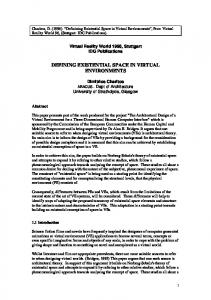
In order to achieve these objectives, ‘profile utilities’ are developed to quantitatively measure preferences in consumer decisions. In this manner, the profile utility is an overall utility of a profile according to some statistical model. Figure 2: Preference measurement in conjoint analysis
In a conjoint experiment, first the key dimensions (attributes) of products or services are defined. Next, the specific levels of each attribute are specified. The chosen attributes and their levels should be realistic and relevant to the problem. Also, the ultimate definition of attributes and their levels will be influenced by the possibilities of constructing a suitable experimental design. That is, the design should satisfy the necessary and sufficient conditions, required to estimate the assumed preference or choice model that describes the way in which individuals are assumed to arrive at some choice or overall preference. Conjoint analysis focuses on the measurement of the part-worth utilities that individual decision-makers associate with attribute scores of choice alternatives. Traditionally, in axiomatic conjoint measurement, the focus was on testing the structure of preference functions, i.e., whether preference functions are additive, multiplicative or combined additive-multiplicative. More recently, preference functions are estimated from experimental design data using an appropriate multivariate statistical technique. Conjoint experiments thus require individuals to express their preference for various experimentally designed, hypothetical alternatives. These hypothetical alternatives are descriptions of potential real-world alternatives in terms of their most relevant attributes. Two or more fixed levels are defined for each attribute and these are combined to create different profiles. For example, hypothetical shopping centres can be described in terms of number of stores, distance from home, and parking conveniences, as shown in Figure 3. (Timmermans et al. 1984)
Figure 3: Profile of a hypothetical shopping centre, as used by Timmermans et al. (1984). The right-hand column displays other possible levels to define alternative profiles. Number of shops: Travel time: Parking search time:
small 15 minutes 4 minutes
[medium; large] [30; 45] [12; 20]
Respondents are invited to express their preference for the experimentally varied profiles by rating or ranking these in terms of overall preferences. Alternatively, respondents may be asked to choose the profile they like best. For example, in the study by Timmermans et al, respondents had to rank nine profiles. Preference functions were estimated from this data. Obviously, the number of possible combinations increases immensely with increasing numbers of attributes and levels. For example, six attributes each with three levels produce 36 = 729 possible combinations, which is known as a full factorial profile experimental design. The evaluation of all these possible combinations is an unmanageable task. Fortunately, the data collection can be greatly reduced by using fractional factorial design techniques (Montgomery, 1991). In analysis-of-variance terms, this often means that only main effects are estimated. In the current example with six three-level attributes the use of a fractional factorial design reduces the 729 possible profiles to only 18 profiles. Therefore, an experimental design is defined by an optimal subset of profiles of a fractional factorial design, which can be presented to a respondent without negatively influencing responses in terms of boredom or fatigue. The above discussion, strictly speaking, relates to a preference model. A respondent’s preferences are decomposed into part-worth utilities, which represent the contribution to the respondent’s overall preference or utility of the attribute levels that were used to generate the profiles. If one wishes to construct a choice model, the attribute profiles have to be placed into choice sets. Subjects are then to asked to choose one alternative from each choice set or, alternatively, to allocate some fixed budget among the choice alternatives (Oppewal and Timmermans, 1991).
3 CONJOINT ANALYSIS AND VIRTUAL REALITY Most studies of conjoint analysis involve verbal descriptions of product profiles. In recent years, some studies have been conducted with a pictorial presentation of product profiles. Vriens (1995) investigated whether conjoint results depend on the mode of representation, when both pictorial and verbal representations are feasible. Conceptual differences between the two modes are distinguished. These conceptual differences concern:
◊ ◊ ◊
the possibility to include design, styling or aesthetic aspects as an integral part of hypothetical products; the type of information processing induced by the respective modes. Pictures tend to be processed simultaneously in an imagery system, whereas verbal representations are processed sequentially in an independent verbal system; the degree of task realism. Pictorial representations contribute to the degree of task realism of the evaluation task.
Klabbers et al (1996) propose a multimedia engine for stated choice and preference experiments. This engine enables researchers to use varying presentation formats (textual, pictorial, auditory presentations and combinations), thereby measuring the influence of presentation format. Pictorial presentation of attributes can lead to more reliable and valid measurements of respondent utilities for the presented product or services. To get a better insight into consumer behaviour it is desirable to improve the realism of the hypothetical situation to ensure that the respondent is making a ’real’ decision, VR (Virtual Reality)-techniques may be of interest for these high involvement discussion. The importance of VR is obvious in new product research, as a new marketing tool and as bringing realism in consumer interaction. In the next section a framework will be described to combine conjoint analysis and virtual reality systems. However virtual reality systems may also have a lot to offer in an architecture and urban planning context when the ‘visual and active’ environment may have a dramatic impact on individual preferences and choice behaviour.
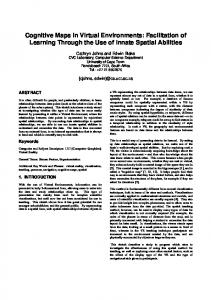
4 FRAMEWORK: CONJOINT ANALYSIS & VIRTUAL REALITY SYSTEM 4.1 CA&VR system components The components of the CA&VR as shown in Figure 4 will be explained briefly. VR-DIS This is the ‘Virtual Reality - Distributed Interactive Simulations’ environment wherein the CA&VR system is situated. VR-DIS can be used in various decision support processes (in the building industry). Virtual Environment ◊ Respondent The person that indicates his/her preference by choosing among selected profile alternatives.
Figure 4: Schema CA&VR system components
◊
Profile Environment System Virtual walk-through of selected profile alternatives by the respondent.
Profile Simulation System ◊ Profile selector Random selection of profile alternatives in choice set of profiles. ◊ Profile Database Consists of profiles-set, both the profile set-up (product profile) and the profile presentation (virtual design). ◊ Profile measurement database Contains the measurements of the interaction respondent Profile Environment System. Profile Generation System ◊ Profile builder Generates the profile set-up and representation. ◊ Virtual Environment modeler Generates the profile-environment (static). ◊ Objects modeler Generates the profile-objects (dynamic). ◊ Profile designer Generate the profile-design which is the basis of the selection-set of profiles. ◊ Attributes and levels Profile attributes and attribute levels, necessary for the profile-design. Decision System ◊ Data Analyser Analysis of the performances of the measurements. 4.2 Explanation New ideas, recent developments in the building information technology and the need of a innovative and state-of-the art research media have resulted in a draft of a VRplatform: VR-DIS (Smeltzer, Dijkstra et al, 1994; Smeltzer, Mantelers et al, 1994; Brouwer et al,1995).VR means a mock-up of the reality in relation to perception and cognitive processes. In the CA&VR concept virtual reality depicts profiles in a threedimensional environment and allows respondents to interact with profiles. A profile consists of a virtual environment model and dynamic objects model representing the attributes with their levels. Both the virtual environment model and objects model can be designed by 3-D graphical and virtual reality-development software. Distributed systems are media for multi-use and multi-site collaborative interaction. In the
CA&VR concept, the ‘virtual environment’-component would be tuned to a multiuser application, where several networked respondents interact over an internet. At a central site, profiles would be generated and measurements analysed. Interactive systems assumes a high level of intuitive interactivity with the system. In the CA&VR concept, the interface ‘respondent - profile environment’ deserves particular attention. With respect to simulation systems we refer to those systems which provide an imitative representation of the behaviour or characteristics of a system or process in question. In the CA&VR concept the generated profile alternatives will be subject of the examination in a conjoint experiment by means of the simulating device which is called ‘profile simulation system’. 4.3 Research strategy The ultimate objective of this research project is to investigate and develop possibilities of a VR-DIS system in those cases where choice behaviour and decisionmaking processes of consumers may be of importance. We would get answers to the question whether VR-DIS can be used in the research area of conjoint analysis. To that end, a framework of a CA&VR system set-up has been developed. First, we will show the possibility of the interaction of a respondent with a profile alternative which would bring the respondent in a ‘state of mind’ that resembles the actual decision making more closely. This is especially the case when (architectural) design characteristics are involved. The conjoint experiment of the next section represents a first, simple try-out. In the subsequent stages, we will examine in depth the ‘profile generation system’, the ‘profile simulation system’ and the ‘decision system’. With respect to the ‘decision system’ we will investigate whether the analysis of the conjoint data should be part of a CA&VR system or the presented data should be analysed with conjoint analysis software. As far as the ‘distribution’ aspect is concerned, we will develop a communication layer to enable multi-user and multi-site usage. Also, we will pay attention to the reliability and validity of the proposed concept.
5 A SIMPLE ILLUSTRATION: WAYFINDING 5.1 Wayfinding Wayfinding is one of the terms used in psychology and other disciplines to describe the manner in which humans navigate in spatial environments (Devlin and Bernstein, 1995). Wayfinding can be described as all perceptual, cognitive, and decision-making processes necessary to find one’s way, that is as a mental and physical act of reaching destinations (Arthur and Passini, 1992).
Wayfinding is an important issue. Building causing wayfinding difficulties are certainly not considered a design success and sometimes have to be redesigned. The wayfinding quality of complex buildings also affects security in emergency evacuation. The observation that people during evacuation tend to use routes and exits they know already (Sime, 1985) indicates the importance of spatially understanding a setting. Many people avoid settings in which they got lost. People tend to feel disoriented when they cannot situate themselves within a spatial representation and when, at the same time, they don’t have, or can’t develop a plan to reach their destination. Most settings are laid out in a plan people can relate to and which allows them to determine their location within the setting, determine that their destination is within the setting, and form a plan of action that will take them from their location to their destination. The representation people have of their surrounding environment is the psychological concept that underlies the notion of spatial orientation. This is called a cognitive map, that is an overall mental image of the spaces and the layout of a setting. Theoretically, wayfinding has often been placed within the framework of cognitive mapping, the mental structuring process leading to the creation of a cognitive map (Golledge et al, 1985; Kitchin, 1994). One way to get a better understanding of the various aspects of wayfinding is to think of it in terms of the ‘human-machine system’. A human is considered as a system in which receptor (sense-)processes, mental (information-processing, deciding) processes and effector (acting-)processes play a significant part during his different activities. In any case, the decision to find one’s way can only be made by receiving adequate information through perception and cognition. In this context, two aspects can be identified, namely the aspect of ‘content of information’ (decision making) and the aspect of ‘form of information’ (perception and cognition). These aspects of information can also be found in Passini (Passini, 1984). Wayfinding was the term introduced to describe the process of reaching a destination and is best defined as spatial problem solving, comprising of three specific but interrelated processes (Athur and Passini, 1992): ◊ Decision making, the development of a plan of action. ◊ Decision execution, which transforms the plan of action into appropriate behavior at the right place in space. ◊ Information processing understood in its generic sense as comprising environmental perception and cognition, which, in turn, are responsable for the information basis of two decision-related processes. Besides the spatial problem solving process aspect, there is also the design aspect of wayfinding. The design part provides information, identified by three aspects: ◊ content of information ◊ location of information
◊ form of information Content and location of information are related to decision making and decision execution. The form of information comprises environmental perception and cognition and is related to information processing. In the design part of wayfinding the emphasis is on the graphic components. In wayfinding, it doesn’t matter whether information is obtained by graphic, architectural, or other means as long as it is legible and readable. 6.2 Experimental design The idea that all wayfinding difficulties can be solved by putting up signs has to be vigorously denounced. Wayfinding is part, and an important part, of architectural design (Arthur and Passini, 1992). Still, graphic communication may at least partially compensate for possible flaws in architectural design. Therefore, we will focus on this aspect which often is of crucial importance in facility management. Thus, in the experimental design, only the design part of wayfinding, especially the graphic communication as part of the environmental communication will be considered. Graphic communication includes signs, maps, directories etc. and good sign-posting. In graphic communication, functional information type will be emphasized. That is, functional information type is considered in relation to those things that people need in information settings: ◊ information about the settings, the way it is organized (information to make decisions) ◊ information directing them to their location (information to execute decisions) ◊ information identifying the destination on their arrival (information to conclude the decision-making/executing process) These types of information comprise attributes in the conjoint analysis system. Each of these attributes has two levels. Together, the number of attributes and their associated levels comprise the design specifications. Design specifications Attribute ◊ Orientation
Level 1. Floor plan 2. Directory
◊
Directional signage 1. Text beside arrow sign
Description Concerns a person’s ability to perceive an overview of a given environment, where they are, and where the destination is. Guides people along a designated route to a destination
2. Text inside arrow form ◊
Identification
1. Sign with name 2. Another sign with same name
Information provided at the destination
The experiment will also measure the walking-time from the entrance.
6 DISCUSSION In this paper we have put forward a framework for conjoint measurement in a virtual reality environment. This system will be developed because we feel that virtual reality systems allow one to have respondents experience the choice environment and attribute levels and improve the reliability and validity of conjoint measurements. It is the kind of experience that is difficult or perhaps even impossible to capture when using verbal or multi-media representation formats. It should be emphasised that our example of wayfinding is a very simple one. To appreciate the potential contribution of the virtual reality system, we let respondents experience two possible guidance alternatives and ask them to express the one they prefer. Obviously, this is the simplest application that also stays closest to the traditional use of conjoint choice and preference models. However, we could also think of an experimental task in which respondents are invited to find a destination. We could measure whether they found the target destination and if so, how long they took to reach the destination. Such an application likely better incorporates the idiosyncrasies of virtual reality systems, but does not satisfy the typical assumptions underlying conjoint choice models. First, conventional conjoint choice models are traditionally based on preference or choice data, not on duration data. Secondly, if the actual routes as opposed to “find/didn’t find” in the dependent variable, the analysis becomes increasingly more difficult and new appropriate methodology needs to be developed. Although these tasks may not be easy, we feel that the potential of virtual reality systems for such decision tasks is worth the challenge. We hope to report on our experience and progress in the near future.
7 REFERENCES Arthur, P. and R. Passini (1992) Wayfinding, People, Signs and Architecture. McGraw-Hill Ryerson, Toronto. Brouwer, A.H.A.; W.A.Roelen and J.A.G Jess (1995) A proposal for a distributed virtual reality system for architectural simulations, BIT Notes 1995/1, Eindhoven University of Technology.
Devlin, A.S. and J. Bernstein (1995) Interactive wayfinding: use of cues by men and woman, Journal of Environmental Psychology, 15, pp. 23-38 Golledge, R.G., T.R. Smith, J.W. Pellegrino, S.E. Doherty and S.P. Marshall (1985) A conceptual model and empirical analysis of children’s acquisition of spatial knowledge, Journal of Environmental Psychology, 5, pp. 125-152. Green, P.E. and Srinivasan, V. (1978) Conjoint analysis in consumer research: issues and outlook, Journal of Consumer Research, 5, pp. 103-123 Hair, J.F., R.E. Anderson, R.L. Tatham and W.C. Black (1995) Conjoint analysis. in Multivariate Data Analysis, Prentice Hall, Englewood Cliffs NJ, pp. 556599. Kitchin, R.M. (1994) Cognitive maps: what are they and why study them?, Journal of Environmental Psychology, 14, pp. 1-19. Klabbers, M.D., H. Oppewal and H.J.P. Timmermans (1996) ESCAPE: (Multimedia) engine for stated choice and preference experiments, working paper DDSS 1996. Louviere, Jordan J. (1995) Conjoint analysis, in R.P. Bagozzi (ed.), Advanced Methods of Marketing Research, Oxford, Blackwell, pp. 223-259. Montgomery, D.C. (1991) Design and Analysis of Experiments, Wiley, Chichester. Oppewal, H. (1995) Conjoint Experiments and Retail Planning; Modelling Consumer Choice of Shopping Centre and Retailer Reactive Behaviour, PH.D thesis, Bouwstenen 32, Eindhoven University of Technology. Oppewal, H. and H.J.P. Timmermans (1991) Context effects and decompositional choice modeling, Papers in Regional Science, 70, pp. 113-131. Passini, R. (1984) Wayfinding in Architecture, Van Nostrand Reinhold, New York. Sime, J. (1985) Movement towards the familiar: person and place affiliation in a fire entrapment setting, Environment and Behavior, 17, pp. 692-724. Smeltzer, G.T.A., J. Dijkstra and R. Van Zutphen (1994) Future studies in construction - Information technology in the building industry, BIT Notes 1994/2, Eindhoven University of Technology. Smeltzer, G.T.A., J.M.M. Mantelers and W.A.Roelen (1994) The application of virtual reality systems in architectural design processes, BIT Notes 1994/3,
Eindhoven University of Technology. Timmermans, H.J.P, R.E.C.M. Van der Heijden and H. Westerveld (1984) Decisionmaking between multiattribute choice alternatives: a model of spatial shopping behaviour using conjoint measurements, Environment and Planning A, 16, pp. 377-387. Vriens, M. (1995) Conjoint Analysis in Marketing - Developments in Stimulus Representation and Segmentation Methods, PH.D thesis, SOM, RU Groningen.