Nlllson's pipefish. Anchovy. Carp. Great pipefish. Horse mackerel. Thick-lipped grey mullet. Lumpsucker. Dragonet. Tub gumard. Silver bream. Tadpole fish.
l
Vol. 32: 217-228, 1986
MARINE ECOLOGY - PROGRESS SERIES Mar. Ecol. Prog. Ser.
Published September 18
Consistency of seasonal changes in an estuarine fish assemblage ' School of Environmental and Life Sciences, Murdoch University, Murdoch, Western Australia 6150
* NERC Institute for Marine Environmental Research. Prospect Place, The Hoe, Plymouth PL1 3DH, United Kingdom
ABSTRACT: Data on the abundance of all fish species collected at weekly intervals from the intake screens of the Oldbury-upon-Severn Power Station in the inner Severn Estuary, U. K., between 1972 and 1977, have been analysed using classification and multi-dimensional scaling (MDS) ordination techniques. The results show that in each year the structure of the fish con~munityin the shallows of the estuary underwent simdar cycllcal changes. These changes were largely attributable to a sequential immigration and emigration of different species, particularly estuarine-dependent marine species, a n d were not driven directly by vanations in water temperature, sahnity or freshwater discharge from the river. However, comparisons between the data for years with the driest and wettest winters show that the pattern of change in fauna1 composit~onwas modified under extreme environmental conditions.
INTRODUCTION Many marine species of teleosts use estuaries as nursery areas, thereby benefiting from such features as the presence of a greater productivity, a reduced incidence of piscivorous predators and a lower sahnity than in their natal environment (Cronin & Mansueti 1971, Beal 1980, Whitfield 1983, Claridge & Potter 1984). Although the juveniles of some of these species also frequently exploit protected inshore marine environments, this important group of marine fish has often been referred to as estuarine-dependent (Clark et al. 1969, McHugh 1976, B e d 1980, Fortier & Leggett 1982, Claridge et al. 1986). Estuaries are also u t h z e d by catadromous and anadromous species (including lampreys) as a migratory route between feeding and spawning areas, and their upper reaches are sometimes colonized by the more salt-tolerant freshwater fish (McHugh 1967, Abou-Seedo & Potter 1979, Day et al. 1981, Dando 1984). In addition, a few teleosts have become adapted to spending the whole of their life cycle in estuarine environments. The abundance of individual species and the composition, abundance and diversity of the total fish fauna undergo seasonal changes in estuaries in many parts of the world (Dahlberg & Odum 1970, McErlean et al. 1973, Haedrich & Haedrich 1974, Gallaway & Strawn 1975, Lvingston 1976, Hoff & Ibara 1977, van den Broek 1979, Quinn O Inter-Research/Printed in F. R. Germany
1980, MacDonald et al. 1984). While these changes have frequently been related to salinity and/or temperature, Blaber & Blaber (1980) consider that these variables probably do not affect the distribution of the juveniles of estuarine-dependent species. Detailed information on the biology of the common fish species and the abundance, composition and diversity of the fish assemblage has been obtained for the Severn Estuary over a 5 yr period using samples collected at regular intervals from the intake screens of local power stations (e.g. Claridge & Gardner 1977, 1978, Titmus et al. 1978, Claridge & Potter 1983, 1984, 1985, Claridge et al. 1985, 1986, Potter & Claridge 1985). While these studies showed that consistent seasonal changes took place each year in the numbers of the common species and the fish community as a whole, the changes which these both underwent in the inner Severn Estuary during the winter were more pronounced in the year when sahnities fell to a n unusually low level (Claridge & Potter 1984, Claridge et al. 1986). The current study has re-examined the extensive data set for the fish fauna of the inner Severn Estuary in an attempt to determine whether seasonal changes in species abundance, composition and diversity are related to changes in environmental variables, or whether they are primarily the result of 'endogenous' seasonal migrations of larvae, postlarvae a n d juve-
218
Mar. Ecol. Prog. Ser
niles. Attempts to answer this question have utihzed the results of classification and ordination of monthly data for the whole 5 yr study period and of weekly data for the years with the driest and wettest winters.
MATERIALS AND METHODS Fish entrained over 24 h periods on the cooling water intake screens of the Oldbury-upon-Severn Power Station were collected in most weeks between July 1972 and J u n e 1977. This method yielded more species than that collated by Lloyd (1941) from different sources, as well as a large total number of individuals whose standard lengths ranged from 17 mm to well in excess of 1000 mm (Clandge et al. 1986). This indicates that there is no marked bias in this sampling method. The numbers of each fish species in each sample were adjusted when necessary to correspond to a daily intake of 2.2 X 10'1, the volume of water which typically passed through the screen each day during the autumn and winter, when fish abundance was greatest (see also Claridge & Potter 1983, 1984, Claridge e t al. 1986). Note that since 2 morphologically very similar gobies Pomatoschistus minutus and Pomatoschistus lozanoi, were separated only during a 13 mo period, they have subsequently been considered a s collectively comprising the Pomatoschistus minutus complex (Clandge et al. 1985). Fish species were separated into the following categories: catadromous (C), i.e. migrating from fresh water into the sea to breed; anadromous (A), i.e. migrating from the sea Into fresh water to breed; estuarine (E), i.e. typically occurring and breeding in estuaries; freshwater (F), i.e. typically occurring and breeding in fresh water; marine estuarine dependent (MED),i.e. marine species which enter the estuary in large numbers; marine straggler (MS),i.e. marine species abundant in marine environments but only infrequently found in estuaries. The data given in this paper for time of spawning and peak abundance and the standard length at the time of peak abundance were compiled from information provided in our previous papers on the Severn Estuary listed in the references. Salinity was recorded at the time of sampling, while water temperature represents the mean of the intake values recorded by power station authonties during the week before sampling. The mean freshwater discharge rate of the b v e r Severn in the week before the collection of each sample was obtained from values recorded at Gloucester by the Severn-Trent Water Authority. Comprehensive details of the classification and multi-dimensional scaling (MDS) ordination techniques employed in this paper and the rationale for their
use are given in Field et al. (1982). The numbers of each species (including rare species) were transformed using a double square root transformation (, ,X) so that the small number of numerically dominant specles do not totally dominate the measure of similarity between 2 times. Mean monthly values for species abundance were used for examining seasonal trends over the whole 5 yr period (Fig. 1 to 3), while comparisons between the July to June periods incorporating the driest (1975/76) and wettest winters (1976/77) used the numbers for the individual weekly samples (Fig. 5 to 6). A similarity matrix, comparing each sample with every other sample, was constructed for both the 5 and 2 yr abundance data using the Bray-Curtis measure of similarity (Bray & Curtis 1957). This matrix was both classified using group average s o f i n g (Lance & Williams 1967) to produce a dendrogram, and employed for the MDS ordination technique (MDSCAL 5-MS Program; Kruskal 1977). Salinity and temperature were superimposed on the corresponding monthly and weekly points in the MDS arrays (Fig. 2b, c & 5c, d). The data set for the 5 yr period was also subjected to a n inverse analysis (which clusters species rather than samples) to ascertain whether certain species tended to group together (Fig. 3). It should be noted that since scaling and orientation of MDS plots are purely arbitrary, the axes in Fig. 2 and 5 are unlabelled. What is significant is the relative distance of samples from each other, a s this reflects the relative dissimilarities in species composition and abundance. The only information used by the MDS algorithm is the rank-ordered similarity matrix, i.e. the information that Sample 1 is more similar to Sample 2 than it is to Sample 3, for all such comparisons. Diversity indices were calculated for the once weekly data for the dry (1975/76) and wet years (1976/ 77) using data transformed to log,. Species richness (D) was o b t l n e d using the formula of Margalef (1968), while the Shannon-Wiener (H') and Evenness (J)indices were determined according to Pielou (1966).
RESULTS Data for 1972-1977 The mean monthly temperatures, salinities and freshwater dscharge rates for the 1972-1977 penod are given in Claridge & Potter (1984). Since there was a high correlation coefficient for the linear relation between the mean monthly values for salinity and freshwater discharge for this period (r = -0.954), any trends shown by salinity after superimposition on the MDS arrays will closely reflect the converse situation
Potter et al.: Seasonal changes in an estuarine fish assemblage
for freshwater discharge. However, it is important to recognize that, while high freshwater discharge may cause downstream displacement of some species in the river, its contribution to water movement in the inner estuary at Oldbury is far less than that due to tidal action (Claridge & Potter 1984). The ranking by abundance of all 78 species and specifically of the 15 most numerous species collected from Oldbury over the 5 yr study period emphasizes the vast contribution made by the estuarine-dependent marine species to the fish community of the inner Severn Estuary (Tables 1 & 2). Thus, if as seems possible, Pomatoschistus lozanoi as well as P. minutus, which together constitute the P. m i n u t u s complex, are eventually shown to belong to this category (Claridge et al. 1985), the estuarine-dependent species would have accounted for 91.5 OO/ of the total fish numbers of 146 828 recorded between July 1972 and June 1977. Ten estuarine-dependent marine teleosts (including the P. m i n u t u s complex) ranked amongst the top 15 species, together with the estuarine common goby, the anadromous twaite shad and river lamprey, the catadromous European eel and the three-spined stickleback, the last of which is regarded by Wheeler (1969) as typically a freshwater species in the southern part of its distribution in the United Kingdom (Table 2). The representatives of the estuarine-dependent marine species collected from Oldbury consisted very largely of O+ fish which entered the shallows at vari-
219
able sizes and times (Tables 1 & 2). The time taken for the juveniles of these species to pass from the spawning grounds in the Br~stolChannel to the shallows of the inner estuary was variable, ranging from 14 to 18 wk in the bass to 38 to 42 wk in the sea snail (Claridge et al. 1986). While the twaite shad was also represented by 0+ fish, these were the products of spawning in the upper part of the inner estuary of the lower reaches of the river (Clardige & Gardner 1978). The river lamprey was represented by sexually maturing adults which were migrating from the sea to their spawning grounds in the shallower regions of the river and its tributaries (Abou-Seedo & Potter 1979). Both the yellow and silver forms of the European eel were caught at Oldbury, the latter presumably embarlung on their migration to marine breeding areas. The common goby was the only one of the 15 most abundant species believed to be truly estuarine (Claridge et al. 1985). Although a number of freshwater species were obtained from Oldbury, by far the most abundant of these was the three-spined stickleback. The view that the results from Oldbury are representative of the inner estuary is supported by the observation that the species composition of the samples from this power station are similar to those collected from Berkeley a further 5 km upstream, even though the intake at the latter is located in deeper water (Clandge et al. 1986). The classification dendrogram for the monthly data
Table 1. A list of the 78 species (including 1 species complex and 1 hybrid) and their hfe cycle category collected from Oldbury between Jul 1972 and Jun 1977. Total numbers have been corrected to correspond to four 24 h samples each month at an intake of 2.2 X l o g 1. Scientific nomenclature follows Wheeler (1978, pers. cornm.). A: anadromous; C = catadromous; E: estuarine; F: freshwater; MS: marine straggler; MED: marine estuarine dependent (see 'Materials and Methods' for fuller description of these life cycle categories)
1. 2. 3. 4. 5. 6. 7.
8. 9. 10. 11. 12. 13. 14. 15. 16. 17. 18. 19. 20.
Species
Common name
Pomatoschistus minutus complex Merlangius merlangus Platichthys flesus Dicentrarchus labrax Liparis liparis Trisopterus minutus L z a ramada Alosa faflax Anguifla a n g d l a Clupea harengus Sprattus sprattus Gasterosteus aculeatus Lampetra fluviaMS Trisopterus luscus Pomatoschistus microps Ciliata septen tnonalis Solea solea Salmo salar Pollachius pollachius Trisopterus esmarku
Sand goby Whiting Flounder Bass Sea snail Poor cod Thin-lipped grey mullet Twaite shad Eel Herring Sprat Three-spined stickleback River lamprey Bib Common goby Northern rockling Sole Salmon Pollack Norway pout
Number
Life cycle category
42 859 41471 14480 10779 9900 4 228 3 895 3 879 3 687 2 869 1801 1268 956 911 744 381 374 267 257 242
MED MED MED MED MED MED MED A C MED MED F+ E? A MED E MED MED A MED MS
0
Mar Ecol. Prog. Ser. 32: 217-228, 1986
Table l (continued) Common name
Number
Me cycle category
MuUus surmuletus Crystallogobius linearis Atherina boyeri Cdiata m ustela Perca flu via kijs Pleuronectes platessa Gadus morhua Rutilus ruWus Salmo trutta Merluccius merluccius Conger conger Buenia jeffreysii Limanda hmanda Abramis brarna Petrom yzon marin us Ammodytes tobianus Scom ber scombrus Gaidropsarus vulgaris Zeugopterus punctatus Gobius paganeLlus Scophthalmus rhombus Syngnathus rostellatus Engraulis encrasicholus Cyprinus carpi0 Syngnathus acus Trachurus trachurus Crenimugjl labrosus Cyclopterus lumpus Calhonymus lyra Trigla lucerna Abramis bjoerkna Raniceps raninus Apiua minuta Sardina pdchardus Rutilus erythrophthalmus Crenilabrus melops Eutrigla gurnadus Lophius piscatonus Carassius carassius Leuciscus leuciscus Micromesistius poutassou Agonus cataphractus Pungihus pungitius Scophthalmus maximus RuWus ruWus X Abram~sbrama La brus bergylta Centrola brus exolet us Aspitrigla cuculus Spina chia spinachia Scyljorh~nus caniculus Gob10 gobio Carass~usauratus Leuciscus cephalus Entelurus aequoreus Molva molva Gobius niger Trigloporus lastoviza Arnoglossus laterna
Red mullet Crystal goby Sand smelt Five-bearded rockling Perch Plaice Cod Roach Trout Hake Conger eel Jeffreys' goby Dab Bronze bream Sea lamprey Sand eel Mackerel Three-bearded rockling Topknot Rock goby B nll Nlllson's pipefish Anchovy Carp Great pipefish Horse mackerel Thick-lipped grey mullet Lumpsucker Dragonet Tub gumard Silver bream Tadpole fish Transparent goby Pllchard Rudd Corkwing Grey gurnard Angler fish Crucian carp Dace Blue whiting Armed bullhead Ten-splned stickleback Turbot Roach and bronze bream Ballan wrasse Rock cook Red gurnard Fifteen-spined stickleback Lesser spotted dogfish Gudgeon Goldfish Chub Snake pipefish Ling Black goby Streaked gurnard Scaldf~sh
MS MS E+M MED F MS MS F A MS MS MS MS F A MS MS MS MS MS MS MED MS F MS MS MS MS MS MS F MS MS MS F MS MS MS F F MS MS F MS F MS MS MS MS MS F F F MS MS E MS MS
Potter et al.: Seasonal changes in an estuanne fish assemblage
221
Table 2. Aspects of the biology of the 15 most abundant species collected from Oldbury between Jul 1972 and J u n 1977. A: anadromous; C: catadromous; E: estuarine; F: freshwater; MS: marine straggler; MED: marine estuarine dependent. Data on the 2 species in the Pomatoschistus mjnutus complex is based only on the penod between J u n 1974 and Jul 1975 (see Claridge et al. 1985) Species
Sand goby complex Poma toschistus minutus Pomatoschistus lozanoi Whiting Flounder Bass Sea snail Poor cod Thin-lipped grey mullet Twaite shad European eel Hernng Sprat Three-spined stickleback k v e r lamprey Bib Comnlon goby
Time of peak spawning
Time of peak abundance
Modal standard length class at peak abundance (mm)
Life cycle category
Mar-May Apr-Jun A P ~ Mar & Apr May Jan-Mar Mar-May May & J u n May & J u n
Jan Jan S e p m i d Nov Lat Jun-Aug S ~ P Dec-mid J a n S e p m i d Oct Late S e p e a r l y Dec Aug & Sep Nov Aug & Sep Late Jul-early Sep Dec-Mar Oct-Jan S e p m i d Oct Dec-Mar
5&52 3840 85-89 40-44 45-49 65-69 65-69 45-49 35-39 270-350 60-64 40-44 42-46 250-320 70-74 25-39
MED MED? MED MED MED MED MED MED A C MED MED
Mar & Apr Mar & Apr Apr-Jun Mar & Apr Mar-May Jun & Jul
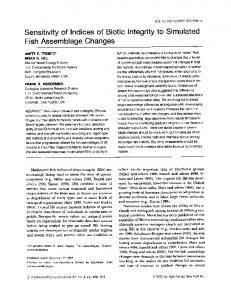
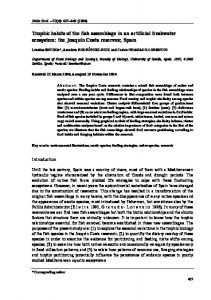
for the whole 5 yr period shows that at a similarity level of just over 50 % of the samples separated into 3 main groups (Fig. 1). These groups correspond to the following 3 periods: July to November, November to March and April to July. No pronounced distinction could be seen, however, between the samples for these 'time' groups on the MDS ordination array (Fig. 2a). Since the stress factor for the MDS array was low (0.129), the ordination results are likely to be a reasonably accurate representation of the relation between samples. Thus, the allocation of samples to groups in the cluster analysis should not b e treated too definitively. It is the experience of K. R. Clarke (pers. comm.) that group average linking will have a tendency to produce clusters on the dendrogram even when the samples form a genuine continuum. The samples for the individual months on the MDS arrays for each of the 5 yr showed a gradual but very pronounced clockwise progression from July to November at the bottom through sequential months to November to March on the top left to April to June on the top right (Fig. 2a). While the November to March samples tended to be characterized by low salinities and temperatures, as would be expected for this time of the year, their positions in the array were more closely correlated with the annual cycle than with either of these 2 parameters (cf. Fig. 2a, b, c). Moreover, although salinity and temperature were similar for the July to November and the Apnl to July periods, they were clearly separated on the array (cf. Fig. 2a, b, c). Although 100 O/O levels of similarity were present between snake pipefish and gudgeon and between
FW A MED
E
scaldfish and goldfish in the classification dendrogram (Fig. 3), this reflects the capture of each species on only one occasion and in the same month as the other member of its pair (Table 1). In general, the species caught at Oldbury showed no marked tendency to separate into well-defined groups, although 4 abundant species of gadoid (whiting, bib, pollack, fivebearded rocfing) did group together at the 55 % level. The same was true of the freshwater species in the case of roach and bronze bream at the 68 O/O level and of dace and carp at the 73 O/O level but none of these last 4 species was ever particularly abundant (Table 1).The fact that 9 of the 11 common teleosts grouped together at the 50 % level reflects the overall dominance of the samples by these species.
Comparisons between 1975176 and 1976177 The temperatures between July 1975 and June 1976 showed similar cyclical trends and similar maximum and minimum values to those recorded in the same months in 1976/77 (Fig. 4a). Thus, the highest respective temperatures in these 2 yr were found in August 1975 (21.7 "C) and July 1976 (22.5 "C), with the lowest temperatures being recorded in February 1976 (3.8 "C) and January 1977 (3.9 ' C ) respectively. While salinity also showed a cyclical pattern in 1975/76 and 1976/77, the minimum values differed markedly (Fig. 4b). Thus, the lowest value of 15.0 %O recorded in January 1976 was much greater than the lows of 3.9 %O in February and of 2.7 %O in early March of the following year. By
Mar. Ecol. Prog. Ser. 32: 217-228, 1986
the respective maximum values of 30.2 and n the 2 yr, which were both recorded in Sepwere very similar. The trends shown by freshscharge bear a close inverse relation with r = -0.971; Fig. 4b, c). For example, in both e discharge reached a maximum in the same at salinity fell tc a minimum. Moreover, the maximum dscharge in 1976/77 than in 19751 nd 130 m3 S-' respectively) helped to account arked difference in the minimum salinihes in and 1976/77. ndrogram produced by classification of the amples for the 'dry' year of 1975/76 distinat the 45 % level of similarity 3 groups which nd to the following periods: July to mid-Sepmid-September to Apnl; May and June. By he dendrogram for the 'wet' year of 1976/77 d 4 groups at the same level, representing nd early September, mid-September to early
Fig. 1. Dendrogram showing classification of the samples of lampreys, elasmobranchs and teleosts collected from Oldbury, based on pooled data for each month between Jul 1972 and Jun 1977
December, mid-December tb March and April to June. July 1976 grouped with the April to June 1977 period. Lines drawn through the points for the sequential weekly samples in the MDS array showd similar trends in 1975/76 and 1976/77 (Fig. 5a, b). However the lines joining the samples between December and March were considerably longer in 1976177 than in the preceding year, indicating a greater change in community composition in this second winter. Superimposition of sahnity values on the points for the weekly samples showed that the December to March period in 1976/77 was characterised by exceptionally low sahnities and also, but to a lesser extent, low temperatures (Fig. 5c, d ; see also Fig. 4b). The cyclical trends shown by the mean dady catch were similar in 1975/76 and 1976/77, with a marked peak occurring in September and October respectively (Fig. 6 ) . While the values in October and November were greater in 1975/76 than in 1976/77, the converse
Potter et al.: Seasonal changes in an estuarine fish assemblage
I
I
fa) Monthly samples
(b) Salinity B
-e .X
,/;D,
,
11
l6
l1
10 12
\ $0
m
1 1 '7 20 1120
I
/
l2
21
_ _ 19 -
--
1521 18 17 25
/
26,
27/
16
,/l9 \
21 22
'
23 24
2s le 15 29
.
.-
h
'.
B,'
'/:02
C
l
/
22 38,'
.
Temperature - -
(C)
I 28 1
.-
X
29 1 8 2 4 ' ,
8 1 '
25
17
\ ,
l8
2421 \ 24 25 1
16
.
4 6
-
\
7 \ /
/
/
10 13
\
' 3 1
)l0 '8
7
,I
8
\ B - -9 7-8
,
'
1 '
'
_10.
10
13
/m
118
A,
7 12
_
X
9 1 0 '
/
:
1 7 9 7 5
I
/
6
l2 8
13
,
1 7 \ 1818
' , .., . _ ,/ c /
/\l3
21
l0
17
\
14
/
l9
2019i11
i
18 l5
l9
13 14
1
/
.. 17
/
17
21
months were generally greater than 3 in 1975/76 but usually below this in 1976/77. The differences between the years with dry and wet winters were reflected by some conspicuous differences in the species composition of the fauna. Thus, 8 freshwater teleosts (carp, crucian carp, sllver and bronze bream, rudd, chub, dace, roach X bronze bream hybrid) collected in 1976/77 were not recorded in the previous year. Conversely, several rare, essentially marine species (lesser spotted dogfish, ling, fifteen-spined stickleback, scaldfish) were obtained in 1975/76 but not in 1976/77.
DISCUSSION
-.
10
/
'
223
/ /
Flg. 2 . MDS ordination of each monthly mean of fish from Oldbury between Jul 1972 and Jun 1977 (a), together with superimposition of the corresponding mean salinities (b) and temperatures (c). Dotted Line around the 3 main groups separated by classification does not correspond to clearly defined clusters following ordmation
was true for the immediately following months. Although the number of species also tended to follow a cyclical pattern, this was much less pronounced than with total abundance (cf. Fig. 6a, b). Species richness (D), the Shannon-Wiener Index (H') and Evenness (J) each showed similar seasonal trends in both years. Differences in these parameters in the December to March periods of the 2 yr only differed in the case of species richness. Thus, values for this index in these
The most s t r i h n g feature of the ordination of the data for samples of fish collected from Oldbury between 1972 and 1977 was the consistency of the clockwise progression of the monthly points in the MDS arrays for each of the 5 successive 12 mo periods. T h s demonstrates that in each year a similar progressive and cyclical change took place in the composition and abundance of the assemblage of fish in the shallows of the inner Severn Estuary. The lack of correspondence between the trends shown by the monthly samples in the MDS arrays a n d those exhibited by temperature and by salinity and therefore freshwater discharge shows that the seasonal changes in faunal structure were not closely related with concomitant changes in these environmental variables. The basis for the sequential seasonal change in the abundance and composition of the fish fauna of the inner Severn Estuary is revealed by examining the times of immigration, residency and emigration of the more abundant species at Oldbury shown in Table 1 (see also Clandge et al. 1986). These data demonstrate that, while the common species were generally present throughout the year, the majority tended to appear at Oldbury at varylng times and often remained in large numbers within this region for only a few weeks. Since this group of species was not usually again numerous the following year! this in a continual change in the relative abundance of the most abundant species, with none of these species becoming dominant in more than one period. The sequential pattern of recruitment of the various species responsible for initiation of the annual change in faunal structure is well d u s t r a t e d by considering the data on time of immigration of juveniles of the 10 estuarine-dependent marine species most frequently caught during the study, all of which ranked amongst the 15 most abundant species overall (Table 2). Thus, the period when these reached peak abundance ranged from late J u n e to August in the flounder
224
Mar Ecol. Prog. Ser. 32: 217-228, 1986
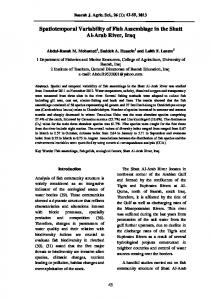
Fig. 3. Dendrogram showing classification of the 78 species of lampreys, elasmobranchs and teleosts collected from Oldbury based on pooled data for each month between Jul 1972 and J u n 1977. Numbers refer to those given for each species in Table 1. List includes a species complex and 1 hybrid
Fig. 4. Weekly values for (a) temperature a n d (b) salinity at Oldbury and for (c) freshwater discharge at Gloucester during the Jul-Jun period of the years with the driest (1975/76) and wettest winters (1976/77)
Potter et al.: Seasonal changes in an estuarine fish assemblage
1976177 (Circled)
(a) 1975/76 (Uncircled)
08
0
00 l
",
8
B
E
s 4
5
,a4
S
9 5
I (C) Salinitv
I
(d) Temperature
0
" 20 19
19
n 20
@
l1
zz 1919
14
11 ISl5
19
@
13
20 13
Fig. 5. MDS ordination of weekly samples for the Jul-Jun period in the years with the driest (1975/76) and wettest winters (1976/7) (a and b), together with superimposition of the corresponding mean salinities (c) and temperatures (d). In (a) number = month of each weekly sample. In (a, c and d), points for samples in the wet year are encircled
225
through September in the bass to December to midJanuary in the sea snail. Since the interspecific variability in the period between spawning and arrival at Oldbury is greater than between peak spawning times (Table 2), this variability can be related to differences in the methods by which these species are transported from their spawning grounds to upstream nursery areas in the estuary. Species such as herring, sprat and bass, which appear early and at a relatively small size, probably use passive and selective tidal transport to enter and pass up the estuary (Fortier & Leggett 1982, Norcross & Shaw 1984, Aprahamian & Ban 1985, Dando & Demir 1985, Claridge et al.1986).By contrast, species such as whiting, which are represented by individuals with a larger modal length at Oldbury, have been described as entering their nursery areas through 'an active migration of juveniles rather than a passive denatant drift of planktonic larvae' (Cooper 1980, 1983). The increases in abundance of the representatives of estuarine-dependent marine species between late summer and early winter was augmented by a marked elevation in abundance of the catadromous twaite shad in August and September and by a less precipitous rise in the catches of anadromous river lamprey between September and November (Table 2, Claridge et al. 1986). The recruitment of estuarine-dependent marine species, and twaite shad and river lamprey, into the inner estuary largely accounts for the rise in fish abundance between late summer and early winter. The sequential replacement of species during this period of high abundance could be of value in reducing the Likelihood of competition for space and even food in the shallows of the inner estuary at this time. A similar conclusion was reached by Weinstein et al. (1980) for a fish community in North Carolina where species also entered the estuary at different times and sizes. The progressive change in the composition of the fish community between late summer and winter is continued in subsequent weeks through the appearance of common goby and freshwater species such as three-spined stickleback. While the advent of the freshwater species occurs at the time when freshwater discharge in the rivers is greatest and salinity in the inner estuary is lowest, the movements of the more common of the estuarine-dependent species of gadoids in the estuary are not closely related to either of these environmental variables or to temperature. The latter conclusion is based on the observation that the changes in weekly numbers of these species was not significantly correlated with changes in these environmental variables (Claridge & Potter 1984). Such a feature also helps explain the lack of correlation between seasonal changes in fauna1 structure and environmen-
226
Mar Ecol. Prog. Ser. 32: 217-228, 1986
Fig. 6. Species number (S),total abundance (N), species richness (D), Shannon-Wienerindex (H') and evenness index (J)for the weekly samples between Jul 1975 and Jun 1977
tal variables. In this context, it is also probably relevant that there was no conspicuous tendency for groups of the more abundant species to cluster together. Despite the conclusion that to a large degree the annual cyclical change in faunal structure reflects differences in the times of recruitment of the more abundant species, there is also good evidence that these changes can b e modified by extremes in environmental variables either in the estuary or in the freshwater regions of tributary rivers. This view is based partly on the observation that, in contrast to the dry winter of 1975/76, classification separated the samples in the wet winter of 1976/?7 into 2 groups, with the separation occurring in December when salinity and,
less conspicuously, temperature fell to an exceptionally low level and then remained depressed for several weeks. Support for this opinion is provided by the far greater separation of weekly samples on the MDS arrays at the same time of the year in 1976/77 than in 1975/76, which implies that a greater change took place in the community in the winter of the wet year. It is also relevant that the points for December 1976 and January and February of 1977 in the MDS array for the whole 5 yr period lay outside those for the same months in other years. Since salinity was more closely correlated with changes in faunal structure than was temperature, it would seem to be a better candidate for causing such changes.
Potter et al.: Seasonal changes in an estuarine fish assemblage
T h e view t h a t salinity c a n affect t h e a b u n d a n c e of fish is s u p p o r t e d b y a comparison b e t w e e n t h e prese n c e of h i g h e r n u m b e r s in October a n d N o v e m b e r of 1976/77 t h a n i n 1975/76, with t h e converse situation b e t w e e n D e c e m b e r a n d M a r c h w h e n salinities i n t h e w i n t e r of 197669 h a d d r o p p e d to far lower levels. T h e effect of low salinities o n t h e f a u n a is also illustrated b y t h e lower s p e c i e s richness i n t h e very l o w salinity winter of 1976/77 a n d b y t h e g r e a t e r n u m b e r s of freshw a t e r s p e c i e s i n t h a t year. In s u m m a r y , t h e m a g n i t u d e a n d cyclical p a t t e r n of c h a n g e i n t h e fish community structure of t h e shallows of t h e i n n e r S e v e r n Estuary w a s similar i n all years. T h e s e cyclical p a t t e r n s are n o t driven directly b y t e m p e r a t u r e , salinity or freshwater d i s c h a r g e b u t a r e a reflection of s e q u e n t i a l immigrations of different species, a n d particularly t h o s e of t h e juveniles of those m a r i n e species w h i c h a r e frequently referred to a s e s t u a r i n e - d e p e n d e n t . T h e composition a n d a b u n d a n c e of t h e fish f a u n a of t h e i n n e r estuary w e r e modified to s o m e d e g r e e , h o w e v e r , by e x t r e m e s i n environmental variables. T h e observation t h a t salinity h a s only a m o d e r a t i n g influence o n t h e a n n u a l p a t t e r n of s e q u e n tial c h a n g e a t O l d b u r y would b e consistent with t h e view t h a t since this locality is i n t h e i n n e r estuary, it would b e e x p e c t e d t o b e characterized by a relatively e u r y h a l i n e f a u n a . Although salinity d o e s not h a v e a p r o n o u n c e d effect on t h e s p e c i e s composition of t h e fish f a u n a a t O l d b u r y i n t h e i n n e r S e v e r n Estuary, s t u d i e s o n o t h e r estuaries h a v e s h o w n t h a t differences i n salinity r e g i m e s t h r o u g h o u t an e s t u a r y c a n influe n c e t h e composition of t h e fish f a u n a i n t h e different regions ( s e e e.g. Weinstein e t al. 1980, L o n e r a g a n e t al. i n press). Acknowledgements. Our gratitude is expressed to K. R. Clarke and N. R. Loneragan for helpul criticism of the text and to L. Charlton and R. J. G. Manning f o ~drawing the figures. Financial support for the sampling was provided by the Leverhulme Foundation.
LITERATURE CITED Abou-Seedo, F. S., Potter, I. C. (1979).The estuarine phase in the spawning run of the river lamprey Lampetra fluv~atilius.J. Zool., Lond. 188: 5-25 Aprahamian, M. W., Barr, C. D. (1985). The growth, abundance and &et of 0-group sea bass, Dicentarchus labrax, from the Severn Estuary. J. mar. biol. Ass. U. K. 65: 16S180 Beal, K. L. (1980). Territorial sea fisheries management and estuarine dependence. In: Kennedy, V. S. (ed.) Estuarine perspectives. Academic Press, London, p. 67-77 Blaber, S. J. M., Blaber, T G. (1980). Factors affecting the distribution of juvenile estuarine and inshore fish. J. Fish Biol. 17: 143-162 Bray, J. R., Curtis, J. T (1957). An ordination of the upland
forest communities of southern Wisconsin. Ecol. Monogr. 27. 325-349 Claridge, P N., Gardner, D. C. (1977). The biology of the northern rockling, Ciljata septentrionalis, in the Severn Estuary and Bristol Channel. J. mar. biol. Ass. U. K. 57: 83!+848 Claridge, P. N., Gardner, D. C. (1978). Growth and movements of the twaite shad, Nosa fallax (Lacepede), in the Severn Estuary. J. Fish Biol. 12: 203-211 Claridge, P. N., Potter, I. C. (1983). Movements, abundance, age composition and growth of bass, Dicentrarchus labrax, in the Severn Estuary and inner Bristol Channel. J. mar. biol. Ass. U. K. 63: 871-879 Claridge, P. N., Potter, I. C. (1984). Abundance, movements and size of gadoids (Teleostei) in the Severn Estuary. J. mar. biol. Ass. U. K. 64: 771-790 Claridge, P. N., Potter, I. C. (1985). Distribution, abundance and size composition of mullet populations in the Sevem Estuary and Bristol Channel. J. mar. biol. Ass. U. K. 65: 325335 Claridge, P. N., Hardisty, M. W., Potter, I. C., Wilhams, C. V. (1985).Abundance, life history and ligulosis in the gobies (Teleostei) of the inner Sevem Estuary. J. mar. biol. Ass. U. K. 65: 951-968 Clandge, P. N., Potter, I. C., Hardisty, M. W. (1986).Seasonal changes in movements, abundance, size composition and diversity of the fish fauna of the Severn Estuary. J. mar. biol. Ass. U. K. 66: 229-258 Clark, J., Smlth, W. G., Kendall, W., Fahay, M. P. (1969). S t u d e s of estuarine dependence of Atlantic coastal fishes. U. S. Fish & Wildlife Serv. Tech. Pap. No. 28 Cooper. A. (1980). Gadoid populations of western Scottish sea lochs and their exchanges with west coast stocks. In: Freeland, H. J., Farmer, D. M,, Levings, C. D. (ed.) Fjord oceanography, Plenum Press, New York, P. 415-421 Cooper, A. (1983). The reproductive biology of poor-cod, Trisopterus minutus L., whiting, Merlangius merlangius L., and Norway pout. Trisopterus esmarkii Nilsson, off the west coast of Scotland. J. Fish Biol. 22: 317-334 Cronin. L. E., Mansueti, A. J. (1971). The biology of the estuary. In: Douglas, P. A., Stroud, R. H. (ed.) A Symposium on the biological significance of estuaries. Sport Fishing Institute, Washington D. C., p. 14-39 Dahlberg. M. D.. Odum. E. P. (1970).Annual cycles of species occurrence, abundance, and diversity in Georgia estuarine fish populations. Am. Mid. Nat. 83: 382-392 Dando, P. R. (1984). Reproduction in estuarine fish. In: Potts, G. W., Wootton, R. J. (ed.)Fish reproduction strategies and tactics. Academic Press, London, p. 155-170 Dando, P. R., Demir, N. (1985). On the spawning and nursery grounds of bass, Dicentrarchus labrax, in the Plymouth area. J. mar. biol. Ass. U. K. 65: 159-168 Day. J. H., Blaber, S. J. M,, Wallace, J . H. (1981). Estuarine fishes. In: Day, J. H. (ed.) Estuarine ecology with particular reference to Southern Africa. Balkema, Rotterdam, p. 197-221 Field, J. G., Clarke, K. R., Warwick, R. M. (1982). A practical strategy for analysing multispecies distribution patterns. Mar. Ecol. Prog. Ser. 8: 37-52 Fortier, L., Leggett, W. C. (1982). Ficluan transport and the dispersal of fish larvae in estuaries. Can. J. Fish Aquat. Sci. 39: 1150-1163 Gallaway, B. J., Strawn, K. (1975). Seasonal and area1 comparisons of fish diversity indices at a hot-water discharge in Galveston Bay. Texas. Mar. Sc. 19: 79-89 Haedrich, R. L., Haedrich, S. 0. (1974). A seasonal survey of the fishes in the Mystic River, a polluted Estuary in down-
228
Mar. Ecol. Prog. Ser 32: 217-228. 1986
town Boston, Massachusetts. Estuar. coast. mar. SCI 2. 5%73 Hoff, J. G.. Ibara, R. M. (1977). Factors affecting the seasonal abundance, composition and diverslty of fishes in a southeastern New England estuary. Estuar. coast. mar. Sci. 5. 665-678 Kruskal, J. B. (1977). Multidimensional scaling and other methods for discovering structure In: Enslem, Ralston, Wilf (ed.) Statistical methods for digital computers. John Wiley. New York Lance, G. N., Williams, W. T. (1967). A general theory of classificatory sorting strategies. 1. Hierarchical systems. Computer J. 9: 373-380 Livingston, R. J. (1976). Diurnal and seasonal fluctuations of organisms in a North Florida estuary. Estuar. coast. mar. Sci. 4: 373-400 Lloyd, A. J . (1941). Studies on the biology of the Bnstol Channel. V. The marine fish fauna of the southern shores of the Bristol Channel. Proc. Bristol Nat. Soc. 9: 202-230 Loneragan, N. R., Potter, I. C., Lenanton, R. C. J., Caputi, N. (in press). Spatial and seasonal differences in the composition of the fish fauna in the shallows of a large Australian estuary. Mar. Biol. Margalef, R. (1968). Perspechves in ecoloqcal theory. Univ. of Chicago Press. Chicago McDonald, J. S., Dadswell, M. J., Appy, R. G., Melvin, G. D., Methven, D. A. (1984). Fishes, fish assemblages, and their seasonal movements in the lower Bay of Fundy and Passamaquoddy Bay, Canada. Fish. Bull. U. S. 82: 121-139 McErlean, A. J., O'Connor. S. G., Mihursky, J. A., Gibson, C. I. (1973). Abundance, diversity and seasonal patterns of estuarine fish populations. Estuar. coast. mar. Sci. 1: 19-36 McHugh, J. L. (1967). Estuarine nekton. In: Lauff. G. H. (ed.)
Estuanes. American Association for the Advancement of Science, Washington, D. C., p. 581-620 McHugh, J. L. (1976). Estuarine fisheries: are they doomed? In: Smith, R. F.. Swartz, A. H., Massman, W. H. (ed.) Estuarine processes, Vol. 1. Academic Press, New York, p. 15-27 Norcross, B. L., Show, R. F. (1984). Oceanic and estuarine transport of fish eggs and larvae: A review. Trans. Am. Fish. Soc. 113: 153-165 Pielou, E. C. (1966). The measurement of diversity in different types of biological collections. J. theor. Biol. 13: 131-144 Potter, I. C., Claridge, P. N. (1985).Seasonal catches, size and meristic data for sprat, Sprattus sprattus, in the Severn Estuary. J. mar. biol. Ass. U. K. 65: 667-675 Quinn, N. J. (1980). Analysis of temporal changes in fish assemblages in Serpentine Creek, Queensland. Env. Biol. Fish. 5: 117-133 Titmus, G., Claridge, P. N., Potter, I. C. (1978). Growth and abundance of 0-group herrings, Clupea harengus L., in the Severn Estuary. Zool. J. Linn. Soc. 64: 251-260 Van den Broek, W. L. F. (1979). A seasonal survey of fish populations in the lower Medway Estuary, Kent, based on power station screen samples. Estuar. coast. mar. Sci. 9: 1-15 Weinstein, M. P., Weiss, S. L., Walters, M. F. (1980). Multiple determinants of community structure in shallow marsh habitats, Cape Fear Estuary, North Carolina, U.S.A. Mar. Biol. 58: 227-243 Wheeler, A. (1969). The fishes of the British Isles and NorthWest Europe. Macmillan, London Whitfield, A. K. (1983). Factors influencing the utilization of southern African estuaries by fishes. S. Afr. J. Sci. 79: 362-365
This article was presented by Dr. J . D Gage; it was accepted for printing on July 9, 1986