tion is that genetic constraint, expressed as heritability, acts as a simple brake on evolutionary .... successive generations, one must know whether the system of genetic constraints. (i.e., the G-matrix) has ...... Stearns, ed. The evolution of sex ...
Vol. 140, Supplement
The AmericanNaturalist
CONSTRAINTS ON PHENOTYPIC
November 1992
EVOLUTION
STEVAN J. ARNOLD Departmentof Ecology and Evolution, Universityof Chicago, Chicago, Illinois 60637 Abstract.-Constraints on phenotypicevolution can take a varietyof forms.Constraintscan arise frominheritance,selection,development,and design limits.Contemporaryvisions of the evolutionaryprocess oftenfocus on one or two of these varieties and ignore the others. A unifyingframeworkthat considers all fourmajor varietiesof constraintis emergingwithinthe disciplineof quantitativegenetics. I attemptto sketchthatemergingframeworkand summarize recent effortstoward unification.Althoughcouched in the technical language of quantitative genetics,the ongoing search for a common frameworkpromises a rapprochementamong the approaches of optimalitytheorists,populationgeneticists,and developmentalbiologists.
This articlehas two aims. The firstis to reviewthe rapidlyexpandingliterature dealingwithconstraintson phenotypicevolution.The second is to brieflydiscuss some aspects of constraintsas theyaffectand are affectedby behavioralevolution. No attemptis made to review the empiricalliteratureon geneticvariances and covariances forbehavioraltraits,a subjecttreatedin two recentbooks (Hahn et al. 1990; Boake 1993). Evolutionaryconstraintsare restrictionsor limitationson the course or outcome of evolution. Discussions of evolutionaryconstraintare oftendifficult to followbecause of a failureto distinguishamong underlyingconcepts. In particular, it is usefulto distinguishbetweengenetic,selective,functional,and developmentalconstraints.Definitionsof these varietiesof constraintand theirinterrelations are discussed in the sections thatfollow. It is also useful to recognize four key properties of constraints: source, strength,consequence, and persistence(Maynard Smithet al. 1985). By source I mean the mostproximatecauses of constraint-forexample, statisticaldistributionsof allelic effectsin the case of geneticconstraint,relationshipsamongontogeneticprecursorsin the case of developmentalconstraints.Strengthis an attribute that can sometimesbe measured in statisticalor mathematicalterms(e.g., variance, covariance, regressionslope, firstand second derivatives).The consequences of a constraintare ultimatelyon evolutionaryprocess and outcome. The consequences may be director mediatedthroughotherkinds of constraint. Persistencerefersto the stabilityof a constraintover evolutionarytimeand can be assessed by longitudinalor comparativestudies. AN OVERVIEW OF THEORY
A currentchallenge is to finda unifyingframeworkthat accounts forall four basic propertiesof geneticand otherkindsof constraint.Progresshas been made, Am. Nat. 1992. Vol. 140, pp. S85-S107. ? 1992 by 'he Universityof Chicago. 0003-0147/92/4007-0005$02.00. All rightsreserved.
THE AMERICAN NATURALIST
S86 HORIZON 1
HORIZON2
HORIZON 3
HORIZON 4
SELECTION) INMEAN= (GENETICCONSTRAINTS) (DIRECTIONAL CHANGE
CHANGE IN = GENETIC CONSTRAINTS
CHANGE DUE + TO SELECTION
|TIVE
CHANGE DUETO MUT./RECOMB.
CONSTRAINTS
ANDFUNCTIONAL DEVELOPMENTAL CONSTRAINTS|
FIG. 1.-A frameworkfor the main theoreticalconnectionsbetween genetic, selective, developmental,and functionalconstraints.Immediateconsequences are shown by arrows.
but we stilldo not have a conceptual frameworkthatserves all purposes equally well. The most tangibleprogress has been made by buildingon the statistical frameworkprovidedby the fieldof quantitativegenetics,the studyof the inheritance of traits affectedby many loci. A quantitativegenetic frameworkdoes a good job of describingthe strengthand short-termconsequences of genetic constraints.It has been less successful in dealing with the sources, long-term consequences, and persistenceof genetic constraints.Much theoreticalwork in the last decade has focused on correctingthese deficiencies.To understandboth the triumphsand shortcomingsof this recentwork,a briefhistoricalsummaryis useful. For a fulleraccount of historicaldevelopmentsin quantitativegenetics, see Hill (1984a, 1984b). The theoretical structureprovided by quantitativegenetics consists of four horizons,shown diagrammaticallyin figure1, withthe oldest horizon on the top and the most recent on the bottom. The main message in the diagram is that selective, developmental,and functionalconstraintsexert theirevolutionaryeffectsby affectinggeneticconstraints. We may definegenetic constraintsas the patternof genetic variationand covariationfor a set of traits.The most useful definitionof genetic variationand covariationhas proved to be the additivegeneticvariances and covariances that and thatconsequentlyenable describeresemblancebetweenparentsand offspring us to predict responses to selection. In theoreticalwork these variances and covariances are often arranged in a so-called G-matrixin which the row and column labels referto particularphenotypicattributesor traits(table 1). Thus, the elementson the main diagonal are geneticvariances, and the otherelements of a traitis simplyits standardizedaddiare geneticcovariances. The heritability tive genetic variance: h3 = Gii/Pii,where Gii and Pii refer,respectively,to the
S87
CONSTRAINTS ON EVOLUTION TABLE I THE AND
ESTIMATED FOUR
ADDITIVE
GENETIC
Trait
BB
BB. Bristlenumber TX. Thorax length WL. Winglength WW. Wingwidth TB. Tibia length
.9370 .0042 .0119 .0022 .0492
-
MATRIX
VARIANCE-COVARIANCE
IN AN EXPERIMENTAL
MEASUREMENTS
POPULATION
FOR A BRISTLE
OF DROSOPHILA
COUNT
MELANOGASTER
TX
WL
Ww
TB
.0042 .4844 .2367 .3713 .1868
- .0119 .2367 .3238 .3696 .1564
- .0022 .3713 .3696 1.0241 .2511
.0492 .1868 .1564 .2511 .3733
SOURCE.-Wilkinsonet al. 1990. Reprintedby permission. NOTE.-The estimates are based on an analysis of 181 sets of parents and SIX offspringfrom a line selected forlarge thoraxlength.
additive genetic variance and phenotypicvariance of the ith trait.The genetic correlationbetween two traitsis simplya standardizedgeneticcovariance: Gi1l , Gjj, where Gij is the additive genetic covariance between the ith and jth traits.The magnitudesof thegeneticvariancesand covariances (or theirstandardized analogues) measure the strengthof geneticconstraint. The patternof constraintsembodiedin the G-matrixcan be visualized by transformingit to a diagonal form.The elementson the main diagonal (eigenvalues) of the transformedG-matrixare the genetic variances for trait combinations; matrix the off-diagonalelements are all zero. The rows of the transformation (eigenvectors)give the traitcombinationsor the new axes in multivariatespace. Such diagonalized G-matricescan be used to identifydirectionsin phenotypic space thatare most geneticallyconstrainedin the sense thattheyhave the least geneticvariance. Examples of diagonalizationof G-matricesusingprincipalcomponentanalysis are given elsewhere (Gale and Eaves 1972; Arnold 1981; Atchley et al. 1981; Cheverud 1982; Leamy and Cheverud 1984). The First Horizon: Response of the Mean to Selection The firsthorizon consists of a familyof equations forpredictingthe change in traitmeans fromone generationto the next. The univariatememberof thefamily was in place by the 1930s (see, e.g., Lush 1937). This earliestversion says that the mean of a single traitwill be shiftedacross generationsby an amountequal to the product of heritabilityand the force of directionalselection (A-z= h2S). This versionmay be called the breeder's equation, because its principaluse is to predicthow muchimprovementto expect in some attributewhendeliberateselectionis practicedon thatattribute.The view thatcomes fromthe breeder's equaacts as a simple brake tion is that genetic constraint,expressed as heritability, on evolutionarychange. Under perfectinheritancethe fullforce of selection is translatedinto evolutionarychange, but in a world of imperfectinheritanceonly a fractionof the selective forceis translatedinto change. The inadequacies of the breeder's equation,'even for practical applications, were appreciated by the early 1940s (see, e.g., Hazel 1943). When selection is exertedon a particulartrait,thattraitmay respondto selection,but so may other
S88
THE AMERICAN NATURALIST
traits.These secondary or correlatedresponses to selectionmay be undesirable and mustbe accounted forin the breedingprogram.The solution,whichremains today, was to expand the concept of genetic constraintto include connections between traits. The solution was rooted in observationsof the followingkind. When a poultryflockis selected forincreased egg production,productiontends to increase, but body size decreases (Dickerson 1955). The Mendelian basis for such observationscan be derivedusing the algebraicmodel independentlyintroduced by Weinberg(1910), Fisher (1918), and Wright(1921). (For a translation of Weinberg'sarticleby K. Meyer,see Hill 1984a.) Resemblancebetweenparents and offspringin the same traitcan be ascribed to variance in additive genetic values for the trait (additive genetic variance) (Fisher 1918). Correspondence between one traitin parents and another traitin offspringcan be ascribed to covariance in additivegeneticvalues (additivegeneticcovariance). For example, a negativegeneticcovariance betweenegg productionand body size helps explain nonintuitiveresponses to selection in chickens (Gyles et al. 1955). Thus, by the early 1940s we had the ingredientsfora multivariateview of geneticconstraints. Over the next few decades the multivariateview of genetic constraintsfocused on the practicalproblemof improvingdomestic animals and plants. During this period it was largelyignoredby evolutionarybiologists. The most relevantconceptual advance in the practicalrealmwas the developmentof selectionindexes. The breederhas multipleobjectives, and so the problem is to devise a selection programthat will give the best results across the board. The standard approach, rooted in the work of Smith (1936) and Hazel (1943), is to devise a weightedsum of traits,the index, upon which selection is practiced. To findthe index that gives the best aggregategenetic response to selection, one needs to know both the genetic and phenotypicvariances and covariances of the traitsas well as the economic value of each trait(Hazel 1943). By the late 1970s a general solution had been achieved using the convenient notationof matrixalgebra (Young and Weiler 1960; Magee 1965; Yamada 1977). These laterarticlesalso provideda solutionto theinverseproblemofretrospective selectionanalysis, which arises when observed responses to a selectionprogramdo not match expectations. In these circumstances,it is desirable to estimate the selection that was actually imposed and compare it withthe selection that was supposedly imposed. The ingredientsin such a retrospectiveanalysis are the phenotypiccovariances of the traitswiththe index, as well as the phenotypicand geneticvariances and covariances of the traits.If we move beyondthe purely practical concerns of the authors in question and equate the selection index with fitness,then theirequations (see, e.g., Yamada 1977, eqq. [3b] and [11]) convergeon those laterused by evolutionarybiologiststo predictresponses to multivariatenaturalselection(Lande 1979). This connection,however,is only obvious withthe clarityof hindsight.In summary,solutionsto the problemsof imposingmultivariateselection and analyzingthat selection in retrospectwere characterizedby increasingsophisticationin statisticaltechniquesand multivariate characterizationsof genetic constraintsduringthe period 1936-1979. Meanwhile, application of quantitative genetics in evolutionarybiology remained
CONSTRAINTS ON EVOLUTION
S89
stalledat the level of the univariatebreeder's equation, despiteexpositoryefforts by Robertson(1955) and Falconer (1960). The applicationof multivariateconcepts of selection and geneticconstraintto evolutionaryproblemswas made in a pathbreakingarticleby Lande (1979). The problemposed by Lande was how to predictthe geneticresponse of a population when naturalselection acts simultaneouslyon multipletraits.The ingredientsof the solutionconsistedof multiplegeneticconstraints,encapsulatedin a G-matrix, and a multivariatecharacterizationof selection, a vector of selection gradients, P. More precisely,the change in means of each of a set of traitsfromone generationto the next was shown to be the matrixproductof G and f3,Az = G,. The selectiongradientswere derivedas partialderivativesof mean fitnesswithrespect to average traitvalues in the population.The derivationof multivariateresponse to selectionfollowedthe traditionin quantitativegeneticsof usingthe regression values on the phenotypesof theirparentsas a launchingpoint. What of offspring was new in Lande (1979), aside fromthe applicationto multivariateevolutionary problems,was the formalcharacterizationof selectionas a gradienton an adaptive landscape. This gradientview of selection provided a bridge to Wright's adaptive landscape for a fieldof gene frequencies,as well as the startingpoint for a host of evolutionarymodels, and it will be discussed here as the third horizonin the classificationscheme. Thus, by the late 1970s the firsthorizon in the conceptual scheme consisted of a multivariateversionof the breeder's equation thatis usefulforpredictingresponse to naturalselection. The Second Horizon: Genetic Constraintsand TheirEvolutionaryPersistence The second horizon in the diagram(fig. 1) deals withevolutionof the genetic constraintsthemselves.The equation in the top horizontells how muchthe mean of each traitwill shiftfromone generationto the next. To apply the equation to successive generations,one mustknow whetherthe systemof geneticconstraints (i.e., the G-matrix)has changed. Many evolutionarybiologistsare familiaronly withthe earlyargument,whichtraces to Fisher (1930), thatdirectionaland stabilizingselectionwillprogressivelyerode the geneticvarianceof a quantitativetrait and eventuallyeliminateall heritablevariation. Lande (1976a) argues that the geneticvariance of a traitaffectedby many loci will enjoy appreciable inputof mutationeach generation.Consequently,underweak stabilizingselection,a balance will be struckbetween loss due to selectionand inputfrommutationso that appreciablegeneticvariance mightbe maintainedat equilibrium.Later, analogous models and argumentswere advanced forthe maintenanceof geneticcovariances betweentraits(Lande 1980a, 1984). In response,Turelli(1984, 1985, 1986) argues thattheamountof geneticvariance or covariance maintainedat equilibriummight be minusculeor appreciable, dependingon what distributionalassumptionsare made about mutationalinput.Turelli(1988) arguesthattheissue cannotbe settled on theoreticalgroundsand has appealed forfurtherempiricalwork. The importantpoint is that by the mid-1980sa formalequation forevolutionarychange in geneticconstraintswas advanced thattook intoaccount both selectionand mutation. I shall take up the theoreticalaspects of change in geneticconstraintsin the
3.6
y = -0.04 + 0.68x
2.8 -4
r
(a)
0.821
01.42
w2.0
-1.0.
--
C/)
1.2 -. 60.4
1.8
2 y =-0.01 + 0.91 x
(
b)
0.6 6
0.2 -
=0.13+ y
=
= 0.527
/r
-0.4 - 0.4
4
a.
0.4
1.2 2.0 RAT Pij
2.8
-0.2 -0.2
3.6
0.30 + 0.72x
= 0.26 + 0.37y
0.2
0.6 10 1.4 RAT Gij
1.8
y = 0.13 + 0.63x /
y = -0.01 + 0.91x 5~~~~~~~~ x =
0.04 + 1.03y r=0.965
.
x = 0.03 + 0.70y r 0.666
4
/,
/
3 -0.2
-0.2
0~~~~
0~~~~~~~~~
-1.~~~~~~~~~~~~~-2
-1
3
012
4
-0.2
0
MAN Pij
1.4 y = -0.14 + 0.78x
1v4n
x = 0.24 +
0.8 (c)~~~~~O e 7,
nloy
N
0.6
1.0 rs0.925
0.2 -
-0.2 - 0.2
4
6
ny = -0.03 + 1.03x x = 0.05 + 0.86y
r= 0.940
-~~~~O 0-4-
ct 0.6
1986).
2
MAN Gij
-fO /0 I I I I 0.2 0.6 1.0 SMALL Pij
-
1.4
0.2 0.0
*-
-0.2 -0.2
0.0
0.2 0.4 SMALL Gij
0.6
0.8
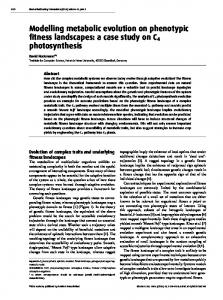
FIG. 2.-Comparative studies of phenotypic(left) and additivegenetic (r-ight)varianceThe scatterplots show matrixelements covariance population plotted 15 skul an matrices. oymaueet yedig10dt onsi hfrom pos one dtrmLfvl against correspondingmatrixelementsfromthe otherpopulation. Sample sizes forphenotypicmatricesare denoted n (numberof individuals)and forgeneticmatricesare denotedN (number of families). The solid lines are least-squares regressionlines. The dashed lines show the alignmentof points expected under matrixidentity.a, Matrix comparisons for random-bredmice (Mus mlusculus;n = 707, N = 108) and selected lines of domestic rats (Rattus norvegicus;n = 522, N = 54). The matricesare based on eightpelvic measurements (yielding36 data pointsin the plots) (data fromKohn and Atchley1988). b, Matrixcomparisons for white-footedmice (Peromyscus leucopus; n = ca. 315, N = 105) and deer mice nebrascensis; n = ca. 273, N = 91). The matricesare based on (Per-omyscusmnaniculatus 15 skull and body measurements(yielding120 data pointsin the plots) (data fromLofsvold 1986). Estimates of geneticvariance in the right-hand plot were constrainedby the relation-
CONSTRAINTS ON EVOLUTION
S91
next section afterI introducea characterizationof selective constraints.For the moment,I will concentrateon the empiricalaspect of the second horizon. The persistenceof geneticconstraintsis an empiricalissue. In principle,genetic variances and covariances could change considerablyfromgenerationto generation because they are functionsof underlyinggene frequencies(Falconer 1989). The issue is whethertheG-matrixactuallychanges duringevolutionaryexcursion of the multivariatemean phenotype. Stabilityhas been assessed by selection experimentsand comparative studies. The two kinds of studies offerslightly different perspectiveson the issue of stabilityin nature.A selection experiment can tellus whetherand how much the G-matrixchanges undera knownselection regime.To extrapolatethe resultsto the naturalworld, one needs to know how the imposed selection compares with selection in nature. A comparativestudy can tellwhetherand how muchthe G-matrixhas changedundernaturalselection regimesand over long time intervals.But, withouta companion studyof selection,a comparativestudyof G-matricescannot diagnose the selective causes of change. Only a handfulof studies have used one or the othertechniqueto compare largeG-matricesthatare estimatedfrom100 or morefamiliesin each sample (Atchley et al. 1981; Lofsvold 1986; Kohn and Atchley 1988; Wilkinsonet al. 1990). The comparisonof covariance matrices,such as G-matrices,can be viewed as a seriesof nestedhypotheses:matrixidentity(equalityof correspondingelements), matrixproportionality(the elements in one matrixare a scalar multipleof elein principalcomponentstructures(Flury mentsin theothermatrix),and similarity 1987). The firsttwo hypothesescan be visualized by makingscatterplotssuch as those shown in figure2. Under matrixidentitythe points should be arrayedon a the pointsshouldbe arrayedon some other 450 line. Under matrixproportionality line thatpasses throughthe origin.The optimisticview of resultsfromthe best studiesis thatG-matrices,as well as the P-matrices,fromdivergentlines or taxa are proportionaland sometimesvirtuallyidentical. The pessimisticview is that some plots show an uncomfortablylarge amount of scatter,with some matrix elements showing considerable divergence. Note that the sample sizes for the phenotypicmatricesplottedin figure2 are 3-10 timeslargerthanthe sample sizes forgeneticmatrices.Thus, the highercorrespondenceof phenotypicmatrices(r = 0.82-0.96 vs. r = 0.53-0.94 forgeneticmatrices)suggeststhatan appreciable amount of scatter in the scatterplotsfor genetic matricesrepresentserrors of estimation. Although there are encouraging signs that the constraintsimposed by Gmatricesmay be evolutionarilypersistent,muchremainsto be done. Clearly,we need more data ifwe are to determinewhichtraitsshow stable geneticvariances and covariances and whichdo not,and on whattimescale. An empiricalchallenge ship h2 c 1.0. c, Matrix comparisons for two lines of Drosophila melanogaster after23 generationsof selectionforlarge (n = 870, N = 145) and small (n = 762, N = 127) thorax size. The matricesare based on fourbody measurementsand one bristlecount (yielding15 data pointsin the plots) (data fromWilkinsonet al. 1990).
S92
THE AMERICAN NATURALIST
is to move fromcomparisonsof pairs of taxa to multiplecomparisonson a known phylogenyso that we can trace the evolution of G-matrices.Also, statistical techniquesforcomparisonof G-matricesneed to be perfected(Turelli1988; Shaw 1991).
Constancy or proportionalityof G-matricesopens the door to several novel modes of data analysis. We can reconstructthe netforcesof directionalselection in the phenotypicmeans of a pair of sistertaxa thathave produced differentiation (Lande 1979; Price et al. 1984; Schluter1984; Price and Grant 1985; Arnold 1988; Lofsvold 1988; Turelli 1988). We can also testthe patternof among-taxavariation and covariationin phenotypicmeans againstthepatternexpected undermultivariate drift(Lande 1979; Lofsvold 1988). In addition,we may be able to determine theroles of geneticconstraintsand among-taxacovariance in selectionin producing interspecificcovariation in means and allometry(Felsenstein 1988; Zeng 1988). Equations underlyingthe last two exercises are predicatedon starphylogenies and need to be extended to the case of arbitrarybranchingsequences. The ThirdHorizon: Selective Constraintsand TheirConsequences Selective constraintsarise fromthe ecological relationshipsbetween the population and its environment(Endler 1986) and also frominteractionsbetween the parts of an organism (Riedl 1979; Cheverud 1984). Selective constraintsexert theireffectson evolution directlyunder the guise of directionalselection and indirectlyunder the guise of stabilizing(nonlinear)selection thataffectsgenetic constraints(fig. 1). The directand indirecteffectsof selective constraintscan be visualized using the idea of an adaptive landscape. More exactly, the strength and patternof selective constraintscan be measured as the slope and curvature of an adaptive landscape. An adaptive landscape is simplythe relationshipbetween average fitness(or its logarithm)and average traitvalues. The most familiaradaptive landscape for a single traitis a curve that is bowed downward. Such a curve contractsthe phenotypicvariance of the traitand is said to exert stabilizingselection if the populationmean is near the peak of the curve. The criticalselection parameter for this effectis the curvatureof the landscape (Lande and Arnold 1983). The strongerthe curvature,the greaterthe contractionin variance and the stronger the stabilizingeffect.If we generalize this kind of landscape to two traitdimensions, we have a hill. In threetraitdimensions,we have a spheroid. But, as we move to two or more dimensions,we need to considerthe orientationof the hill, spheroid,and so forth.The selection parametersdescribingorientation,like the measures of curvatures,are second derivativesof fitnesswithrespectto pairwise traitproducts. These orientationparametersare measures of so-called correlational selection. They describe effectson the phenotypic(and genetic) covariances of traits(Phillips and Arnold 1989). The set of curvatureand orientation withcoefficientsof stabiparameterscan be convenientlyarrangedin a -y-matrix, lizing selection on the main diagonal and coefficientsof correlationalselection can be estimatedin a naturalor experimentalpopulation elsewhere. The -y-matrix by curvilinearregressionof relative fitnesson traitvalues and productsof trait values (Lande and Arnold 1983). The importantpoints are thatwe have a formal
CONSTRAINTS ON EVOLUTION
S93
theoryrelatingmultivariatecurvatureof the adaptive landscape to changes in the G-matrixand thatwe have statisticaltechniquesforestimatingthose curvatures. One useful equation fromthe second horizon relates the change in genetic constraintsto the curvatureand slope of the adaptive landscape and to mutation and recombination: AvG = G(y -
p,T)
G + U,
whereAvGis the change in the G-matrixfromone generationto the next,G is the additivegeneticvariance-covariancematrixbeforeselection, the termin parentheses is the curvatureof the adaptive landscape evaluated at the population's phenotypicmean, and U is a matrixdescribingmutationaland recombination contributionsto genetic variances and covariances (Lande 1980a; Phillips and Arnold 1989). The firsttermon the rightrepresentsthe change in G withina generationdue to selection (beforemutationand recombination).The matrixof geneticconstraints,G, evolves toward an equilibriumpatternthatis a compromise between patternsimposed by selection and mutation(Lande 1980a). The patternof stabilizingselection,however,will evidentlyplay the dominantrole in shapingthe G-matrixunless pleiotropicinputfrommutationis strong.At equilibrium, AvG= 0 and there is no directionalselection (, = 0). Rearrangingthe equation, we findthat - GyG = U, where G is the equilibriumG-matrix.Solutionsto thisequation indicatethatthe patternof the equilibriumG-matrixfortwo traitsgenerallycorrespondsto the orientationof the adaptive landscape, which is describedby the coefficientsof stabilizingand correlationalselection,Y. Sokal (1978) and Cheverud (1982, 1984) have argued for such a correspondencebut perhaps make the case strongerthanit actuallyis. The correspondencebetween equilibriumpatternsof selection and genetic constraintis strongin the special case consideredby Cheverud (1984) in whichthereare no pleiotropicmutational inputs,or such inputscancel, so thatall off-diagonalelementsin U are zero. In the face of strongpleiotropic inputs frommutation,however, the equilibrium patternof geneticconstraintcan differconsiderablyfromthe patternimposed by selection.Nevertheless,thetheoreticalresultsfromthe second and thirdhorizons give hope thatestimatesof selection can illuminatethe evolutionof geneticconstraints. Althoughwe can solve forthe equilibriumG-matrix,solvingforthe evolutionary path of the G-matrix(its dynamics)is a difficult problem.As the phenotypic mean evolves on the adaptive landscape, the patternof selection changes, and consequentlythe rate and directionof evolutionin the G-matrixchange. Those changes in G can in turn alter the rate and directionof change in phenotypic mean. However, coupled equations fromthe second and thirdhorizons can be used to numericallytrace the evolution of the G-matrix.Via and Lande (1987) have used this approach in a model forthe evolutionof phenotypicplasticity.In thatmodel, even large displacementsof the mean froman adaptive peak produce only small and transientchanges in the G-matrix. The long-termconsequences of selective constraintson evolutionaryoutcome have been explored in a series of models forphenotypicevolution.These models assume constantpatternsforgeneticand selective constraints(i.e., an invariant
S94
THE AMERICAN NATURALIST
G-matrixand a constantadaptivelandscape). Even thoughtheadaptivelandscape is constant,as thepopulationmean moves on thelandscape, it experienceschanging selection pressures. Typically, an adaptive landscape with a single peak is modeled (Lande 1980b; Via and Lande 1985), but some models withtwo peaks have also been constructed(Felsenstein 1979; Kirkpatrick1982; Slatkin 1984; Lande 1986; Slatkinand Kirkpatrick1987; Charlesworthand Rouhani 1988). Evolutionarymodels with constant adaptive landscapes and G-matricesprovide some generalizationsabout the effectsof selective constraints.First, the phenotypicmean of the populationtends to evolve in an uphilldirectionon the and adaptive landscape (Lande 1979). When selection is frequency-independent thelandscape is Gaussian, the populationmean equilibrateson an adaptivepeak. Burger(1986), however,modeled evolutionon a landscape thatwas an ascending ridgewithincreasinglysteep flanks.He foundthatthe populationwould equilibrateon theridgecrestwhen stabilizingselectionreacheda criticallevel. Second, frequency-dependentselection generally causes the population to equilibrate some distance downslope froman adaptive peak (Lande 1976b, 1980b). Finally, when the numberof selective constraintsis less thanthe numberof geneticconstraintsso that some geneticallyvariable traitsare selectivelyneutral,thereis a collectionof possible equilibriumpoints(a line, plane, or hyperplane)ratherthan a single equilibriumpoint (Lande 1981; Lande and Arnold 1985). In the case of matingpreferencesand sexually selected traits,for example, the evolutionary outcome is changed dramaticallydependingon whetherselectionacts on mating preferences(Arnold 1987; Pomiankowskiet al. 1991). The most general effectof geneticcovariances or unequal geneticvariances is to cause curved evolutionarytrajectories(Lande 1980a; Via and Lande 1985). The populationmean evolves on a straightpath towardan adaptive peak only in the special case of zero genetic covariances and equal geneticvariances. When geneticcovariances are nonzero and/orgeneticvariances are unequal, evolution proceeds rapidlyin some directionsbut only very slowlyin otherdirections(fig. 3). The consequence is a curved evolutionarytrajectorytowardtheadaptivepeak witha slow finalapproach in a directionforwhichthereis littlegeneticvariation. When the landscape has two peaks and the population mean is situated in a criticalboundaryregion,geneticcovariance can determinethepeak towardwhich the populationevolves (Burger 1986; Slatkinand Kirkpatrick1987). The Fourth Horizon: Developmental and Functional Constraints and TheirConsequences A promisingrecent approach is to view genetic constraintsas arisingfrom underlyingconstraints(the lowest horizon in fig. 1). The search for order in genetic constraintshas been pursued by studentsof morphologicalinheritance evolution.Both schools seek a manageable theory and by studentsof life-history for the evolution of constraintsthat is cast in termsof underlying,proximate causes. The goal of both schools is to move beyondthe earlierattitudeof viewing geneticconstraintsas parametersthatmustbe estimatedon a case-by-case basis. The constraintsof the morphologicalschool are usuallydevelopmental.The func-
CONSTRAINTS ON EVOLUTION
z
S95
/1
LZX~~~~~~~~~~~~~~~~~~~~~~~~~~~~~~~~~~~~~~~~~ -0.50
+.0-
5-~~~~~~~
-T-
z uj
uj
AVERAGEBEHAVIOR IN ENVIRONMENT1 FIG. 3.-The Via-Lande model forthe evolutionof phenotypicplasticity.At the startof each generation,individualsdisperse with equal probabilityinto one of two environments and then spend theirentirelifein thatenvironment.The contourlines show mean fitnessas a functionof average phenotype(behavior) in each environment.There is an adaptive peak near the top center of the plot. Populations withno behavioral plasticitywould lie on the dashed line. Startingfrom the same behavioral average with no plasticity,evolutionary trajectoriesare shown for five populations with differentvalues for genetic correlationin behavior. Arrows show evolutionarychange in the mean at about 50 generationintervals (afterVia and Lande 1985, fig.3C).
school deal withlimitationson traitvalues, tional constraintsof the life-history but the constraintsare not described in developmentalterms. Developmentalconstraintsare limitationson the set of possible developmental states and theirmorphologicalexpressions (Atchley 1987). Developmental constraintsarise fromontogeneticprocesses, especially fromtheirorderingin time. Many authors have argued that developmentalprocesses and constraintshave importantevolutionaryconsequences (Gould 1977; Alberch et al. 1979; Riedl in evaluating the evolutionary 1979; Bonner 1982; Wake 1991). One difficulty consequences of developmental constraintsis that most argumentshave been cast in nongeneticterms.We can ask, however, How does developmentimpose geneticconstraints(Atchley 1987; Wagner 1989; Atchleyand Hall 1991)? One perspective on the genetic constraintsthat are imposed by development is gained by followingthe G-matrixthroughontogeny.This approach has been explored by studentson postnatal mammaliandevelopmentfornearlythreedecades (reviewed in Atchley 1984). (For an introductionto an analogous tradition in the behavioral sciences, see Hahn et al. 1990.) A breedingdesignis conducted to produce individuals of known relationship,and then a set of measurements
S96
THE AMERICAN NATURALIST
(mass, head length,tail length,etc.) is made on each individualat a series of ages. The many genetic variances and covariances thatare estimatedin such a studycan be displayedin a varietyof tabularand graphicformats.For thepresent discussion, it is useful to imaginethemassembled in a single developmentalGmatrix.The matrixincludes genetic variances and covariances at each age, as well as geneticcovariances between traitsmeasured at different ages. Developmental G-matrices commonly show regularitiesin their elements. These regularitiesreflectgenetic constraintsthatare imposed by developmental processes such as growth.For example, the geneticvariance of a particulartrait may increase with age (Cheverud et al. 1983a). Anothercommon patternis for the genetic correlationbetween the same traitmeasured at different ages (e.g., between head lengthat different ages) to be highwhen the two ages are close (e.g., ages 1 and 2) and to decline progressivelyas the two ages become more disparate (e.g., ages 1 and 10) (Cheverud et al. 1983b; Cheverud and Leamy 1985). Such regularitiesin the developmentalG-matrixapparentlyreflecta greater communalityof underlyingprocesses for traitsexpressed at adjoining ages as opposed to widelyseparatedages. Atchley(1984) discusses how such regularities can be relatedto a model of compensatory(targeted)growth. Inheritance,selection,and evolutionof developmentaltrajectoriescan also be modeled withcontinuousfunctions(Kirkpatrick1988; Kirkpatrickand Heckman 1989; Kirkpatricket al. 1990). A characterthatchanges withage can be viewed as a continuousfunctionof age (an infinite-dimensional trait)ratherthan a measurementmade at a series of landmarkages. In the infinite-dimensional framework, the G-matrixbecomes a G-function.By decomposingthe G-functioninto we can determinepossible directionsof evoluitseigenvaluesand eigenfunctions, tionarychange in growthtrajectoriesforwhichthereis littleor no geneticvariation. In otherwords, we can identifythe directionsof evolutionarychange that are most geneticallyconstrained. Anotherway to finda bridgebetweendevelopmentand geneticconstraintsis to constructa model forthe relationshipbetweentwo traitsand theirdevelopmental precursorsand examine the model's statisticalconsequences. The relationship between precursorand traitconstitutesthe developmentalconstraint.Perhaps the easiest consequence to model is the correlationthatarises when two traits develop froma common precursor. For example, Riska (1986) used standard expressions for the variance and covariance of variables that are the sums or products of other variables to dissect the correlationsexpected under various simpledevelopmentalprocesses. To use such models directly,we would need to assess the phenotypicand geneticvariances and covariances of embryonictraits and developmentalprocesses, as well as the statisticsof end points. However, the quantitativegeneticsof embryosis a virtuallyunexploredrealm. Slatkin (1987) and Wagner (1989) have extended Riska's approach by constructingmodels for the evolution of developmentallycoupled traits. Slatkin (1987) presents a modelingframeworkfor the evolution of the developmental processes thatunderlieontogeneticendpoints(adult traits).Slatkinsolved forthe phenotypicand geneticcovariationof the end points in termsof the covariation
CONSTRAINTS ON EVOLUTION
S97
of therates and timingof the underlyingdevelopmentalprocesses. Assumingthat selection acts directlyon the adult traitsand only indirectlyon developmental processes, Slatkin is able to model the evolution of ontogenyas a correlated response to selection on adult traits.Wagner (1989) constructshis model on the premisethat pleiotropiceffectsof a gene are constrainedby the developmental frameworkin which it is expressed. The systemof developmentalconstraintsis assumed to be evolutionarilyconstant,and mutationalinputis superimposedon thatsystem.Wagner is able to show thatthe equilibriumG-matrixis a function of per-locusmutationrates, developmentalconstraints,and the curvatureof the adaptive landscape. The cause of genetic constraintis also a contemporaryissue among students evolution(Partridgeand Sibly 1991). An importantbridgebetween of life-history evolution and quantitativegeneticswas providedby the insightthat life-history trade-offscan be described by genetic covariances. If we wish to life-history traitsto selection,it is the genetic predictthe short-term response of life-history covariances between traitsratherthan the more accessible phenotypiccovariances that most directlyaffectthe prediction(Lande 1982; Reznick 1985). In recentyears the focus has shiftedto the issue of whethera trade-offinevitably impliesa negativegenetic covariance and to the connectionbetween functional and geneticconstraints.In otherwords, the focus has shiftedfromthe upper to the lower horizons in figure1. Althoughthis recentliteratureis directedat lifehistoryevolution,its lessons have broader implications. Van Noordwijkand de Jong(1986) make the importantobservationthatvariation in processes of resource acquisition can mask an underlyingtrade-off.The argumentis easiest to understandby analogy with a problemin household economics. Withinany given household thereis likelyto be a trade-off between the amount of money that can be spent on a car versus the home. But because households differin income, when we look at the correlationbetween car and home expendituresacross all households, the correlationmay be positiverather than negative. More generally,variationin acquisitionof resources can mask a between resources allocated to two competingalternatives(fig.4). For trade-off example, the correlationbetween reproductionand subsequentsurvivalrate may be positive ratherthan negative simply because individuals vary in the total amountof energythatcan be devoted to these two functions.Houle (1991) casts the argumentin genetictermsand explores its consequences. The bottomline is that a simple correlationis not an infallibleindicatorof underlyingtrade-offs. this point was appreciatedby some empiricistsand circumvented Interestingly, using partial correlation(Stewart 1979) beforethe general theoreticalargument was advanced. The van Noordwijk-de Jongmodel, like Riska's (1986) models of developmentalconstraint,partitionsthe covariance betweentraitsintothe variationand covariationof underlyingtraitsor processes. Limitson thevalues of trait combinations,which will be considered next, are a strongerformof constraint. Functional constraintsare limitationson values of traitsor of traitcombinations. The limitationsare imposed by time, energy,or the laws of physics. In models of life-history equilibria,functionalconstraintstake such formsas "total
3
\
(a)
p=0.25 p=0.50
w
2
wv' 1?0
>