Submitted in Partial Fulfillment of the. Requirements for the Degree of. Master of Science. (in Civil Engineering). The Graduate School. The University of Maine.
CONSTRUCTED WETLAND USE FOR TREATMENT OF DAIRY MILKHOUSE WASTEWATERS IN MAINE
Robert A. Kostinec B.S. Wayne State College, 1986 M.S. University of South Dakota, 1992
A THESIS Submitted in Partial Fulfillment of the Requirements for the Degree of Master of Science (in Civil Engineering)
The Graduate School The University of Maine May, 2001
Advisory Committee: Chet A. Rock, Professor of Civil and Environmental Engineering, Advisor Willem Brutsaert, Professor of Civil and Environmental Engineering Rose Mary Seymour, Assistant Professor of Bio-Resource Engineering
CONSTRUCTED WETLAND USE FOR TREATMENT OF DAIRY MILKHOUSE WASTEWATERS IN MAINE By Robert A. Kostinec Thesis Advisor: Dr. Chet Rock
An Abstract of the Thesis Presented in Partial Fulfillment of the Requirements for the Degree of Master of Science (in Civil Engineering) May, 2001
Wastewaters from agricultural animal operations contribute large quantities of sediment, biochemical oxygen demand and nutrients to receiving waters. Due to this influent waste, the receiving waters are impaired and become unable to support their desired natural and society’s desired uses. Dairy milkhouse wastewater has been identified as a dominant agricultural source of nonpoint source pollution. Despite environmental authorities setting standards to address these discharges, the economic constraints of the dairy farmer make attaining of these standards difficult. Therefore, the continued development of inexpensive and sustainable waste management practices is required. One potential treatment alternative meeting these management requirements is a constructed wetland. They have proven to be effective in the treatment of wastewaters from both point and nonpoint sources. However, dairy milkhouse wastewaters generally present two characteristics that have not been readily studied with respect to constructed wetland use. This includes the fact that most dairies are located in the colder regions of
the country (U.S.A.),and their wastewater contaminate levels are many times stronger than those typically handled by applied constructed wetland technology (Newman et al.,
2000). In this study, a created wetland was used to treat the milkhouse wastewater runoff from a 350-herd dairy near Dover-Foxcroft, Maine. The main objectives of this project were to design, construct, and monitor the year-round performance of a constructed wetland and examine the removal efficiency on a seasonal basis to determine the influence of temperature on treatment capacity. In addition, the project was undertaken with the objective of producing a constructed wetland keeping capital and maintenance costs low, and utilizing a design reproducible by dairy farmers. Initial wastewater loading estimations were used to design the system. The dairy farmer volunteered time and equipment to construct and maintain a settling basin and a three-cell treatment wetland. Performance was evaluated using influent and effluent concentrations of TSS, VSS, BOD5, COD, Organic-N, ammonia-N, Nitrate-N, TP and Ortho-P. Following construction and startup of the system, it was discovered through more accurate sampling and flow measurements that the wetland cells were receiving 586 kg BODShdday. This was much more than the desired 75 kg BOD5hdday or the recommended 100 kg BODShdday loading rates. Due to this miscalculation the wetland was under sized at approximately one sixth the size necessary for secondary effluent treatment. Therefore, the design standards could not be fully analyzed due to incomplete treatment to secondary levels. In spite of this, several observations were made, and suggestions for future studies were provided. These recommendations include more detailed waste characterization, multiple settling basins, addition of nutrient specific
treatment components, and coordination of the system maintenance requirements with that of the farmer’s needs and abilities.
TABLE OF CONTENTS LIST OF TABLES ............................................................................
v
LIST OF FIGURES ...........................................................................
vi
Chapter 1. INT R O D U C T I O........................................................................ N
1
2 . LITERATURE REVIEW ...............................................................
4
2.1. INTRODUCTION..................................................................
4
2.2. WETLANDS ........................................................................
5
2.2.1. Types of Constructed Wetlands...........................................
5
2.2.2. Marsh Constructed Wetlands..............................................
7
2.3. Components of a FWS Constructed Wetland ..................................
9
2.3.1. Wetland Soil ..................................................................
9
2.3.2. Marsh Plants .................................................................
10
2.3.3. Marsh Microbes .............................................................
12
2.4. POLLUTANT PRESENCE AND REMOVAL.................................
13
2.4.1. Organic Matter Removal ...................................................
13
2.4.2. Solids Removal ..............................................................
14
2.4.3. Nitrogen .......................................................................
15
2.4.4. Phosphorus ....................................................................
17
2.5. CONSTRUCTED WETLAND DESIGN AND OPERATION............. 18 2.5.1. Liner ...........................................................................
11
18
2.5.2. Wetland Sizing Determination.............................................
20
2.5.3. Water Depth ..................................................................
21
2.5.4. Vegetation Planting and Establishment..................................
22
2.5.5. Cold Weather Effects ......................................................
24
2.6. DAIRY WASTEWATER TREATMENT ALTERNATIVES ...............24 2.7. SUMMARY.........................................................................
27
3 . MATERIALS AND METHODS.......................................................
29
3.1. SITE DESCRIPTION AND SELECTION .....................................
29
3.2. DATA COLLECTION AND ANALYSIS ......................................
29
3.3. WETLAND SIZING DETERMINATION ......................................
33
3.4. WETLAND CONSTRUCTION...................................................
35
3.5. SETTLING BASIN MODIFICATION..........................................
39
3.6. WETLAND CELL OPERATIONAL OBSERVATIONS ....................
43
3.7. RECALCULATION OF WETLAND SIZE.....................................
43
3.8. WETLAND SYSTEM WASTE TREATMENT RESULTS
CALCULATION....................................................................
45
4 . RESULTS ..................................................................................
47
4.1. TEMPERATURE RESULTS ....................................................
47
4.2. DISSOLVED OXYGEN RESULTS ............................................
47
4.3. pH RESULTS .....................................................................
50
4.4. TOTAL SUSPENDED SOLIDS (TSS) RESULTS ..........................
50
4.5. VOLATILE SUSPENDED SOLIDS (VSS) RESULTS .....................
54
...
111
4.6. BIOCHEMICAL OXYGEN DEMAND (BOD) RESULTS ................54 4.7. CHEMICAL OXYGEN DEMAND (COD) RESULTS .....................
58
4.8. NITROGEN TREATMENT RESULTS.......................................
58
4.9. PHOSPHORUS RESULTS......................................................
70
4.10. VEGETATION ESTABLISHMENT RESULTS ............................
70
4.11. CONSTRUCTED WETLAND COST RESULTS ...........................
75
5 . DISCUSSION .............................................................................
77
5.1. INTRODUCTION..................................................................
77
5.2. RECENT WETLAND STUDIES.................................................
78
5.3. SOLIDS (TSS and VSS) REMOVAL............................................
81
5.4. BOD5 AND COD REMOVAL....................................................
83
5.5. NITROGEN REMOVAL..........................................................
85
5.6. PHOSPHORUS REMOVAL ......................................................
87
5.7. COLD WEATHER EFFECTS....................................................
88
5.8. OVERALL OBSERVATIONS...................................................
90
5.9. DESIGN ALTERNATIVES.......................................................
91
6. CONCLUSIONS AND RECOMMENDATIONS...................................
95
6.1. CONCLUSIONS....................................................................
95
6.2. RECOMMENDATIONS...........................................................
98
REFERENCES ................................................................................
100
BIOGRAPHY OF THE AUTHOR ..........................................................
105
iv
LIST OF TABLES Table 2.1.
Emergent Plants Nutrient Storage And Uptake .........................
12
Table 2.2.
Recommended wetland loading rates ....................................
21
Table 2.3.
Environmental requirements of five commonly used constructed wetland plants ...............................................................
Table 3.1.
Frequencies of testing for each of the water quality parameters monitored .....................................................................
Table 4.1.
22
32
Projected costs for building the current constructed wetland assuming it was done by private contractors (1995 data) ............. 76
Table 5.1.
Constructed wetland and milkhouse wastewater studies ............... 79
Table 5.2.
Monthly Removal Efficiency Summary Table ...........................
V
80
LIST OF FIGURES 2.1 Plan and section views of (a) Free Water Surface and (b) Subsurface Flow Constructed Wetlands...........................................................
8
3.1.
Study Site Location Map ...........................................................
30
3.2.
Site Layout.............................................................................
31
3.3
Wetland cell layout: (a) Top View of wetland cells; (b) Cross-sectional view of a wetland cell with a weir ..................................................
36
3.4.
System profile view with settling basin ............................................
41
3.5.
Settling basin fullness...............................................................
42
4.1.
Water and average weekly air temperatures ......................................
48
4.2.
Dissolved oxygen levels .............................................................
49
4.3.
pH Levels .............................................................................
51
4.4. Effluent TSS and VSS concentrations.............................................
52
TSS Removal Efficiency .............................................................
53
4.6. VSS Removal Efficiency ............................................................
55
BOD Effluent Concentrations.......................................................
56
4.8. BOD Removal Efficiency ............................................................
57
4.9. COD Effluent Concentrations.......................................................
59
4.10. COD Removal Efficiency ...........................................................
60
4.1 1 . TKN in System.......................................................................
61
4.12 TKN Removal Efficiency ...........................................................
63
NH4 in System .......................................................................
64
4.5.
4.7.
4.13
vi
4.14
NH4 Effluent Concentrations.......................................................
65
4.15
NO3 in System........................................................................
66
4.16
NO3 Removal Efficiency............................................................
67
4.17
Total N in System....................................................................
68
4.18
Total Nitrogen (TN) Removal Efficiency.........................................
69
4.19
OP Effluent Concentrations ........................................................
71
4.20
Ortho-Phosphorus (OP) Removal Efficiency.....................................
72
4.21
TP Effluent Concentrations.........................................................
73
4.22
Total Phosphorus (TP) Removal Efficiency......................................
74
vii
CHAPTER 1
INTRODUCTION Wastewaters from agricultural animal operations contribute large quantities of sediment, biochemical oxygen demand and nutrients to receiving waters. Dairy milking parlor wastewater is an example of a dominant agricultural source of nonpoint source pollution (USEPA 1993). In modern societies the proper management of these wastewaters is a necessity and not an option. Environmental authorities require, through current standards, that wastewaters receive adequate treatment to meet effluent quality standards. These standards often times approach that of freshwater streams. However, animal waste management is tightly constrained by farm management economics. Therefore it is necessary to develop both inexpensive and sustainable waste management practices with low energy input requirements. Numerous best management practices are suggested and target animal waste problems. A more recent best management approach for purification of wastewaters is the use of constructed wetlands. Over 150 cases of constructed wetland utilization in the reduction of nutrients from municipal wastewaters has been documented (Reed and Brown, 1992). However, most of these have been utilized in southern areas or with wastewaters with low solids and organic levels. On the contrary, dairies are often found in the northern states and can produce wastewaters with very high solids and organic concentrations. It was reported that four of five leading dairy producing states are in the northern portion of the United States (USDA-NASS, 1999). Therefore, there is a need
1
to study the potential cold weather effects on the treatment capacity of contructed wetlands treating dairy wastewaters. In this study, a constructed wetland was used to treat the milkhouse wastewater runoff from a 350 herd dairy near Dover-Foxcroft, Maine. Like many of the smaller producers in the state, the farmers are interested in improving their waste management practices but face severe economic constraints. Therefore, there exists considerable interest in low cost waste management systems, such as constructed wetlands. For this study the dairy farmer volunteered time and equipment to construct a treatment wetland so that performance monitoring and evaluation of system performance and cold climate conditions could be undertaken. The main objective of the study was to test current engineered constructed wetland technology for the treatment of the high strength wastewaters produced by a dairy milkhouse under seasonal conditions. To accomplish this a constructed wetland system was designed and built. Both the design and construction of the system were planned with respect to the dairy farmer’s financial requirements and abilities to construct and maintain the system. The objectives of this constructed wetland project were as follows: 1. Design and build a constructed wetland system to effectively treat the milkhouse wastewater. 2. Monitor the year-round performance of a constructed wetland receiving dairy milkhouse waste.
3. Evaluate the effectiveness of constructed wetland system to treat milkhouse wastewater in a cold climate.
2
4. Recommend design modifications that may permit the treatment of high strength dairy cow waste in a cold weather climate, assuming positive results in the monitoring program.
3
CHAPTER 2 LITERATURE REVIEW 2.1. Introduction For much of the last several decades society has sought the cleanup, restoration and protection of natural water resources. This occurred following the obvious declines with time in the quality of the water resources. Initial efforts were geared towards the larger industrial and municipal pollution generators whose point discharges were highly visible and the environmental impact directly evident. Due to the large quantities generated and revenue generally available to these sectors the development of large-scale treatment systems (i.e. activated sludge, clarifiers, filtration systems, etc.) were both necessary and financially feasible. As the regulatory and technological advances began to control the output from the larger polluters, it became more apparent that the smaller non-point source polluters remained substantial contributors to the deterioration of aquatic environments. Applications of the large and expensive systems were not always financially feasible and oflen times not technically applicable for use on non-point source or small quantity waste water generators. This sparked the quest for more inexpensive systems and technologies requiring fewer operational and maintenance needs. An area explored was the use of “natural” systems as treatment systems. One reason for the use of natural systems is that many of them are able to withstand fairly adverse and fluctuating conditions through the adaptations of the biological plants and organisms and their regeneration abilities. A particular natural system that has, and continues, to receive much attention is wetlands.
4
2.2. Wetlands Wetlands are one of many aquatic systems where the major factor controlling the environment and the associated animal and plant life is water. By definition of the U.S. Fish and Wildlife Service, wetlands are those areas that exist between the upland and the aquatic environments. They consist of the transitional habitats where the water table is at or near the surface of the land and includes areas that have shallow water over land, up to a depth of 2 m (6 fi) (Niering, 1987). The vegetation is dominated by hydrophytes, water loving plants, which can live in frequently saturated areas. Soils associated with these habitats are at least temporarily if not continuously covered by water, which produces anaerobic conditions within the soil column. These anaerobic conditions are the main limiting factor in the survivability of the plant species within these systems. Constructed wetlands are different from natural wetlands in that they are designed, built and operated for human use and benefit. They are constructed in areas where a wetland did not exist before. Thus, through the designing and building, one is able to maintain significant control over the substrate, vegetation and hydraulic regime in the wetland. In controlling these parameters correctly, one is able to engineer the wetland to effectively perform wastewater treatment tasks. Additional benefits of constructed wetlands may include providing habitat for wildlife, producing an aesthetically pleasing environment, as well as modifying the local hydrology. 2.2.1. Types of Constructed Wetlands
Wetland is a general term that is often used when referring to three very different systems. This term often includes environments such as swamps, bogs, and marshes. They can be distinguished from one another by their specific hydrologic, nutrient and
5
substrate conditions (Guntenspergen et al., 1989) as well as the vegetation that occurs within each. Vegetation offers the most obvious means of distinguishing between the different types of wetlands. Swamps are marked by the presence of vegetation in the form of water-tolerant trees, shrubs, and various other types of woody vegetation. Bogs on the other hand are wetlands dominated by acid-tolerant mosses that generally depend upon stable water levels that are acidic and low in nutrients (Hammer and Bastian, 1989). And then there are marshes with emergent vegetation such as cattail (Typha), bulrush (Scirpus), sedges (Carex), and reeds (Phragmites). Each of the wetland types, discussed above, has been used for wastewater treatment. Therefore, one of the first decisions to make when considering the use of constructed wetlands is the choice of the wetland type. This decision involves a consideration of the environmental conditions required to treat the given wastes as well as the feasibility of the wetland being successfully constructed and operated. From these standpoints, bogs and swamps often present more difficulty in constructed wetland application, as compared to marshes. Bogs dominated by mosses have been found to be hard to establish as well as difficult to operate for various pollutants. Operational difficulties stem from the bog's limited adaptability to fluctuating water and nutrient loading levels (Kadlec, 1988). In considering a swamp, its major setback is a required 520 year time period for development and full operational performance (Hammer and
Bastian, 1989). On the contrary, marshes are better adapted to fluctuating water and nutrient levels as well as having greater tolerance of high pollutant concentrations. Furthermore, marshes have a great ability to inhabit a tremendous variety of soils,
6
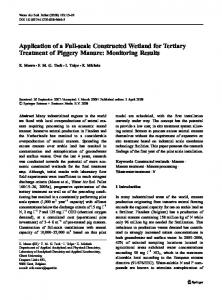
climatic and water quality conditions. Therefore, most constructed wetlands for wastewater treatment emulate marshes (Hammer and Bastian, 1989). 2.2.2. Marsh Constructed Wetlands When considering a marsh constructed wetland, there is also the choice of what type of hydraulic flow regime to use. The two types that are commonly used include the free water surface (FWS) and the subsurface flow (SF) wetlands (Figure 2.1). In a FWS constructed wetland, the wastewater flows at a shallow depth through the emergent vegetation. Downward flow of water into the soil is prevented by the presence of an impermeable layer. This layer separates the wetland basin from the natural soil by the installation of an artificial barrier. With a subsurface flow constructed wetland the objective is to have the wastewater pass through the substrate of the wetland. These systems consist of substrate made up of a permeable medium, often sand and gravel, which allows the wastewater to flow laterally through the medium. One of the reported advantages of this system is the decreased potential of odors and mosquitoes due to subsurface flow (Reed et al., 1988). Construction costs for the two marsh systems are different. Reed and Brown (1992) surveyed 37 constructed wetlands and found that subsurface flow wetlands often have a higher construction cost due to the required permeable substrate acquisition and placement. The average costs found were $55,00O/ha ($22,OOO/ac) for FWS systems as opposed to the $215,00O/ha ($87,00O/ac) SF systems. However, when figured on a unit flow basis, the cost advantage went to the SF concept because of the smaller size required. Average cost reported for FWS systems was $206/m3($0.78/gal) and for SF systems $163/m3 ($0.62/gal).
7
Low Permeability
I
I
...................................................
$*
-w
$
Coarse Gravel Bed Media
’*‘w
...............b
............... b
$ *$
~
............
*
I
.........
..........
............................ ............................ .. .. ..........b j............ i
I -
Figure 2.1. Plan and section views of (a) Free Water Surface and (b) Subsurface Flow Constructed Wetlands.
S
+
;;..Id
. .
.......... .......;
Outlet and Depth Control
Impervious
I
. .
In their survey of constructed wetlands, Reed and Brown (1992) also found that a significant number of SF systems were experiencing surface flow. The cause of this surface flow is perceived to be the clogging of the voids in the media with organic andor inorganic material. If this clogging exists, the perceived advantages of a SF concept are negated as one is left with a F W S wetland system. Further indication of the concern over the effectiveness of SF systems is given in a report by Krider and Boyd (1992) in which they gave justification for the USDA Soil Conservation Service technical requirements for constructed wetlands in agricultural wastewater treatment. One of these requirements was that SF type systems were not to be used until research demonstrated their long-term effectiveness. Hence, in this study the term wetland will only refer to F W S systems.
2.3.
Components of a FWS Constructed Wetland
Reed et al. (1988) lists four major system components of a constructed wetland. This includes the plants, soils, bacteria, and animals. They go on to say that the function and the system performance, are influenced by water depth, temperature, pH, and dissolved oxygen concentration. The following discussions will use the term “wetland” to represent FWS wetlands. 2.3.1. Wetland Soil
Substrates in wetlands provide physical support for plants, attachment sites for microbial populations as well as a reactive surface for complexing anions, ions and various compounds. Both the physical and chemical attributes of soils can vary widely and are important to consider in construction and operation of constructed wetlands.
9
Because of the saturated conditions of wetland substrate, it is dominated by anaerobic (reducing) conditions (Faulkner and Richardson, 1989). 2.3.2. Marsh Plants Wetland plants function in two important ways. The stems and leaves extending through the water column provide a large surface area for the attachment of microbial populations. Another function is in the way the plants transport gases to and fiom the roots and rhizomes in the wetland substrate. The wetland plants function in several ways to treat wastewater. Transferring of oxygen to the root zone plays a major role. Roots have been found to "leak" oxygen to the nearby soil thus creating a thin-film, aerobic region, in an otherwise anaerobic substrate, capable of supporting aerobic microbes. These aerobic microbial populations are capable of modifying trace organics, nutrients, and metallic ions. The by-products produced by the aerobic microbes are easily utilized by many of the anaerobic microbes located in the saturated soil, away from the aerobic thin film. (Gunderspergen et al., 1989) The water column and plants work together, both above and below the water surface, to provide water treatment benefits. Leaves and stalks above the water provide a canopy of shade, which functions to limit sunlight penetration. This shading tends to control alga growth by limiting light penetration to the water surface where they grow. If allowed to establish, the algae could deter oxygen transfer to the water column at the water-atmosphere interface (Tchobanoglous and Burton, 1991). Additionally, the shading effect of the plants has been found to decrease the water temperature in the summer (Tanner et al., 1995). Furthermore, the vegetation in the water column provides
10
a substrate for attached microbial growth. The vegetation also provides a means of venting the gaseous byproducts of anaerobic decomposition in the subsoil via their internal aeration system or aerenchyma (Tanner et al., 1995). Guntenspergen et al. (1989) reports that wetland vegetation may retard water flows and in doing so cause reductions in suspended solids. He further states that the emergent vegetation reduces the water volume due to high transpiration rates of the plants.
In a survey of constructed wetlands, Reed an Brown (1992) found that the most common types of vegetation used were cattail (Typha),bulrush (Scirpus), and giant reed
(Phragmites). They also reported that Phragmites seemed to offer some treatment advantages over the other two, however it provided little or no habitat or other ecological benefits. Furthermore, their survey found that one third of the FWS systems used only cattails. Hammer and Bastian (1989) report that these three commonly used constructed wetland plants have a tendency to create and/or maintain a single-species wetland environment by out-competing or inhibiting other plants. Selecting the correct plant will depend upon the climate and the goal of the wetland. The plant species selected must be capable of surviving the climatic conditions where the constructed wetland is to be used if yearly plantings are to be avoided. If a goal of the constructed wetland is to remove nutrients one must consider the ability of the plant species to uptake and store the nutrients of interest. The storage ability of the plant relates to the amount of a particular nutrient that can be accumulated during a growing season, and therefore could be removed from the system if harvested. If frequent harvesting is to be considered, then the uptake capacity gives some indication as to the rate at which nutrients can be taken up by the plant, and at what frequency
11
harvesting should be considered. Reddy and DeBusk (1987) have studied the storage and uptake capability of four common emergent macrophytes, and the results found for nitrogen and phosphorus are given in table 2.1. Their findings indicate that cattail (Tvpha spp.) had the greatest potential for storage and uptake of both nitrogen and phosphorus.
Furthermore, the findings indicate more than 50% of nutrients were stored in below ground portions of the emergent plants. This was attributed to emergent plants having more below ground than above ground supportive tissue. The below ground plant tissue has a greater potential for storing the nutrients over a longer period. Therefore, there is a decreased necessity to conduct frequent or annual harvesting of plant matter in order to achieve nutrient removal.
EMERGENT PLANTS
Juncus (rush) Scirpus (buIrush) IPhraarnites (reed)
I
200-300 175-530 140-430
I
800 125 225
I
40 40-1 10 14-53
I
110 18 35
Table 2.1. Emergent Plants Nutrient Storage and Uptake. (Reddy and DeBusk, 1987)
2.3.3. Marsh Microbes The component of the wetland system contributing considerably to the decomposition of pollutants comes from the wetland microorganisms. Some of the groups of microbes noted include bacteria, fungi, algae, and protozoa (Hammer and Bastian, 1989). Contaminants are altered by these organisms to obtain nutrients or energy to carry out their life cycles. Seeding or transplanting of these organisms in constructed wetlands is generally not necessary as they are ubiquitous and naturally occurring in most waters (Hammer and Bastian, 1989).
12
2.4. Pollutant Presence and Removal
Various nutrients are required by the biological organisms and plants of a natural aquatic system to survive. These same nutrients, if present in high levels, produce unstable environmental health conditions. Therefore, treatment mechanisms within constructed wetlands can play an important role in wastewater treatment. Two nutrients often in need of removal are nitrogen and phosphorus. Other pollutants typically in need of removal from wastewaters, in order to protect the receiving aquatic systems, include the organic matter and solids. These pollutants are removed in wetlands through a combination of physical, chemical and biological mechanisms. Discussions concerning the treatment mechanisms present in constructed wetlands follow. 2.4.1. Organic Matter Removal
Excessive organic material in a natural aquatic system is often detrimental to the system’s stability. This is due to the fact that it is used as food by aquatic organisms. During the utilization of the organic matter, dissolved oxygen in the water column is consumed. This activity can limit the availability of dissolved oxygen for the larger aquatic organisms that require the dissolved oxygen for their survival. When measuring the oxygen demand put on a water body by the organisms from organic matter consumption the standard test used is referred to as carbonaceous biochemical oxygen demand (BOD). The reduction of this BOD level is usually a requirement for waste waters before they may be discharged to the environment. The BOD entering a constructed wetland will be both soluble and insoluble. Insoluble forms and settable BOD may be quickly removed fiom the water column by the physical mechanisms of sedimentation and filtration. Once settled to the bottom, the
13
solids may be stored until consumed by the aquatic organisms. Both insoluble and soluble BOD may be removed from the water by coming into contact with substrates covered with aquatic microorganisms. Within a wetland, the vegetation extending through the water column can produce significant amounts of surface area for these organisms to grow. Tanner et al. (1995) reported the importance of the presence of wetland plants within the water column in a study. Findings showed that planted wetlands had greater removal of total BOD than unplanted wetlands, particularly when higher BOD loading rates were used in the wetlands. Chemical oxygen demand (COD) measures the oxygen equivalent of the organic matter that can be oxidized chemically. The COD levels are generally higher than the BOD as more compounds can be chemically oxidized than can be biologically oxidized. However, for many wastes it is possible to correlate the COD with BOD (Tchobanoglous and Burton, 1991). Tanner et al. (1995) found just such a correlation in studying constructed wetland effluent. This can be useful since the COD test takes three hours to perform as opposed to five days for the BOD. 2.4.2. Solids Removal Total Solids (TS) in wastewaters is made up of both the suspended (TSS) and dissolved solids (TDS). The Total Suspended Solids (TSS) are composed of settable matter, floating matter and colloidal matter. (Tchobanoglous and Burton, 1991) The organic portion is referred to as Volatile Suspended Solids (VSS), and its measure gives an indication of the amount of organic material in suspension and available for biodegradation. The presence of solids within the water column decreases the light
14
penetration through the water column. This affects the aquatic organisms that require light for photosynthesis. The removal of TSS is primarily accomplished via settling. The process is accelerated by more quiescent conditions. Within a wetland system the quiescent conditions are enhanced by the presence of the emergent vegetation (Johnston, 1993). Tanner et al. (1995) found in his wetland studies that TSS removal rates were not a function of hydraulic or solids loading, but appeared to be related to the detention time. Dissolved solids removal in a wetland is accomplished by microorganisms adsorbing and/or absorbing them and breaking them down to obtain energy. 2.4.3. Nitrogen Within dairy wastewaters, nitrogen can be found in a variety of forms because of the various oxidation states it can take. Its form may often change from one to another if subjected to different physical and biochemical conditions of the water. One form of nitrogen that is of particular interest is ammonia. At high concentrations it is toxic to many fish and other aquatic organisms. Additionally, since it can be oxidized further it can produce a significant oxygen demand on a body of water. Generally, nitrogen in dairy wastewaters are initially in complex organic compounds originating from milk waste, bedding material, and feces, as well as in the ammonium ion (NH4') from urea. Organisms utilize the organic compounds, but are unable to oxidize the nitrogen from the organic material. Instead, the organic nitrogen is released as NH4'. The fate of NH; in aqueous environments is its utilization by nitrifying bacteria as a source of energy as shown in the nitrification equation 2-1 below.
15
During the nitrification process, oxygen in the water is utilized and creates what is called a nitrogenous biochemical oxygen demand (MOD). (Davis and Cornell, 1991)
Nitrification:
NH4'
Denitrification: NO3'
+ 202 + No3- + H20 + 2H'
( 2-1)
+ N02- + NO + N20 +Nz
(2-2)
The resulting nitrate (NO3-)produced during the nitrification process may be further broken down into various other nitrogen compounds during the denitrification process (equation 2-2) being conducted by different aquatic organisms. During denitrification the nitrate is reduced eventually to one or more of the gaseous nitrogenous compounds shown. Each of these gaseous byproducts may be released to the atmosphere through volatilization and thereby removing the nitrogen from the wastewater. It has been found that several environmental conditions can affect the rate of one or more of these nitrogenous conversion reactions. One of the factors limiting the removal of nitrogen from the wastes is the opposite oxygen requirements of the nitrification and denitrification processes. As opposed to the nitrification process requiring oxygen, the denitrification process is suppressed by the presence of oxygen. The oxygen suppresses the enzymatic system of the denitrification organisms, therefore, this process often occurs most efficiently in anoxic areas. (Tchobanoglous and Burton, 1991). The opposite requirements of the two processes are met within the benthic portion of the wetland due to the presence of the plant roots. Reed and Brown (1992) reported that the roots of the aquatic plants leaked oxygen into the nearby benthic soils. What this creates is an environment where aerobic and anaerobic environments are in close proximity. Therefore, the aerobic nitrification byproducts may
16
pass to the anoxic environment via a concentration gradient. In the anaerobic environment the denitrification organisms will produce the gaseous byproducts that are capable of passing through the aquatic environment and into the atmosphere. Kadlec and Knight (1996)have reported the rate of ammonification to be lower when hydrogen ion concentrations are outside of the pH range of 6.5 to 8.5.They also report finding that temperature has a large effect on ammonification rates as well. Ammonification rate constants were reported to double with a 10°C (18OF)increase in temperature. In contrast, the temperature effect is not found to be highly inhibitory for the denitrification process. Stengel and Schultz-Hock (1989) found in laboratory studies that significant denitrification could occur at temperatures as low as 5OC (41"F),as well as within the 2-8°C (3546°F)temperature range provided sufficient carbon was available and DO levels were below 2-3 mg/L. Another means of nitrogen reduction in wetlands is through the aquatic vegetation. The aquatic vegetation takes up nitrogen and incorporates it into plant material, thereby suggesting the harvesting of the vegetation as a means of removing nitrogen. However, these same studies (Gersberg et al., 1986;Herskokwitz et al., 1987) also suggest that the harvesting would only account for 10% or less of the nitrogen removal for the wetland system. 2.4.4. Phosphorus
Phosphorus sources to water systems are primarily through its release from rocks containing phosphorus or through wastewater inputs. The process of phosphorus exchanging between the sediments and water is dependent upon several factors acting separately or in combination. Some of the more important factors include: lower
17
dissolved oxygen levels causing phosphorus to be more soluble; water exchanges over or near the source, as it affects diffusion and transport; temperature, through its effect on microbial activity; pH; and the relative fractions of phosphorus in the sediment bound with inorganic and organic matter (Welch and Lindell, 1992). Phosphorus is commonly the limiting nutrient in most aquatic systems. Therefore, when sufficient amounts of phosphorus are available to aquatic plants their growth becomes almost limitless. This extensive growth produces such conditions as increased plant matter buildup and dense algae mats, which ultimately lead to accelerated eutrophication and oxygen depletion of surface waters.
Forms of phosphorus in the environment are numerous. Analysis of wastewater for phosphorus commonly includes orthophosphate (OP) and Total Phosphorus (TP). OP is a phosphorus analysis for the forms available for uptake, while TP analysis determines all sorbed and complexed inorganic and organic phosphorus (Welch and Lindell, 1992). Removal of phosphorus in a wetland system occurs as a result of adsorption, complexation, and precipitation. Limitations for its removal in a free water wetland system are reported to occur because of a limited amount of contact opportunities between the wastewater and the soil (Reed et al., 1988). Aquatic plants in a wetland system do take up some phosphorus, however this is not the major removal process (Tchobanoglous and Burton, 1991). 2.5. CONSTRUCTED WETLAND DESIGN AND OPERATION
2.5.1. Liner One of the determinations to be made in designing a constructed wetland is the need for an artificial liner. Primarily the liner serves to prevent migration of wastewater
18
from the constructed wetland cells into the groundwater below (Steiner and Watson, 1993). The liner may be a heavy-duty synthetic membrane, or compacted soil. Several types of synthetic liners are commercially available. The major drawback to synthetic liners is the added expense of purchasing and installing these materials during wetland construction. Generally the most economical choice is to produce a liner by compacting the onsite soils, especially low permeability clays. If they are not naturally occurring at the site, it may be required to bring some appropriate soils on-site. The types and soils that may be suitable for liner materials may be expanded due to recent studies. Several investigations have been conducted on the seepage below earthen catchments used to collect feed yard runoff. These reports found that the wastes in the runoff effectively reduce seepage. It was found by Davis et al. (1 973) that when a sandy loam was inundated with liquid dairy cattle wastes for a 4 month period, infiltration decreased from 122 c d d a y to 0.5 c d d a y . Biological activity in the presence of high organic matter concentrations was concluded to be the primary mechanism of sealing the soil. In another study by Chang et al. (1974) soil hydraulic conductivity decreased quickly in soil columns recovered from the bottom of holding ponds. They reported the mechanism responsible for this is the physical entrapment of suspended particles in soil, followed by microbial growth that completely sealed the soil from the water movement. Clark (1 975) studied water seepage and movement of chloride, nitrate and nitrite below holding ponds with soil treatments of clay and bentonite. His findings included seepage rates too low to measure, and only increases in chloride content in the groundwater. Reaves et al. (1 9 9 9 , in their study of a free water constructed wetland used to treat swine lagoon effluent,
19
found that compacted soils had no detectable movement of water into the groundwater in the second year of operation. Therefore, their research shows that a wide variety of earthen basins, when exposed to high organic wastes, become sealed due to the biological growth encouraged by the presence of the high strength wastes. 2.5.2. Wetland Sizing Determination
One empirical means of determining the wetland surface area required for a wastewater is given by Hammer (1989). By studying typical constructed wetlands used to treat agricultural wastes, he derived simplified equations. Hammer's sizing standards are determined by the formulas 2-3 and 2-4 given below.
Wetland Surface Area (ha)
=
Organic Load (Kg BODJday) Loading Rate ( Kg BOD,/ha/day)
(2-3)
Where: OrganicLoad = (Kg BODYday)
Flow (L/day)
BOD,conc. (mg/L)
0.000001 (Kg/mg)
(2-4)
The organic load is determined by evaluating BOD, produced by the dairy. As for the loading rate, Hammer gives two temperature dependent values for secondary treatment of BOD, (i.e. 30 mg/L). If the wetland is to be located in a temperate region, with a limited number of days with temperatures below zero degrees Celsius, Hammer (1 989) indicates a loading rate of 200 kg BOD~/ha/day.If, however, the wetland is in colder regions he suggests a loading rate of 100 kg BOD&a/day. The use of these loading rates also assumes that the wastewater has a BOD,:TKN:P ratio of 100:10:1. This ratio is typically found in livestock and municipal wastewaters (Hammer, 1989). A table of Hammer's recommended loading rates for BODS,TKN, and TP is given in Table 2.2.
20
2.5.3. WATER DEPTH Water is a necessary component of wetland operation. It has been shown that the depth of water within the wetland can cause changes in the wetland conditions and plant life. Re-aeration of constructed wetland waters is necessary to support treatment activities. Reed et al. (1988) explains that to ensure adequate re-aeration throughout the water column a water depth of 60 cm (24 in.) or less should be used. A dense stand of vegetation reduces the wind-induced water turbulence and mixing at the surface and decreases this mechanism of re-aeration. In the establishment of wetland plants in constructed wetland systems, one generally chooses a particular aquatic plant based upon the needs of the system. The manipulation of the water levels within a wetland can be used to control growth and spread of unwanted plants. Examples given by Allen et al. (1989) include the control of cattail growth by applying deep flooding conditions for several weeks following the plants being cut during the growing season. Another example included flooding to control other undesirable opportunistic species that take up large areas but provide little organism attachment surface area.
Wastewater Parameter BOD5 TKN TP
1-111---*-11
Cold Regions LKg/h a/day) 100 10 1-1.5 I
1-1
*-I-
Warm Regions (IKI!ha / d g*-) 200 20 1-1
2-3
Table 2.2. Recommended wetland loading rates (Hammer, 1989)
21
Water depth adjustment may be required in cold regions where ice formation is possible. Ice formation may decrease the actual flowing depth of water under the ice and decrease the retention time of the water, thereby decreasing treatment success. By raising the water levels during ice formation one can account for the ice and retain the necessary water retention times. (Miller, 1989) 2.5.4. VEGETATION PLANTING AND ESTABLISHMENT Plant selection plays an important role in the initial step towards vegetation establishment. The U.S. EPA (1988) has compiled some information on the environmental requirements of the five major vegetation types used in FWS constructed wetlands (Table 2.3). Therefore, if a wastewater will contain extreme salinity or pH levels the vegetation can be picked accordingly.
Common
Scientific
Desirable Temperature Range
Seed Germination
Maximum Salinity Tolerance
Effective PH Range
Table 2.3. Environmental requirements of five commonly used constructed wetland plants. (U.S. EPA, 1988) Another general consideration in vegetation selection is the availability and cost. Allen et al. (1989) discussed that nurseries can supply vegetation in the form of a potted plant or seedling and he also provided some information concerning price. Plants averaged around $1.OO per plant to $0.25 per seedling. To this cost must also be added
22
the cost of shipping. Allen et al. (1989) also recommended that plants be selected from more local wild stock so that the plants are more adapted to the local climatic conditions. Furthermore, the use of local nurseries decreases the handling time stress. Consideration must also be given to the best time of the year to obtain and plant the aquatic vegetation. It has been reported that the most successhl time of the year for establishing plantings is in the early spring (Allen et al., 1989). Others (Steiner et al., 1991) have reported this time to extend from early spring until early fall. If fall planting is selected, the planting should be conducted at least two weeks prior to the early frost date to decrease winter mortality. To produce sufficiently high plant establishments during initial plant growth it has been recommended to plant aquatic plant rhizomes in densities of 1l/sq meter (Dobberteen and Nickerson, 1991). Following the planting, the actual startup time of the constructed wetland system is critical. There is an initial growth period before the wastewaters can be applied. To avoid shocking the plants, Steiner et al. (1991) recommends a h l l growing season, if possible. If this is not practical then at least four to six weeks are recommended. During the plants initial growth it is important to maintain the water level such that the roots are in the water and part of the plant stock is above the water surface. Due to the popularity of the use of cattails there is much information concerning their planting and establishment. Crites et al. (1988) report that cattails produce a dense stand within three months if rhizomes are planted at 1-m intervals. He further reports that they are easy to propagate and thrive under diverse environmental conditions thus making them the ideal plant species for constructed wetlands.
23
2.5.5. COLD WEATHER EFFECTS In the application of constructed wetland technology, it is imperative that the climatic conditions be taken into account. Freezing temperatures in northern areas have presented problems with constructed wetlands treating animal wastes. Reaves et al. (1995) found that their wetland cells froze solid during much of the winter, thus eliminating the microbial treatment of the wastewater. Their suggestion was to store the wastewater until warmer weather. However, others have found solutions to the ice problem. For example, a constructed marsh in Ontario Canada is used year round to treat municipal lagoon effluent (Herskowitz et al., 1987). In this wetland the short-circuiting caused by ice blockages was treated by raising the water levels to greater than 30 cm prior to the onset of winter. Freezing and short-circuiting aside the ice formation causes other problems. When freezing conditions produce ice formation that persists for more than a few days, the depletion of oxygen in the system is a possibility because of the reduction or prevention of surface re-aeration (Reed et al., 1988). This reduction was also reported by Herskowitz et al. (1987).
2.6. DAIRY WASTEWATER TREATMENT ALTERNATIVES Milking center wastewater is composed of excreta and bedding material washed from the parlor floor with high pressure hoses, waste milk, and milking equipment cleaning water that consists of detergents, acid and alkalizing agents, and sanitizers (Tanner et al., 1995). Perle et al. (1995) reported that the milk contributes a greater organic load due to milk contributing lactose, fats and proteins. Hammer (1993) stated that raw livestock wastewaters typically contain 2000-4000 mg/L BODS,300-500 mg/L
NH3,and 75-150 mg/L total P. Because milking center wastewaters consist of high
24
concentrations of organic and nutrients in combination with less soluble fats, the treatment options can be limited. Numerous means of treating dairy wastes are suggested in the literature. Wide dispersal of milking center wastewater onto agricultural land is a common method of reducing its pollution potential. However, the dispersal practice may be too costly for some dairy operations due to the expenses associated with storage, transportation and spreading over a large area of land (Holmes et al., 1995). Furthermore, this practice may not be suited for all soils due to the composition of these wastes. The high levels of organic biosolids may cause soil fouling in the land treatment areas (Holmes et al., 1995). Brodie (1989) suggests the possibility of dealing with solid manure wastes together with the milking parlor wastewater. In this method the parlor wastewater is added to solid manure wastes to create a wastewater capable of being land applied by means of an irrigation system. This has the benefit of returning nutrients back to the soil. A drawback of the procedure is that the irrigation is not possible during winter months and therefore would require winter storage. Schwer and Clausen (1989) applied vegetative filter strip technology to dairy milkhouse wastewater produced at a Vermont farm. Favorable results were obtained with retention of 95% total suspended solids, 89% total P, and 92% total Kjeldahl N on a mass basis. Despite the high reductions the effluent exceeded values expected for agricultural watersheds and effluent standards for wastewater treatment systems. Agricultural wastes have been applied to wetlands with reported successes. Although constructed wetlands have been used to treat dairy wastes, the technology had only been applied to dairy waste with considerable pretreatment including two-stage
25
oxidation pond system (Tanner et al., 1995); lagoon (Benham and Mote, 1993); and anaerobic and aerobic lagoons (Ulmer et al., 1992). In each of these reports the dairy waste received primary to secondary treatment before being applied to the constructed wetland. These more conventional treatment methods generally have more substantial capital costs, and maintenance and operational requirements than constructed wetlands. This may be of some disadvantage to farmers who may not have the labor or capital needed for the more traditional systems. Interest in the treatment of dairy milkhouse wastewaters using primarily constructed wetlands has just more recently been investigated and reported. Newman et al. (2000) conducted one of these studies in 1994. This study was conducted at the University of Connecticut’s Storrs campus using three constructed wetlands in parallel. Wetland vegetation used in the study utilized cattails (Typha angustifolia), common reed (Phragmites australis), and three-square bulrush (Scirpus pungens). In this study, they
did not meet treatment objectives due to undersizing of the wetland. Their wetland sizing was based upon an assumed BOD5 value, as found in an agriculture waste management handbook. Another study that utilized constructed wetlands for the treatment of milkhouse wastewater was conducted between 1995 and 1997, in Frederick County, Maryland. In this study, the milkhouse wastewater was collected with barnyard runoff for treatment in two parallel wetland cells. The cells were planted with either cattails (Typha latifolia) and Schoenoplectus tabernaemontani. The Schoenoplectus later died and the cells were colonized by Lemna minor L., and Echinochloa crus-galli. They reported favorable results for all contaminants except for nitrate-nitrogen.
26
One more study to be discussed later includes the study done by Oldfield (1996). In her study, she used the wetland constructed for this study along with a newly constructed lagoon to treat the milkhouse wastewaters. Her study provided a comparison of two technologies side by side treating wastewaters from the same source. These more recent studies, in which milkhouse wastewaters were treated, will be discussed later along with this study.
2.7. SUMMARY Studies and actual applications of constructed wetland technologies have demonstrated that they are capable of providing viable treatment to wastewaters in warmer climates and with dilute wastestreams. These same studies also mention that no single design fits for all waste sources. The various adaptations in system designs can be best attributed to the unique characteristic and sources of the wastewaters that are being treated. Studies utilized various initial collection and treatment methods to prior to accommodate the to mention that no single design fits for all waste sources. These shortfalls are only overcome by various adaptations to the general design. This can be attributed to the complexities of the interdependent relationships between organisms and physical processes at work in the wetland. The literature discusses numerous means of treating and disposing of dairy wastewaters. Methods and technologies discussed consisted of large and or expensive primary and secondary treatment systems. This was particularly true when pretreatment was utilized before wastewaters were applied to treatment wetlands. Due to this attempts are continuing to be made to apply various treatment technologies to dairy wastes with some success. Although these technologies are somewhat successful, their successes can
27
be partially attributed to the applying the more expensive and conventional primary and secondary treatment technologies prior to discharging to a constructed wetland system. In applying the application in this way some of the more needed and desired qualities of a wastewater treatment system are not provided. Those desired qualities would include things such as low capital cost, low operation and maintenance requirements, andor lack of reliance on machinery and energy inputs. Based upon the literature review it is apparent that the following areas could use additional research: (1) Applying constructed wetland technology to high strength and more complex organic waste loads such as may be found in dairy wastewaters, and (2) Application and design criteria for constructed wetlands in cold climate regions.
28
CHAPTER 3 MATERIALS AND METHODS
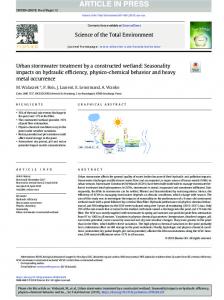
3.1. SITE DESCRIPTION AND SELECTION The site chosen for the constructed wetland was located on a dairy farm in the Piscataquis River Watershed in north-central Maine, 5 kilometers (three miles) east of Dover-Foxcroft (Figures 3.1 and 3.2). This particular site was chosen because of the dairyman's interest in the project and the construction equipment, labor, and land he would provide for the creation and maintenance of the constructed wetland. 3.2. DATA COLLECTION AND ANALYSIS To evaluate the effectiveness of the Constructed wetland in treating the wastewater several waste constituents were measured. Data collection included the measurement of wastewater samples for total suspended solids (TSS), volatile suspended solids (VSS), five day biochemical oxygen demand (BODS),chemical oxygen demand (COD), ammonia-nitrogen (NH+ nitrate-nitrogen (NO3), total kj eldahl nitrogen (TKN), total phosphorus (TP), ortho-phoshorus (OP), pH, dissolved oxygen (DO), and water temperature. Field measurements for DO were conducted with an Orion Dissolved Oxygen Probe, while pH and water temperature measurements were conducted using a Piccolo pH Stick Meter. Other wastewater parameter testing was conducted at the University of Maine. Chemical analyses, sample preservation and holding times were performed in accordance with Standard Methods (APHA, 1992). The frequency of wastewater analysis is given in Table 3.1. Generally, weekly sampling was conducted except for TKN, TP, and OP due to
29
Figure 3.1. Study Site Location Map (Morris, 1976)
30
Manure Storage Pit
Barn and Milking Parlor
I
7 Dover-Foxcroft
I
Figure 3.2: Site Layout
31
:digentation Wetland Cells Not to Scale
Water Tests
IIDH I Dissolved Oxygen (DO) Temperature NH4-N N03-N TKN-N Total Phosphate (TP) Ortho Phosphate (OP) BOD5 COD Total Suspended Solids (TSS) Volatile Sumended Solids (VSS)
Weeklv Weekly Weekly Weekly Weekly Monthly Monthly Monthly Weekly Weekly Weekly Weeklv
Weekl; Weeklv Weeklv
1
11
Table 3.1. Frequencies of testing for each of the water quality parameters monitored. the cost of their analysis. These samples were analyzed at the Sawyer Research Center water laboratory, located at the University of Maine. Water collection for analysis was conducted by either grab samples or by a composite sampler. Grab water samples were taken at each of the downstream weirs in the wetland, with these samples representing the effluent water quality of the wetland cell above. A decision to include flow based composite samples in the analysis came about after a Sigma 8OOSL composite sampler became available in the spring of 1994. With this equipment 24 hour composite samples were collected on a flow weighted basis. Samples were preserved during the 24 hour period in glass containers surrounded by ice within the sampler.
32
3.3 WETLAND SIZING DETERMINATION The initial step in the project development was determining the quantity of wastewater discharged and the level of BOD, in the wastewater. This was accomplished using limited initial sampling consisting of flow based composite samples and manual tip-bucket collection. In this procedure 20 liter buckets were used to collect the effluent from the dairy discharge pipe. From each full bucket a 200 ml sample was taken and the bucket was emptied and used for additional sampling. All 200 ml samples were composited in one bucket for each milking session. From this composite sample representative sub-samples were collected for laboratory analysis. Samples were taken during milking sessions on four different dates and consisted of two morning sessions and two afternoon sessions. The resulting wastewater discharge was determined to have a flow of 1900 liters per day (500 gal/day) and a BOD, concentration of 1500 mg/L. Using these values and a conservative waste application rate of 75 Kg BOD,/ha/day, as opposed to the recommended 100 Kg BOD,/ha/day (Hammer, 1993) for use in winter applications the wetland size requirements were determined. The more conservative application rate was used due to the wastewater not receiving pretreatment. Calculations were as follows: WETLAND DESIGN CALCULATIONS Flow (L/day)
Organic Load = (Kg BODS/day) Organic Load
=
Wetland Surface Area (ha)
BOD5conc. (mg/L)
1900 L/day x 1500mg/L x =
(Equation 3.1) (Kg/mg) Kg/mg
=
Organic Load (Kg BOD,/day) Design Loading Rate ( Kg BOD,/ha/day)
33
2.85 KgBOD5/day
Wetland Surface Area (ha)
=
2.85 (Kg BODS/day) 75 (Kg BOD, /ha/ day)
Wetland Surface Area (ha) = 0.038 ha = 4090 sq ft. These calculations showed a required wetland surface treatment area of 0.038 ha (4090 ft’).
Due to the use of the more conservative loading rate of 75 Kg
BOD~/ha/day,as opposed to the 100 Kg BOD~/ha/day,the required area was rounded down to 0.03716 ha (4000 ft’) providing an adjusted design loading rate of 76.7 BOD~/ha/day.This adjustment allowed for more simplified and even wetland cell dimensions to assist the dairy farmer with construction activities. The required surface area was partitioned into four adjacent wetland cells to decrease the potential of short-circuiting and assure an even redistribution of flow at three points along the length of the constructed wetland system. Each wetland cell had a bottom surface area of 6 m x 15 m (20’ x 50’),resulting in a 2.5: 1 length to width ratio and a surface area of 0.00929 ha (1000 ft’). This is short of the 3: 1 to 5: 1 ratio range recommended by Hammer (1993) for individual cells, however it does meet the minimum 10:1 total length to width ratio recommended by Steiner and Freeman (1989). It was necessary to choose the 2.5: 1 ratio in order to avoid excessive land disturbance and reconstruction due to the contours of the land available. Detention time was calculated using Equation 3-2: Time (days) = (L*W*H) / Q
(Equation 3-2)
Where L = length = 60 m (200 ft) W = width = 6 m (20 ft) H = Water depth = 0.3 m (1 ft) Time (days) = (60 m * 6 m * 0.3m )/ (1900 Wday * 0.001 m3/L) 0 . Time (days) = 56.84 days = 14.2 days for each of 4 cells
34
An operational depth of 0.3 m (1 ft) was chosen in accordance with the 0.3 to 0.45 m
(12 to 18 in) range recommended by Reed et al. (1988). The shallower 0.3 m was chosen to maximize aerobic conditions, and resulted in a 14.2 day detention time within each cell. This is just slightly more than the 7 to 14 day optimal detention time recommended by Herskowitz et al. (1987).
3.4. WETLAND CONSTRUCTION Site development began with staking and marking out the ground. Excavation of the site began on October 19, 1993 when the dairyman's equipment and labor became available. Equipment used included both a front end loader (Case 125B) and a bulldozer (Case 450). Excavation of the site revealed a native, impermeable marine clay deposit at the constructed wetland location. This in situ clay eliminated the need to provide additional sealing of the wetland bottom by other means. Cells were leveled to the correct elevations using the bulldozer. While completing the leveling of the cells, the bulldozer provided compaction of the clay bottoms. The next step included the installation of the weirs. Weir materials consisted of 5 x 10 cm and 5 x 20 cm (2" x 4", and 2" x 8") pine boards covered with polyurethane, galvanized nails
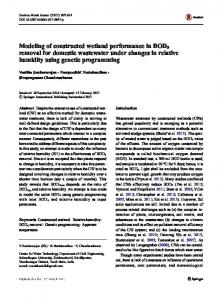
and bolts, and a plastic sheet. Diagrams of the wetland layout and a cross-sectional view of a wetland cell, including the weir, is given in figure 3.3. General construction of the weirs followed these steps: 1) drive support beams into the clay bottom; 2) place flash boards and plastic sheet into place; 3) backfill over plastic with clay and compact well. It was important during the flash board placement to keep the boards level across the entire length of the weir to provide an even flow over the entire length. Placement of the topsoil was the next step. The
35
Influent Pipe From Milkhouse
-
-
(20’) ‘ 6m
15 m
.i
(50’)
I
15 m
4’ 60 m
(200’)
.I 15 m
(50’)
Collection Tube
I
’-----\\
15 m (50’)
\ \
\ \
\ \
f-
I
‘t
Figure 3.3. Wetland cell layout: (a) Top View of wetland cells; (b) Cross-sectional view of a wetland cell with a weir. Figures are not to scale.
36
topsoil used was that set aside during the initial excavation operation. Leveling of the topsoil was done by hand, using spades and grub hoes. Planting of the cattails in the wetland was performed next. Dormant cattails (harvested in November of 1993) were lifted from their aquatic substrate in a local wetland pocket located on the dairy farm. All but the bottom foot of stalk was removed during the transplanting process. On the same day, the cattails were transplanted into the constructed wetland topsoil manually using spades, grub hoes, or by merely placing transplants in deep foot prints. Transplant density consisted of nine rhizomes per square meter, which was slightly less than the 1l/sq meter recommended by Dobberteen et al. (1991). In addition cattail seeds were dispersed by hand. Seed planting was accomplished by standing upwind of the wetland cells and knocking seed heads together, thus dislodging the seeds so that they floated onto the wetland topsoil. Enough seeds were dispersed so that the topsoil was covered with a very evident "white coat". Seeds adhered to the topsoil due to its moist condition at the time of dispersal. The wetland system's construction was not completed in the fall as very wet conditions did not allow the dairyman's excavator access to the wetland. Sideslopes of the wetland cells and a precipitation diversion ditch on the uphill side of the wetland were not completed. In the spring of 1994, the need for a precipitation diversion ditch became very evident. Due to a quick snow melt and rains in the spring, manure in the manure storage area had liquefied, over flowed from the manure containment pit, and traveled down slope into the three lower wetland cells. Furthermore, the quick melt off of snow from the cow barn roof ran into the wetland cells and caused erosion around the
37
three lower weirs. Resetting them using backfill and manually re-compacting corrected damage to the weirs. Accumulations of up to two inches of manure had to be carefully removed manually so as not to damage the fall transplanted cattails. Topsoil and cattail transplants that had been eroded or incidentally removed with the manure runoff required manual replacement. Cattail transplants were once again collected from a cattail marsh located on the farm. Likewise, the lost cattail seeding needed to be replaced. This was accomplished by hand dispersing seeds left over from the prior fall's planting. In the early summer of 1994 drier conditions allowed for the completion of the wetland side slopes using a backhoe. Continued warm temperatures in June were such that the wetland soil was developing drought-stressed conditions for the seedlings and rhizomes. To protect the new plants from stress due to lack of moisture, well water was delivered to the wetland cells by a hose from the dairy barn. Weir heights were lowered to the level of the topsoil, by removing flashboards, so that wetland cell soil remained moist without buildup of water depth. This provided moist conditions necessary for seed and rhizome growth without drowning out the new seedling growth. Cattail growth from seeds was first noticed June 21" of that summer. Future influent flows from the dairy roof and manure storage facility during storm events were diverted around the wetland using manually dug diversion ditches. Hand digging was necessary as wet conditions once again prohibited the excavator from gaining access to the uphill slope. When a majority of the plants had gained a height of 6 inches, by July 1, 1994, flashboard height was increased by 4 inches by inserting
38
additional boards into the weirs. This height allowed the cattail leaves to extend beyond the water surface, which is necessary for sufficient air exchange. At this time, the water in the wetland was still being provided by well water coming from the diary barn or through precipitation. On July 20, 1994 the cattail plants were generally at a height of 8" or greater. It was decided that this should be an acceptable time for applying the dairy wastewater to the wetland. Before this was allowed, the well water flowing through the wetland system was sampled at each of the weirs to test for pre-waste conditions. Once pre-samples were taken, the dairy waste was diverted into the wetland system, entering at the beginning of the first cell
3.5 SETTLING BASIN MODIFICATION By the second week of August 1994 it became apparent that the solid load into the wetland system was too great for the wetland system to accommodate and treat. This was discovered by visual evidence of solid accumulation within the first wetland cell. Concurrently, more accurate 24 hour composite samples disclosed a greater amount of waste emanating from the dairy than first detected with manual collections conducted during individual milking sessions. This prompted further discussions with the farmer and his milkhouse employees about the dairy operation. The discussions disclosed several additional washings and discharges not accounted for in the original waste sampling. Therefore, it was determined that the wetland must include pretreatment for solids removal. This was accomplished by excavating one half of the first wetland cell to a depth of 1.5 meters (5 fi) on August 26, 1994,
39
thus creating a settling basin (Figure 3.4). This settling basin consisted of a 67.5 cu yd (2383 ft3)basin directly attached to a 45 sq. meter (492 )'lf
cattail marsh. The
attached marsh provided for a shallow settling basin quiescent zone due to the presence of the dense cattail stands within. It was observed that emptying of the sedimentation basin should be conducted every two months, as excess solids would appear in the settling basin effluent by the third month, if not emptied sooner. Sediment loading to the sedimentation basin exceeded the three month time period on several occasions due to solid removal not being accomplished on time. This was due to adverse weather, equipment failure, worker unavailability, or some combination of these factors that impeded the dairyfarm from completing this maintenance task routinely. This resulted in the settling basin filling beyond capacity for periods of time. A graphic representation of the sedimentation fullness for the sampling period may be seen in figure 3.5. The settling basin was considered full when animal bedding material (wood chips) were seen to pile up above the water surface. The settling basin continued to accumulate the larger bedding solids with minimal visual discharge of solids to the lower wetland cells. This was due to the bedding solids being held back and filtered out by the cattails nearest the deep basin. The settling basin displayed full capacity during the months of November 1994 (4'h through 29'h)and February 1995 (January 26th through March 1 st). During these periods of fullness, the milkhouse wastewater would enter into the solids pile near the front of the basin area, only later to have flows reappear at the basin-cattail border within the first
40
Influent Pipe
Effluent
Clay
Clay
Soil
Soil b
4
60 m (200 ft)
Figure 3.4. System profile view with settling basin.
41
Percentage of Settling Basin Fill 100 90 80 70 60 II I
a R
50
30 20
10 0
Figure 3.5. Settling basin fullness.
42
cell. Full capacity of basin was also displayed on April 16, 1995, only one and a half months after the prior clean-out. Normally the basin was able to handle nearly three months of effluent before displaying solids at the surface. In this particular case, one of the dairy workers attempted to perform the clean out. However, due to his unfamiliarity with the system and the depth of the settling basin, he reported emptying the basin to a depth of 3 feet, thus removing approximately 75% of the solids. 3.6 WETLAND CELL OPERATIONAL OBSERVATIONS
By the second week of operation, there was short circuiting evident in wetland cell number two, as much of the water was flowing around the cattails and over the sparsely vegetated side slopes. Inserting boards along the side slopes so that they extended into the cattail stands alleviated this problem. This caused all of the flow to remain within the cattail stand. As time passed, the cattail growth expanded into the side slope areas such that their densities eventually alleviated the need for diversion boards.
3.7 RECALCULATION OF WETLAND SIZE After the wetland had been designed and constructed, a mechanical flow meter became available for use the following summer on July 10,1994. It was installed on the day the dairy wastewater first entered the constructed wetland. The depth sensor, which was located on the bottom of the wastewater pipe, developed clogging problems as debris in the waste stream would hang-up on the sensor causing a backing up of the wastewater. This blockage caused the depth sensor to produce both erroneous flow measurements and flow based composite samples. Several attempts to screen out debris were unsuccessful.
43
It was discovered, however, that with numerous sampling periods a few unobstructed flow measurements and samples could be obtained. Using a few successfully recorded composite-sampling sessions, the discharge amounts were found to average 11,734 liters per day (3100 gal/day) with a BOD, of 2837 mg/L. These greater values for flow and BOD, concentrations quickly pointed out the fact that the earlier estimates, based upon the manual sampling, were very low. In reviewing flow graphs, generated by the flow meter software, additional flow peaking periods were evident outside of the three milking sessions. This led to additional questioning of the dairyman and his workers as to why there may be additional waste flows outside of the three milking sessions. Additional information concerning previously undisclosed rinsing and sanitation discharges that occurred generally 4 hours after the milking session were disclosed and therefore were not included in the initial sampling. With this information these additional washings could then account for the higher daily flow amounts and contamination concentration. As for the much higher levels of BOD,, these are a result of non-sampled high strength discharges that occurred with equipment rinses and sanitation periods that contained considerable milk waste. It is important to point out that milk has a very hgh BOD, of approximately 100,000 mg/L (Jones, 1974), and can therefore contribute significantly to the BOD loading. This fact accounts for the large difference between the estimated and actual system influent BOD, concentration. Using the more accurate estimates of the waste loading and including the sedimentation basin in the design the corrected wetland size calculations are given below. These new calculations find that an additional 0.406 ha of wetland surface area is required. This equated to a required wetland with an area approximately 1 1.5 times larger than the one originally designed.
44
CORRECTED WETLAND DESIGN CALCULATIONS INCLUDING SEDIMENTATION BASIN Flow (Wday)
Organic Load = (Kg BOD5/day) Organic Load
=
Wetland Surface Area (ha) Wetland Surface Area (ha)
BOD, conc. (mg/L)
(Kg/mg)
11,734 L/day x 2837 mg/L x
=
=
Kg/mg = 33.29 Kg BOD,/day
Organic Load (Kg BOD,/day) Loading Rate ( Kg BOD,/ha/day) 33.29 (Kg BOD, /day) 75 (Kg BOD, /ha/ day)
Wetland Surface Area (ha) = 0.444 ha = 47,792 ft2
3.8
WETLAND SYSTEM WASTE TREATMENT RESULTS CALCULATION To evaluate the wastewater treatment capacity of the settling basin (SB), wetland
cells (WC), and the system as a whole (total system (TS)), different means of calculating the removal rates were required (see Eq. 3.3, 3.4 and 3.5 below). The reason for the different means of calculating the removal rates was necessary because of the inability of the automatic sampler to consistently collect flow-based samples of the diary’s milkhouse effluent, due to frequent clogging in the discharge pipe. Therefore, for the milkhouse effluent concentrations it was necessary to determine average effluent concentrations for each of the wastewater constituents. These averages could then be used in the removal calculations for both the settling basin and total system. Whereas, average values were not needed to calculate the wetland removal rate due to continual weekly grab samples taken at both the settling basin effluent weir and the wetland effluent collection tube (see
45
Table 3.2). Therefore, due to the settling basin and total system removal rates being calculated using average dairy effluent concentrations, and the wetland cells removal rates using actual weekly influent and effluent values, the total system results cannot be determined by adding the settling basin and wetland system removal rates together.
SB Removal (%) = {Ave. Dairy Effl. Conc.) - (SB Effl. Conc.) x 100 Ave. Dairy Effluent Conc.
Eq. 3.3
WC Removal (%) = (SB Effl. Conc.) - (WC Effl. Conc.) x 100 SB Effluent Conc.
Eq. 3.4
TS Removal (%) = (Ave. Dairy Effl. Conc.) - (WC Effl. Conc.) x 100 Ave. Dairy Effluent Conc.
Eq. 3.5
46
RESULTS 4.1 TEMPERATURE RESULTS
Field water temperatures are plotted in figure 4.1 and show that the settling basin and wetland cell water temperatures generally changed with the seasonal atmospheric temperatures. The major deviation from this trend was during the time period when the wetland was covered with ice. During this period (December 29 to March 19) the water temperatures in the settling basin and wetland cells 1 and 2 showed an increasing temperature trend compared to the decreasing ambient air temperature. There was also a general trend for the wastewater to cool as it traveled through the wetland with the warmest water temperatures in the settling basin and the coolest in the last wetland cell 3. 4.2 DISSOLVED OXYGEN RESULTS
Measured dissolved oxygen concentrations for the effluents from the settling basin and the wetland cells are plotted in figure 4.2. Non-continuous measurements of dissolved oxygen concentrations during the study period were due to equipment failures that resulted in many missed sampling periods from the end of November 1994 to the middle of April 1995. Generally the dissolved oxygen levels rose as colder ambient temperature approached in the fall and winter and decreased with approach of warmer temperatures in the spring. It is during this time that the system waters were cooler, and with the cooler temperatures typically comes increased solubility of oxygen in water and decreased microbial activity. During the spring, summer and fall months the DO level’s remained below 2.0 mg/L. Only on the two successful sampling periods in February were aerobic water conditions observed within the system. Minimum DO levels for the
47
-
r
~-
~
I
1-
-
Ave. Weekly Air Temp. - -X- Wetland Cell 2 _ _ _ _ ~
- -*- Wetland Cell 1
-
~~
-
Settling Basin A* Wetland Cell 3
~-
35 30 25
20
u 0
15
R
5
0
-5 -10 -15
Figure 4.1. Water and average weekly air temperatures.
Ice cover-
6t7
Dissolved Oxygen Levels (mg/L) P 0 0
N
P 0
0
0
0
P 0
0
z 0
CI
w
P
N
0 0
0 0
7/26/1990 8/9/1990
-
8/23/1990 9/6/1990 9/20/1990
I
10/4/1990
6 I
10/18/1990 ~
11/1/1990 11/15/1990
.D
11/29/1990 12/13/1990 12/27/1990 1/10/199 1
I
1/24/1991 2/7/1991 2/2 1/1991 3/7/1991 3/2 1/1991 4/4/199 1 4/18/1991
1
! I
I
I
I
I
5/2/1991 5/16/1991
L
settling basin and wetland were 0.2 and 0.12 mg/L respectively occurring during the system startup. 4.3 pHRESULTS
Hydrogen ion (pH) concentrations in the wastewater is depicted in figure 4.3. During the study pH values were measured throughout the study period except when equipment failed. The settling basin pH values fluctuated with pH values that ranged from a low of 6.25 in the fall of 1994 to a high of 8.15 in the winter of 1995. Variation of discharge pH values for the wetland eMuent were less with a maximum of 7.85 and a minimum of 6.40 in the winter months of February and March of 1995 respectively. The overall median pH for the wetland was 7.08. The highest pH values for the sytem occurred during the time period when the settling basin and wetland cells were covered by ice. 4.4 TOTAL SUSPENDED SOLIDS (TSS) RESULTS Using flow-based composite sampling the dairy's wastewater effluent was estimated to have an average TSS concentration of 3900 mg/L. This value was utilized in evaluating the removal efficiency of the system components and is plotted along with the effluent TSS concentrations (Figure 4.4) and TSS removal efficiencies (Figure 4.5). The total system performance never recorded a month with an average below 70% removal. The lowest monthly removal percentage of 70.4% occurred in February 95. It was during this month that there was a combination of ice over the entire system and the settling basin was full for the entire month. Although the settling basin, during this time period, had effluent TSS levels higher than influent levels the system had an overall positive
50
1
H
X
Settling Basin --.Om IWetland Cell 1
- A - Wetland Cell
Wetland Cell 2
3
Ice Cover Period
'4yx'H~~(lh"'vlF''4~o~u
8.00
7.50
7.00
xa 6.50
6.00 I
Ice Cover Period M
I
U
l
~
~
~
n
U
I
I
I
1
I
V
n
(
M
~
~
~
~
"
~
"
,
5.50
5.00 -
I
I
I
I
I
I
I
I
I
I
Figure 4.3. pH Levels
I
I
I
I
I
I
I
I
I
I
I
1
~
_
~
Basin
A
- VSS-Wetland cell 3 _
~
_
~
-
-
_
_
*TSS-Wetland
_
9000
_
_
~
_
-
~
_
_
~~
_
~
Ice Cover Period -~ -
‘Milkhouse VSS _
__
Milkhouse Effluent TSS - - -A - VSS-Settling Basin
cell 3
______
~ ~
~~
~
8000
7000
$
6000
W
c
0 .-
wl N
A +
!
5000
+A
80
5
4000
0 v)
2 3 3000 v)
2000
1000
0 0
m
2
\
m 3
\
b
0
%
3
m m 3 \
b
e? m
3 \
3 \ 3
d
3
\
m 3
3
3
Figure 4.4. Effluent TSS and VSS Concentrations.
d
m m
Q\
m
3
3
\
\
00
m
\
m
M d
\
d
4
4
3
m
2
\
m
e? v,
~
53
removal rate of 70.4%. It was apparent that the wetland cells were able to compensate quite adequately for the increased loading resulting from the full settling basin. 4.5.
VOLATILE SUSPENDED SOLIDS (VSS) RESULTS The milkhouse wastewater discharge had a VSS average effluent concentration of
3500 mg/L or 89.7% of the TSS concentration. This is consistent with what is found with highly organic wastes. The VSS concentrations measured for the study period are plotted with the TSS concentrations in Figure 4.5. Using the average 3500 mg/L VSS concentration as the influent base line value, the monthly removal efficiencies were calculated for the total system and the settling basin and are presented in Figure 4.6, along with the wetland removal efficiencies. Results were very similar to TSS results. This included the increased discharge (19.1%) from the settling basin to the wetland cells during the month of February 1995. During this time the wetland cells were able to remove sufficient VSS to attain a positive 66.3% removal of VSS for the system as a whole. 4.6.
BIOCHEMICAL OXYGEN DEMAND (BOD) RESULTS Measured concentrations of BOD for the study period are presented in Figure 4.7.
System performance for the reduction of BODSresulted in a total system reduction ranging between 43.2 and 87.6 percent (Figure 4.8) for the milkhouse influent that was determined to have an average 2837 mg/L base level. The settling basin always had positive reductions. On the other hand, the wetland cells had two dates upon which the
BOD actually increased. These occurred in January and February of 1995, which is at the same time when ice was covering the wetland (Figure 4.7) and the settling basin was full.
54
I
I
I
I
I
I
I
I
F
8
+*.*
I
I
..
I
...,.*...,-,...,...*..*. ..*,.-s,.'.",. ." ,.'*.' A.. . . . .. . . . . . . .
.. ..
55
*.,
r
~ _ _ _
~~~
--0- -
~~
~~
Influent BOD Wetland Effluent BOD __
~~
_ _ _ ~
~
4000
-
+Settling Basin Effluent BOD Ice Cover Period
____
Ice Cover Period 3500
h
$ 3000
z
W
v1 .4
2500
Y
2
Y
c 0
20 u
2000
n 1500
\
\
500
\
0 0 3
\
Pi
0
3
\
3
3
3
3 \
F!
IA
\
m
\ 3
3
3 3
3
-3
3
3
\
\ 3
\
z \ 3
m
\ 3
b, \
c\1
3
Figure 4.7. BOD Effluent Concentrations.
I
7
1 7 1
U
8
8
I
8 0 4
8 00
8 \o
8 d
c\1
57
8 c;J
8-?
8Y
4.7 CHEMICAL OXYGEN DEMAND (COD) RESULTS
The milkhouse wastewater discharge had a COD average effluent concentration of 6740 mg/L. When this is compared to the average BOD influent concentration of 2837 mg/L it results in a COD to BOD ratio of 2.38:l which falls within the ratio range for untreated domestic wastes. Chemical oxygen demand concentrations measured during the study period for the settling basin and wetland effluent are plotted in figure 4.9 along with the average influent COD concentration. A plotting of the monthly removal efficiencies for the system is shown in figure 4.10 and displays a consistent reduction for the system as a whole ranging from 29.7% to 60.9%. Only in February did the settling basin record a month with an increased average discharge. This occurred during the month when ice was covering the wetland and the settling basin was full.
4.8 NITROGEN TREATMENT RESULTS To evaluate the nitrogen removal in a treatment system it is important to remember to evaluate the various nitrogen compounds formed during the breakdown of organic compounds. As discussed earlier in section 2.4.3, the primary nitrogen compounds formed during the breakdown of organic compounds proceeds as shown below. Organic-N (TKN)
+
Ammonia-N (NH4)
+
Nitrate-N
+
Gaseous-N
W 3 )
To evaluation of the total nitrogen (TN) removed from the wastewater, TN was considered to be represented by a sum of the TKN-N, NH4-N, and N03-N concentrations. Concentrations of TKN measured during the study period are plotted in Figure 4.1 1 along with the average milkhouse effluent TKN concentration of 270 mg/L. As the
58
S661/EZ/S
I
S66 1161s
I I
566I/SZ/P
I I
S66I/I I/P
I I
S661/8Z/E
I
I
S66 I/PI/E
I
S66 1/82/Z
I
-a-
I I
S661/PI/Z
i--
S661/IE/I
4 I
S66I/LI/I
I
S661/E/I
I
P661/OZ/ZI
I
I
4
I I
P661/8/11
P661/II/OI P66 IllZ/6
I I
966 I/E1/6
I
P66 I/OE/S
I
I
P66I/91/8 P66 I/Z/8
I I
! -
0
$:
P66I/6Ill 00
u
d
I I
2
w
P661/ZZ/II
I
0 0
3a
n 0
I
0 0 0
6 *
t661/9/ZI
P66IlSZIOI
0 0 0
$ 3
I I
I
+
80 . c, I
0 0 0 \o
0 0 0
d
0 0 0
N
0
a
5
fG
/
I
/
60
Concentration (mg/L) c.
0 0
0
712011994
w
w
P 0
0
0
0
0
0
VI
m
4
0
0
0
0
0
I I
8/311994
I
I 81 1711994
I I
813 111994
I
t
911411994 912811994
I
D: I
*
1011211994
I I
I
I
10/26/1994
D:
11/911994
I
2
11/23/1994
p
12/7/1994
Ee
F
I I
8
I 1 I
F
4ti'
I
12/21/1994 1/4/1995
I
m
ZBi
P
'
I I
I
1/18/1995
I
c 211I 1995
I
I I
211511995 311I 1995 3/15/1995
d
3/29/1995 411211995 4/26/1995 511011995 I
5/24/1995
I
'
I
0
data shows the settling basin and wetland cells provided some removal of TKN from the wastewater, with only one exception. This exception occurred in February 1995 at a time that there was ice cover over the system and the settling basin was full. The removal rates are plotted on figure 4.12, and show that the system as a whole resulted in positive removal of TKN for the entire study period.
In contrast to the decreasing TKN concentrations, the NH4 results indicated that the concentrations were generally increased for the time period (Figure 4.13). The source of the additional N H 4 may be generated by the biological breakdown of the TKN during ammonification process. The system as a whole experienced increases in the NH4 concentrations, with the exception of the positive 20.32%removal recorded during the month of March 1995 (Figure 4.14).
A plot of the NO3 concentrations (figure 4.15) shows concentrations fluctuating above and below the milkhouse wastewater influent NO3 concentration of 154 mg/L. When these concentrations were used to evaluate the monthly changes in NO3 concentrations, see figure 4.16, it can be seen that there were fluctuations between reductions and increases for the entire system. These increases are the result of TKN and NH4 being converted to NO3 as they pass through the system. To identify the end results of the system’s ability to treat nitrogen the concentrations and percent removals were plotted in figures 4.17 and 4.18 respectively. As the graphs show, the settling basin had a much worse performance for TN removal than the wetland cells.
62
100.00
AUG
0 Settling Basin 151 Wetland Cells
SEP
.
OCT
NOV 5.38
DEC 53.99
JAN
- ~-
37.85
FEB
MAR
APR
-33.33
8.35
2.04
5.01 12.11
21.71 19.91 _____~
60.78
68.55
20.32
39.22
67.45
20.64
17.44
42.21 -
59.37
85.53
49.54
44.90 -
70.69
22.26
~
MAY
~
___
~
.
2.041.52
.
3.53
I I I I I I I
I
I
I
0
m
m
0 0
m
1
0 Vl
N
I
0 0
0
m
N
4
64
0
2
0
m
0
:.pi,v,,",,,'. ....... .
0
0
0
0
0
0
0
9
9
0
9
0 0
9
9
7
9
Lo
0
0 0
0 Lo
. r ? . r P H N J O @nodax% I
65
0
0
0 0
0
9
9
9
Lo
9
5661/PZ/S S661/0 I15 S661/9Z/P 566 566 566
566115 I I Z
k P66I/6/1 I P66 I /9Z/O I
0 0
2
0 0
r
0
0
n0 c 0 a
G
P66 I/P 116
Q-
966 IIL 118
0
t
0
.
66
0
~
0
~
0
%
0
%
0
S
Z
100.00 50.00 0.00 -50.00
- 100.00 -150.00 -200.00
-300.00
-
AUG
I
SEP
I
OCT
1
NOV
I
DEC
I
JAN
FEB
MAR
APR
MAY
Settling Basin
-4 1.09
28.48
-13.13
-16.06
-41.74
-17.04
-252.73
2.47
-108.06
-72.30
Wetland Cells
17.55
-220.29
-23.92
-6.58
43.48
5.57
-70.98
27.01
63.57
-84.15
Total System
55.01
-134.07
-10.21
23.02
30.43
-10.53
-207.76
3 1.73
23.28
-186.09
Figure 4.16. NO3 Removal Efficiency.
S66 I/PZ/S
~
I I
566I/OI/S
I
S661/9Z/P S66 I / Z I/P S661/6Z/f
I
566 I/S I / € S661/1/€ S66 I/SI / Z S661/I/Z
E Q)
c, v1
h
S661/81/1
a
.m
S661/P/I
I
ed
Y
P66I/IZ/ZI
Q
P66
I P66 P66 966 I/9Z/O I P66 I/ZI/OI P661/8Z/6
?~
P66 I/P1/6
I
P661/1El8 P66 I /L I /8 P66 I/E/8 P661lOZIL 0 0 00
0 0 W
0 0
d
0
0
hl
0 O 0
0 0 0
68
0
0 0 W
0
O d
h
0 0
l
0
100 80 60
E
40 20 0
-20 -40 -60 -80 -100
+-120
_
AUG
_
SEP ~
OCT 5.11
0 Settling Basin
3.72
F I 4 Wetland Cells
-50.52
9.00
-44.93
13.65
28.73
NOV
_ ~ _ _ -
_ _
_~
-~
DEC -
~ _ _
JAN
FEB
MAR
7.81
-113.41
-0.68
-
-12.17
12.11
34.55 ~_ -
40.45
7.04
25.79
51.39
26.59
47.66
14.30
-58.38
51.06
. .~-
Figure 4.18. Total Nitrogen (TN) Removal Efficiency.
APR
MAY
-46.62
-36.8358
31.81
-39.4161
0.02 __
-90.771 1 __
.-______-
~
4.9 PHOSPHORUS RESULTS
Evaluation of the wetland system's phosphorus removal ability was measured by testing for total phosphate (TP) and ortho- phosphate (OP) concentrations. In January 1995, after determining that the OP concentrations generally followed those of TP and therefore of little significance, OP sampling was discontinued. Concentration graphs for TP and OP, figures 4-19 and 4-21, show that concentrations were primarily found to be lower than the influent levels from the dairy milkhouse. Removal rates for OP are plotted in figure 4-20. The graph shows that the OP removal rates for the settling basin and total wetland system fluctuated between removals and increases in OP, while there were only removals in the wetland in all but one sampling month. Total phosphorus removal levels are plotted in figure 4-22. From the summer start up to the middle of winter there was a general trend for reduction of TP by both the settling basin and the wetland cells. By spring, this removal trend had switched to a TP releasing situation. 4.10. VEGETATION ESTABLISHMENT RESULTS
Both the rhizome transplanting and seeding of the wetland topsoil was successful in establishing cattail populations. Accurate comparisons and analysis of results for these two methods were made impractical due to Spring 1994 washouts and manure flows. Furthermore, it was not apparent as to which planting or seeding period, i.e. fall or spring, worked better as spring replanting and reseeding occurred before fall establishment results were apparent. However, general observations were made on the success of both methods. Rhizome transplants appeared to have a success rate of 50 to 70 percent. In
70
120
100
80
60
40
20
0 d
m
d
m
b
m
\ 3
m
\
00 3
3
3
Figure 4.19. OP Effluent Concentrations.
100
80
60 40
20
0 -20
-40
AUG
t 0 Settling Basin Wetland Cells I Total Svstem
~~
I I
SEP
I
OCT
I
NOV
I
DEC
I
JAN
I
19.29
I
13.63
I
-13.27
1
26.37
1
-23.19
I
-33.33
1.64
32.50
3 8.46
9.22
-1.95
10.44
10.69
54.69
-1 1.08
FEB
I I
MAR
I I
APR
I
EL Concentration of Effluent TP (mg/L) N
0
0
P 0
a
03
0
0
712011994
813/ 1994 8/1711994 8/31/1994
D
9/14/1994 9/28/1994
L 011211994 0/26/1994 11/9/1994 1/23/1994 121711994
ID
12/21/1994 1/411992 1/18/1992 2/1/199:
1 21151199:
I
~
3111199 31151199 31291199
>O
4/ 121199 41261199 51101199 5/24/194
i
i
2
2
0 0
hl 0
1uu.uu
80.00
60.00
40.00
20.00
0.00
-20.00
SEP
OCT
NOV
DEC
JAN
FEB
1 0Settling Basin
-8.80
21.30
2.78
24.77
0.06
7.06
Wetland Cells
14.89
5.88
33.33
52.3 1
12.04
22.45
21.96
64.12
[HTotal System
AUG
14.93
MAR
APR
MAY
-3.01
-19.21
9.97
-5.62
16.89
10.19
-8.80
0.93
areas not greatly affected by the spring washouts, the seed dispersal method produced approximately 90 to 135 seedlings per square meter. The greatest difference between the two methods was evident by the rate of growth of the plants. New shoots fiom the rhizomes grew taller and quicker than the shoots originating from seed. Rhizome shoots also had a deeper root system than seedling shoots. 4.11. CONSTRUCTED WETLAND COST RESULTS Costs for this constructed wetland project were kept low due to the use of the farmer's equipment and labor. As this may be a somewhat unique situation and to properly compare this project to others, the costs associated with this particular project will be calculated without incorporating the savings gained using the dairy farmer's equipment. Calculations of these costs are outlined in Table 4.1 using actual 1995 materials costs and estimated costs for all manual labor, survey work, and equipment costs as provided by Millet Associates (1997).
75
CONSTRUCTION COSTS FOR THE CONSTRUCTED WETLAND ON RICHARD VARNUM'S DAIRY FARM BULLDOZER (CASE 450) Time Needed: 10 Hr Costhour: $ 4 5 (includes operator) Mobilization: $100 TOTAL COST = $550 FRONT END LOADER (CASE 125B) Time Needed: 7.5 Hr Costhour: $ 55 (includes operator) Mobilization: $100 TOTAL COST = $5 13 EXCAVATOR Time Needed: 8 Hr $ 7 0 (yard bucket) (includes operator) costihour: Mobilization: $100 TOTAL COST = $660 SURVEY Time Needed: 5 Hr Costhour: $65 Transportation: included in hourlv TOTAL COST = $325 MANUAL LABOR Time Needed: Weir construction Spread Topsoil Transplant cattails TOTAL TOTAL COST = $890 MATERIALS: Woodetc.
61 Hr @ $10 hr = $610 16 Hr @ $10 hr = $160 12 Hr @ $10 hr = $120 89 Hr
$250
TOTAL COSTS: Bulldozer $550 Front End Loader $5 13 Excavator $660 Survey $325 Manual Labor $890 Materials $250 TOTAL $3188
Table 4.1. Projected costs for building the current constructed wetland assuming it was done by a private contractor. (1995 data)
76
5. DISCUSSION 5.1 INTRODUCTION The successful application of constructed wetland technology to treatment of wastewater with relatively low organic loadings and in warm weather conditions has been well documented (Reed and Brown, 1992). In this project, a constructed wetland was utilized to study the treatment of high strength dairy waste in a cold climate area. The system was constructed and initially planted in the fall of 1993. The system evaluation period began in the summer of 1994 and concluded in the spring of 1995, thus providing one full year of seasonal performance data. The wastewater generated by the milking parlor operations was estimated to be 13,300 L/day (3,500 GPD) and containing a BOD5 value of 1,825 mg/L. These levels were significantly higher than what was originally estimated by samples taken of the milking sessions. The end result was a wetland system that was under designed for the actual loading concentration and flow. This type of underestimation is not uncommon in relation to milkhouse wastewater discharge estimations due to its erratic occurrences despite regular milking times. Others have also reported difficulty with accurate estimations of dairy waste stream characterizations (Newman and Clausen, 1977; Danalewich et al., 1998). The constructed wetland in this study consisted of a settling basin followed by three wetland cells. Solids removal was the prime objective of the settling basin, which consisted of a deep 1.25 m (4 feet) basin followed by a shallow 0.3 m (1 ft) polishing cattail marsh. For the wetland cells the objective was to accomplish secondary treatment. This chapter will evaluate the performance of the settling basin, wetland cells and the system as a whole for the four seasons. Design alternatives to the current system will
77
also be presented based upon the findings of this and other recent studies involving milkhouse wastes. 5.2 RECENT WETLAND STUDIES Since the completion of the project sampling period, an updated literature search was completed. One of the findings of this update was evidence that other researchers have similar interests in wetland treatment applications for milkhouse wastes in cold climates. As these studies occurred simultaneously with this study or since its completion, this new information is presented in the discussion section. Table 5.1 contains a summary of this study’s results along with three other studies’ in which free water constructed wetlands were utilized to treat dairy milkhouse wastes similar to this study. (The two Maine studies were performed using the wetland constructed for this research. In the Oldfield (1996) study, the wetland received half of the settling basin effluent wastewater and the other half went into a lagoon. Major differences between the three studies included pre- and post- wetland treatments utilized, as well as waste concentrations generated from the milkhouses. Differences in waste composition can be attributed to both dairy operational procedures and waste reduction practices. In the Schaafsma et al. (2000) study, the wastewater originated from several sources as opposed to the other sites receiving wastewater strictly from the milking parlor and its associated activities. The summarized waste sources and treatment results presented in Table 5.1 will be utilized in the discussion section.
A summary of the monthly removal
efficiencies of this study for the settling basin, wetland cells, and the total system is presented in Table 5.2. These values are used throughout the discussion section as well.
78
# cows - # Settling #Wetland Cells Vegetated Loading Concentration ppm / Removal % Llday basins Total Area Filter strip TSS I BOD51 NH4-N I N03-N TKN I TN I OP
I
TP
0.06ha 16451 1914 I 72 I 5.5 I - I 164 I 57 I 53 170 2 basins 2 cells 96% 97% I 56% variable 0.1 1 ha total -82% I - I 9 8 % ( 84% I 96% Wastes: composed of milking parlor flush, manure pit water, stormwater run-off from barnyard, silo effluent.
I
I
1
I
Newman, Clausen and Neafsey 2000 (Connecticut) NIA 3 cells N/A 112841 2683
I
1
I
I
7.72
I
0.3
I
1102.61
-
I
-
I
I
26
I
0.04 ha total 90% 76% I-577% 67% [ 28% rr!ilkina Darlot! - rinsina Darlor fldor. automa!ic rinsina of milkina eaubment. cleanina of thelbulk t a k .
4 W
: : :W :I I
I I
Kostinec (Maine: 1994-1995) 350 II 1 basin II 3 cells I N/A II3900 I 2837 I 77 I 154 I 270 I II - - I 0.0285 ha total 84% I 56% I -85% I -39% I 45% I ! d i i z / i l k h o u s e : riAsina Darlor floor. automatic risina of milkina eaubment. cleanina of bulk ta
I
71
I
86
Oldfield, 1996 (Maine: 1995-1996) 350 I 1 basin I 3 cells I N/A I13001 2810 I 180 I 64 1 1 1 8 1 - I - I _ _ 6,650 0.0285 ha total 155% I 55% I 24% I -57% I 34% I - I - I Wastes: milkhouse: rinsing parlor floor, automatic rinsing of milking equipment, cleaning of bulk tank, cow rinsing.
1
I
I
Table 5.1. Constructed wetland and milkhouse wastewater studies.
II
Water Parameter Aug-94 Sep-94 Oct-94 Nov-94 Dec-94 Jan-95
I
I
I
1
I
I Feb-95 I Mar-95 I Apr-95 I May-95 I
Table 5.2. Monthly Removal Efficiency Summary Table.
80
Mean
5.3 SOLIDS (TSS AND VSS) REMOVAL The same environmental mechanisms control the removals of both TSS and VSS, thus the removal of one often conveys the removal of the other. This was found to be true for the treatment of the solids in the settling basin and the wetland cells for this study. Figure 4.4 displays the close relationship between the two solids concentrations in both the settling basin and wetland cells effluent. Comparing the TSS to VSS concentrations in both systems it was found that the TSS is comprised of 75% to 95% VSS. This was observed to be true even during those time periods (November 1994 and February 1995) when the deep basin was at full capacity. Therefore, further discussions concerning solids removal will make reference to TSS only. Monthly solids removal efficiencies for the settling basin, wetland cells and the system as a whole are shown in Figure 4.5. Only the settling basin recorded increased discharges over the influent solids levels thus producing negative monthly removal efficiencies. This coincided with the time when the settling basin was at or near full capacity in February 1995. This fact demonstrates the importance of a proper maintenance schedule in order to achieve positive results. Even when the settling basin was discharging increased levels of solids the wetland and the system as a whole continued to have positive removal rates. The wetland compensated for the settling basin’s excessive discharges during the time periods when the settling basin was not functioning properly. However, this type of overloading, if continued, would greatly shorten the 15-20 year life expectancy (Vrhovsek et al., 1996) of the wetland cells. Wetland cells solids (TSS) monthly removal efficiencies ranged from 16.9% to 78.0% (Table 5.1). This wide range of removal rates can partially be attributed to the
81
fullness of the settling basin. The highest removals occurred concurrently or following those time periods when the settling basin was at or near full capacity. It was during this time that the highest solids loading rates to the wetland occurred, thereby allowing for greater removal potential. These findings are similar to those of Reed et al. (1988) in which wetlands display greater solids removal efficiency at higher loading rates. The seasonal effect that was most evident during the study period occurred in May 1995. During this month the solids removal for the wetland cells had its lowest recorded removal of 16.9%. This decreased removal percentage occurred during a time period when the settling basin was operating at less than 50% full. Therefore, the decreased removal would appear to be the result of some other condition. One factor to consider are the effects of a seasonal change. It was at this time that the waters of the system had a quick increase in temperatures (Figure 4.1). Kadlec and Knight (1996) have found that TSS removal decreases as a result of internal generation processes and gas lifting occuring during warmer months. The increased biological activities due to the increased temperatures in the benthic material deposited over the winter could account for this decreased solids removal efficiency. A comparison with the other milkhouse dairy study results (Table 5.1) indicates that the system in this study resulted in equally high treatment of TSS, despite that it is greatly undersized for the organic loading it receives. What this indicates is that the majority of the solids were removed in the initial portion of a constructed wetland. This is similar to Watson et al. (1989) reported to happen in constructed wetlands used to treat municipal wastewaters. They reported that what is found to occur in municipal wetland
82
systems is that most of the solids are filtered and settled within the first few meters beyond the inlet. In the Oldfield (1996) study, the 55% solids removal result was much lower than the 84% solids removal success for the initial year of operation conducted in this study. This occurred even though it received only half of the wastewater load. Oldfield (1996) suggested that the poor solids removal may have been due to internal generation processes, animal interferences, and gas lifting that have been reported by Kadlec and Knight (1996) to be observed most often in summer. More of this type of action may have occurred during the second year of operation, due to the first year of operation resulting in excess solid deposition into the wetland cells. 5.4.
BODS AND COD REMOVAL To evaluate the organic content and removal of organic matter, the two related
parameters, BODS and COD were utilized. Levels of both BOD and COD generally fluctuated concurrently. This was found for the results of both the settling basin (figure 5.1) and the wetland (figure 5.2). The greatest range between the COD and BOD levels for the settling basin and wetland were observed during the mid-winter period. For the settling basin, the washout of solids, and the interrelated organic components, were observed during those periods when the basin was at full capacity. The reduction and general stabilization of the BOD and COD levels following settling basin clean-out was considered to give the best indication of the effects of the settling basin operating beyond capacity. Thus, the condition of the settling basin fullness had the most evident effect on COD and BOD removal efficiencies for the settling basin. The only other notable difference between COD and BOD removal levels, outside of settling basin influences,
83
occurred in the wetland during the spring of 1995. One of the causes for this difference may be best attributed to the onset of warmer temperatures. These warmer temperatures have the potential of increasing the biological activity within the benthic layers in which more complex organics (i.e. less biodegradable) are located. This increased activity causes disturbance of the bottom sediments and potentially causes the more complex organics to be uplifted through gas lifting production (Kadlec and Knight, 1996). Another difference may be attributed to the presence of greater concentrations of ammonia (figure 4.13), which in the presence of nitrifying bacteria produce a nitrogenous biological oxygen demand (MOD). The M O D may produce lower BOD5 results, if sufficient numbers of nitrifying bacteria are present. M O D testing was not performed during this study, so this possibility could not be confirmed. Due to the apparent high levels of nitrogenous compounds in the dairy wastes it can be suggested that fbture similar studies perform M O D testing concurrent with BODStests. Overall, the total system produced positive removal rates ranging from 43.2% to 87.6% for BOD and from 29.7% to 76.2% for COD. Resulting positive removals were accomplished for the entire study period, despite times when one of the two system components was not functioning properly. Therefore, the combination of these two components (settling basin and wetland cells) together produced a total system capable of accommodating some treatment under cold temperatures and insufficient operational maintenance. The treatment level attained, however, was similar to a primary treatment system. The study by Newman et al. (2000) had lower BOD5 removal (76%) success than Schaafsma et al. (2000) study (97%) but higher than this study (56%). Newman et al.
84
(2000) attributed their lower 76% BOD5 removal to their system being under designed
due to their initial waste characterization. They designed their system based upon a BODSconcentration of 1500 mg/L, which turned out to be half of the true concentration
of 3000 mg/L. This same mischaracterization of the BOD5 concentration occurred in this study as well (with initial design BOD of 1500 mg/L vs. 2837 mg/L actual concentration) resulting in an undersized wetland area. 5.5.
NITROGEN REMOVAL The removal of nitrogen from wastewater requires several complex steps during
which intermediate nitrogenous compounds are generated (see section 2.4.3). Each of the steps has a set of environmental conditions under which it operates best, while its preceding and subsequent reactions often require different environmental conditions. Therefore, a proper analysis of the removals of these nitrogen compounds requires wellcontrolled and/or measured environments to understand the interactions occurring within the system.
In this study, by the settling basin not being properly maintained, the analysis of the nitrogen removal was complicated. Solids, containing various forms of nitrogenous compounds, spilled out from the full settling basin during full periods and were settled within the wetland cells. Here the deposited nitrogenous compounds are able, given the necessary conditions, to re-enter the water column in various forms at some future time. This additional cycling of nitrogen complicates the detailed analysis of its removal. Therefore, given the large amounts of solids within the wetland cells, a detailed analysis and projection can not be accurately conducted. Further complications come from the wetland being greatly undersized, thereby decreasing the amount of detention time and
85
area generally needed for nitrogen removal. Notwithstanding, some general information may be gained from the following observations fiom this study, and comparisons to other studies. For this system, the wastewater nitrogen removal mechanisms at work appeared to be primarily sedimentation, followed by ammonification. The ammonification of the settled solids is indicated by the increased concentrations of NH4-N in the water that was observed though out the study period. A similar condition was reported by Newman et al. (2000) for their system that was also under designed for its dairy wastewater load (Table 5.1). They attributed the increased (577%) NH4-N levels to plant senescence during the winter and low dissolved oxygen levels hindering oxidation of NH4-N to nitrate. Following plant senescence Newman et al. (2000) reported significant increases in NH4-N concentrations, and attributed this to the wetland waters purging NH4-N during the mineralization of un-harvested plant material. In the Schaafsma et al. (2000) study, they reported (Table 5.1) significant reductions in organic-N and m - N with removals of 98% and 56% respectively. This, however, coincided with an expected significant increase (82%) in N03-N concentrations. The conversion of m - N to N03-N was found to occur in the well-oxygenated filter strip following the wetland cells, and not in the wetland cells that had low dissolved oxygen levels. Therefore, the limiting factor to removing NH4-N in this, and the other studies discussed above, appears to be the low oxygen levels in the wetlands. Schaafsma et al. (2000) suggested that following their filter strip and the associated re-oxygenation of the water column, there now needed to be an anaerobic environment conducive to denitrification. To accomplish this, they recommended either recirculation of wastewater through the wetland cells to promote
86
denitrification and uptake of nutrients by plants, or the addition of another deep anaerobic wetland cell downstream of the system. 5.6.
PHOSPHORUS REMOVAL Trends for both OP and TP removals (Figure 4.1 1 and 4.12) in the wetland system
displayed a general increasing removal fi-om the July startup until the month of December. This was then followed by a sharp drop in removal percentages in January, and then elevated discharges in the spring. Those factors leading to the increasing removal rates from the time of summer startup to the middle of the winter would most likely include the continued vegetation establishing growth and the increasing dissolved oxygen trend. As for the sharp January drop in removals, this may be best explained by a nearly full capacity settling basin and lack of plant uptake. Springtime sampling only accounted for TP in April and May, which had general increased discharge. The exception was in May when the wetland cells recorded a positive removal efficiency, which is best explained by the startup of the growing season. It is during the rapid growth period in the spring that large quantities of phosphorus are taken up by the aquatic plants. Phosphorus removals in this study were much lower than that reported in the similar studies carried out by Schaafsma et al. (2000) and Newman et al. (2000). These can be attributed to the amount of soil surface area available for phosphorus soil adsorption and precipitation of solid phosphorus. By comparing the wetland cell total areas to the phosphorus removal rates it can be easily seen that as the total area increases so do the removal rates. Soil adsorption has been stated as one of the main removal pathways for dissolved phosphorus (Herskowitz et al. 1987, Kadlec and Knight 1996) and the results
87
of this and the other dairy studies would indicate this to hold true for dairy milkhouse wastewaters as well. 5.7.
COLD WEATHER EFFECTS
The most obvious and inevitable effect of the cold weather months is the lowering of water temperatures fi-om the fall into the winter season. Coldest temperatures were observed in late December with an increasing trend into the spring (figure 4-1). The major event bringing forth the increasing temperatures in the winter occurred with the onset of ice and snow cover. The ice and snow provided insulation between the water and the colder ambient air fiom the beginning of January until mid February. The insulating effect produced by the ice was also evident by the water temperature drop in March after the ice melted. When the ice melted in March the water temperatures dropped as much as 5 "C in the wetland. Solids removal in the constructed wetland did not appear to be affected by the colder temperatures as the months of November and December had some of the highest (92.5% and 94.6% for TSS) removal efficiencies. This was followed by two months of the lowest (77.7% and 70.4% TSS) removal efficiencies. These two months of lower solids removals coincide with the occurrence of ice and snow cover. During the presence of the ice it was observed that short-circuiting within the cattail stands and along the side slopes was occurring. In addition, there was a decrease in water depth w i t h the wetland cells due to the presence of ice. Similar findings were reported by Herskowitz et al. (1987). These conditions in turn decrease the detention time allowed for solids removal mechanisms to act upon the solids.
88
Organics removal by the wetland system, as represented by BOD, reached the lowest percent removals during the winter months (Figure 4.6). This decrease may be attributed to a combination of short-circuiting due to the ice and a decrease in biological activities during colder temperatures. Reduced removals were not attributed to oxygen availability, as observed dissolved oxygen levels were the highest recorded for the entire study period. The only nitrogen parameter indicating a possible cold weather effect was that of organic-N (TKN). As discussed previously, the removal of TKN was closely related to that of solids removal. Therefore, during the ice induced short circuiting period the additional solids being washed through the system may have had an organic-N content that could explain the decreased TKN removal rate. The other two nitrogen parameters, m - N and N03-N displayed no general seasonal trends during the entire study period. However, cold weather effects, if any, would have been masked by heavy loadings. Both TP and OP had the greatest removal percentages recorded during the month of December in this study. The main cold weather action that may have contributed to this is the increased re-aeration rate created by colder waters. During periods of higher dissolved oxygen levels P becomes less soluble (Welch and Lindell, 1992), and therefore may have complexed with the solids and settled out during this time. The occurrence of higher oxygen levels could not be confirmed in ths study due to a malhctioning DO meter during the month of December. Another action working to increase TP and OP removals may have been in connection with increased solids removal rates.
It was during the month of
December 1994 that both the settling basin and wetland recorded some of their highest
89
removal efficiencies concurrently to produce the month with the highest total system removal efficiency for the study period.
5.8.
OVERALL OBSERVATIONS
In this study a detailed analysis of the design parameters for a cold region constructed wetland for treating high strength dairy wastewaters was not accomplished. The reason for this is the complications brought on by the initial under estimation of the waste load and the inability to properly maintain the pretreatment settling basin. This lack
of proper maintenance resulted in excess solids, and the associated nutrients, entering the wetland cells. The wetland cells were not designed for these variable and high loading levels. Therefore, the current design equations could not be fully evaluated. Evaluations of nitrogen and phosphorus removals were particularly difficult to evaluate. This was due to their presence in the excess solids spilling over into and settling within the wetland cells. Once in the cells these nutrients can reenter the wastewater above after undergoing biodegradation processes present within the benthic material. The result is a wetland soil with a higher potential of becoming a source of nitrogen and/or phosphorous at some point in the future when favorable environmental conditions become present. What was learned from this study was that the wetland cells had a great ability to either maintain or quickly rebound fiom these excessive solids loading periods upon the reestablishment of a fully functioning settling basin during the first year of operation of the wetland system. This rebound ability was demonstrated by the removal efficiencies of solids and organics. Additionally, it was observed that the entire current system as a whole (settling basin with wetland cells) was able to reduce large volumes of solids and organics from the wastewater in a fairly small area. The amount of overall reductions
90
attained were those desirable for primary treatment (i.e., approximately 50% reduction in solids and organics), even in the winter months. Due to these positive results it is believed that with some modifications to the current system and some accompanying operational changes the system could be designed to provide efficient primary and possibly some secondary treatment of solids and organics. Nutrient treatment capacity of milkhouse wastewater by constructed wetlands still needs further investigation. 5.9.
DESIGN ALTERNATIVES
One of the greatest impacts that could be made at this dairy would be to remove as much milk fiom the waste stream as possible. To do this the dairy should be analyzed to determine if there are current best management practices applicable to the current dairy. The value of a potential best management practice would be determined by the amount of milk that would be eliminated from the wastewater. This type of analysis was not within the scope of this study, but would be suggested for fbture projects. The additional value attained by such a system analysis would be the ability to more accurately determine the loading characteristics of the wastewater, and design a treatment system accordingly. The most apparent change required of the current system would be changes to the settling basin. What is needed is more reliable primary treatment system so that the constructed wetland may be protected. Two possible options would include the addition of another basin, either in parallel or in series. In a parallel system, the additional basin could be put into service when the other basin was becoming full and waiting for maintenance. This would provide a system that is more flexible and better accommodates the time constraints of the farmer. Alternatively, a series primary
91
treatment system allows for additional settling volume as well as provides an opportunity for re-aeration and volatilization to occur. This was indicated in the generally successful Schaafsma et al. (2000) study in which two settling basins in series were used instead of one. Furthermore, the additional basin would provide a buffer during those times when the maintenance of the settling basin is insufficient. This would decrease the spilling over of solids to the wetland cells and protect their life expectancy. An additional option might be a combination of the two. To minimize the land requirements, this third option could consist of two parallel basins in series with a single secondary basin. During the study, the basin provided solids settling and wastewater mixing, such that the fats of the milk appeared to be almost completely mixed in with the other solids. Those fats that did float to the top were generally kept within the basin area by the production of a slime layer on top of the water. The slime layer did not generally discharge to the wetland cells as it was held within the basin area by the dense cattail stands. To ensure that the lighter solids, fats and scum layer do not leave the first sedimentation basin Hamoda and Al-Awadi (1995) suggest to include a scum baffle. It should consist of a baffle that would extend above and below the water level. This type of device would most likely helped in this study as fats and scum were observed to exist in thick layers at times and were not fully retained within the settling basin area. It was also apparent during the study that the current wetland area needed to be increased. Oldfield (1996) recalculated the required area needed for a constructed wetland system to treat the wastes generated at this site to meet secondary discharge requirements. She calculated a total area of 0.43 ha, based upon an organic loading design of 110 Kg BODS/ha/d. This would be an area 15 times larger than the current
92
wetland system. Not only would this be cost prohibitive, but is not possible for this or most dairy sites. However, given the preceding suggestions for changes to the settling basin, it is assumed that the wetland cells would produce results closer to the desired secondary treatment. Additional suggestions of possible ways of reducing the amount of wetland area required are given below.
It has been suggested that the amount of wetland area required for adequate secondary treatment could be reduced by the addition of shallow, open water areas along the wetland. These open water areas would increase reaeration rates at the water surface as well as provide better volatilization of ammonia (Hammer, 1989). These additional open waters between wetland cells would result in an alternating aerobic and anaerobic environment, which would be most conducive to nitrogen removal. Additional considerations should be given to the water use or other natural treatment systems for treatment of the wetland effluent discharges. Uses of the effluent could include irrigation with waters having some fertilization value during the warmer months. Other natural treatment options could include infiltration strips and grass filter strips for finishing treatment (Simeral, 1998). These options would require the appropriate topography for easy installation and low maintenance and additional land area. Additionally, they would need to be designed, if possible, so that they could be operated in cold climates. Also noted in the results of this study, is the indication that a considerable amount of decomposition of solids within the settling basin may occur releasing soluble nitrogen and phosphorus compounds. This release in turn requires additional surface area for
93
attaining secondary treatment. To reduce this need, it may be financially appropriate to include in the design a more permanent removal system that could be operated more frequently and thus before nutrient releases could occur. In order to handle the solids produced in this study a heavy-duty pump, such as a slurry pump, may be most appropriate. Upon the removal of these solids they would require some type of treatment or disposal. Initial treatment of the solids could include gravitational de-watering if the solids were pumped to a solids basin elevated above the settling basin. This would allow the leachate draining from the solids basin to be collected and discharged back to the settling basin for treatment. Other solids treatment alternatives might include composting
(Rynk et al., 1992) or land spreading, both of which can be valuable products to the fanner. Solids removed during this study were discarded on the outside sideslopes of the settling basin. These solids showed great promise for compost treatment, as they appeared fully composted within three to five months after being removed, even without proper pile design and construction. This may be attributed to the large amounts of bedding material (wood chips) contained in the removed settled solids. Wood chips are a recommended carbon and bulking material in the design of compost piles (Rynk et al., 1992), and apparently functioned as such here.
94
CHAPTER 6 CONCLUSIONS AND RECOMMENDATIONS
6.1 CONCLUSIONS One of the primary objectives of this research was to determine the treatment capacity of high strength milkhouse wastewater by a constructed wetland. The data presented in the previous chapters show that when the settling basin was under proper maintenance it attained primary treatment in the range of 59-79% solids removal and a
16-42%organics removal before discharging to the constructed wetland cells. This organic removal range fell short of the desired 35% reduction even when the settling basin was under proper maintenance. This in turn lead to the less than desired treatment performance for solids and organics in the wetland cells. The primary reason for the current system not achieving secondary treatment levels is that the BOD5 concentration and the wastewater volume were underestimated by factors of 1.9 and 6.2 respectively. These underestimations resulted from incomplete information concerning the dairy operations. As a result, the conclusions of this study are that the current settling basin and constructed wetland designs and sequences are not adequate for the treatment of dairy milkhouse wastes. Given the waste load from the milkhouse and using BOD design equations the current system would have to be 6 time larger than it is. For this site, the appropriate amount of land area for the treatment system is not available. This leads to the need for various alterations to the current system. These alterations would not only include increasing the sizes of the settling basin and wetland cells, but to include some combination of best management practices and other primary treatment apparatuses.
95
Some suggestions that might be used for this site are included in the recommendations section to follow. Nitrogenous compounds in the milkhouse wastewaters were found to be very high. The levels were such that adequate treatment of the wastewater would appear to be limited by the treatment of the nitrogenous compounds. In this study the high BOD levels restricted the available dissolved oxygen available for the conversion of NH4-N to N03-N through the process of nitrification, which requires the presence of oxygen. This lead to high levels of NH4-N in both the settling basin and wetland cells effluent. Additionally, the mineralization of the organic-N produced additional NH4-N in the wastewaters, resulting in NH4-N levels withm the treatment system above that of the milkhouse effluent concentrations. It would appear from the results of this study, that the treatment of nitrogen to desirable effluent levels would be the most limiting factor in a system design. To address this problem, various types of nutrient reduction design modifications will be presented in the next section. Phosphorus retention was accomplished with the current treatment system to an extent. However, the level of treatment desired was not accomplished. It would appear that given an adequately sized constructed wetland area, based upon BOD removal design, considerable phosphorus removal could be attained with the current system design. Due to inadequate solids maintenance during the study period this observation could not be confirmed. Other observations were noted with the wetland vegetation and the financial needs of the system. The wetland’s cattail vegetation was easily established from seed to an extent that the cattail transplants would not have been necessary for vegetation
96
establishment. Furthermore, the cattails were able to withstand the high NH4-N and organic loading levels, as observed from the growth of dense vegetation stands with little sign of stress. The success of the seeding would reveal a means of cost savings for future plant establishment needs. Costs associated with the building and maintaining the settling basin and constructed wetland were well contained in the dairy f m e r s physical and financial abilities. Maintenance requirements were easy, inexpensive and infrequent. A larger settling basin would further decrease the settling basin maintenance and cost requirements in the long term. Even better for the site would be the addition of a parallel settling basin to decrease the maintenance requirements for the farmer. One of the greatest lessons learned from this project is the need for accurate characterization of the wastewater to be treated. This will require a very thorough understanding of the dairy as some waste generation processes may be perceived as small by the dairy personnel and therefore not be reported. These unreported wastes may actually have large impacts to the actual waste load. The greatest reason for t h s is the potential of milk, which has a very high BOD of 100,000 mg/L, to enter the waste stream in various places. This was found to be true in this study. Therefore, the system designer must become h l l y knowledgeable about all potential waste generation processes to make sure that all wastes are accounted for in the waste load calculation. Another important observation of this study is the need for reliable solids removal mechanisms. The solids removal portion of the system, prior to wetland cells, must be one that is dependable if the wetland cells future performance is not to be impeded. Solids, if not removed before entering the wetland cells, produce a future nutrient cycling source in the wetland cells.
97
The general result of this is a dramatically increased wetland area needed to compensate for a small problem in the primary treatment portion. Given the lack of experiences with the application of constructed wetland technology to high strength wastes it is most apparent that additional research is needed, along with more innovative designs and configurations. 6.2 RECOMMENDATIONS
The recommended treatment scenario for milkhouse wastewater would initially require a solids removal system that meets the farmers maintenance abilities, and is designed to anticipate problems. Due to the high loading rates of milkhouse wastewater, much damage to the system performance can be done due to a non-hnctioning settling basin. It would be recommended that the settling basin consist of two or more continuous deep basins in parallel. These basins should also include scum baffles in order to retain the lighter solids, fats and scum from leaving the basins. If these basins are sufficiently sized, the time and cost
of maintaining the basins could be decreased. Another alternative would be to have a solids pump or other available appropriate solids removal device so that solids could be removed on a more frequent basis. The cost and maintenance of the solids removal device would be weighted against the nutrient reduction benefits received by removing the complexed nutrients before they become dissolved. Once removed the solids need to be properly managed. Best management practices most applicable would include land spreading or composting. Recommended changes to the wetland portion of the system would be as follows. During the first year of operation and prior to the full establishment of the wetland vegetation, the installation of deflection boards along the side slopes of the cells would help decrease the
98
short circuiting that can occur along the sides. To enhance the removal of nutrients within the wetland cells, the cells could be separated by stretches of shallow, open water areas. These areas would allow greater reaeration of the water, which would be more conducive to nitrification, followed by denitrification in the more anaerobic wetland cells down stream. The number and placement of these shallow open waters has not been studied. Another option to investigate would include the recirculation of the wastewaters back to the anaerobic wetland cells. This option would attain some of the same goals of providing anaerobic and aerobic conditions, however the greatest setback would be the associated costs of purchasing, maintaining and operating this type of system. Recommendations for future studies can also be provided due to the lessons leamed during this study. The primary one is the need to understand the fate and transport of nitrogen through a constructed wetland treating milkhouse wastewater. One of the additional water parameters necessary to accomplish this would be testing for Nl3OD along with BOD. Attaining this additional information would give the investigator an indication of the system organisms' presence and ability to accomplish nitrogen reductions. Given this information one may get some indication of the true advantage of including an alternating anaerobic and aerobic sequence to the wetland cells.
99
REFERENCES APHA. 1992. Standard methods for the examination of water and wastewater, 18th Edition, New York, NY. Allen, H. H., Pierce, G. J., and R. V. Wormer. 1989. Considerations and techniques for vegetation establishment in constructed wetlands. In: Constructed wetlands for wastewater treatment, municipal. industrial and agricultural. Hammer, D. A. (Ed.), Lewis Publishers, Ann Arbor, MI. pp. 405-415. Benham, B. L. and C. R. Mote. 1993. Treating dairy waste utilizing laboratoryscale constructed wetlands. Presented at the Dec. 14-17, 1993 International winter meeting of the American Society of Agricultural Engineers, Paper No. 932576. ASAE, 2950 Niles Rd., St. Joseph, MI 49085-9659 USA. Brodie, H. 1989. Irrigation systems for dairy manure. In: Dairy manure management. Proceedings of the dairy manure management svmposium. Feb. 2224, 1989. pp. 195-203. Chang, A. C., Olmstead, W. R., Johanson, J. B. and G. Yamashita. 1974. The sealing mechanism of wastewater ponds. J. Water Pollution Control Fed. 46(7): 1715-1721. Clark, R. N. 1975. Seepage beneath feedyard runoff catchments. In: Managing livestock wastes, Proceedings 3rd International symposium on livestock wastes 1975. American Society of Agricultural Engineers. Crites, R. W., Gunther, D. C., Kruzic, A. P., Pelz, J. D., and G. Tchobanoglous 1988. Constructed wetlands and aquatic plant systems for municipal wastewater treatment. Design manual. EPA/625/1-88/022. Danalewich, J. R., T. G. Papagiannis, R. L. Belyea, M. E. Tumbleson and L. Raskin. 1998. Characterization of dairy waste streams, current treatment practices, and potential for biological nutrient removal. Water Research, Vol. 32, NO. 12. pp. 3555-3568. Davis, M. L. and D. A. Cornell. 1991. Introduction to environmental McGraw-Hill, Inc., NY. engineering. Davis, S., W. Fairbank, and H. Weisheit. 1973. Dairy waste ponds effectively self-sealing. Transactions of the ASAE 16(1): pp. 69-71. Dobberteen, R. A., and N. H. Nickerson, 1991. Use of created cattail (Typha) wetlands in mitigation strategies. Environmental Management, vol. 15, No. 6, pp. 797-808.
100
Faulkner, S. P. and C J. Richardson. 1989. Physical and chemical characteristics of freshwater wetland soils. In: Constructed wetlands for wastewater treatment, municipal, industrial and agricultural. Hammer, D. A., (Ed.), Lewis Publishers, Ann Arbor, MI. pp. 41-72. Gersberg, R. M., B. V. Elkins, S. R. Lyon, and C. R. Goldman. 1986. Role of Aquatic plants in wastewater treatment by artificial wetlands. Water Res. 20:363368. Guntenspergen, G. R., F. Steams, and J. A. Kadlec. 1989. Wetland vegetation. In: Constructed wetlands for wastewater treatment, municipal, industrial and agricultural. Hammer, D. A. (Ed.), Lewis Publishers, Ann Arbor, MI. pp. 73-88. Hammer, D. A. 1989. Designing constructed wetland systems to treat agricultural nonpoint source pollution. Ecological Engineering. Elsevier Science Publishers BV Amsterdam., pp.49-82. Hammer, D. A. and R. K. Bastian. 1989. Wetlands Ecosystems: Natural Water Purifiers? In: Constructed wetlands for wastewater treatment. municipal, industrial and ajq-icultural. Hammer, D. A. (Ed.), Lewis Publishers, Ann Arbor, MI. pp. 5-19. Hammer, D. A. 1993. Designing constructed wetlands systems to treat agricultural nonpoint source pollution. In: Created and natural wetlands for controlling nonpoint source pollution. Magnolia Publishing, Orlando, FL. pp. 7 1111. Hamoda, M. F., and S. M. Al-Awadi. 1995. Wastewater management in a dairy farm. Water Science Technology, Vol. 32, No. 11, pp. 1-11. Herskowitz, J., S. Black, and W. Lewandowski. 1987. Listowel artificial march treatment project. In: Aquatic plants for water treatment and resource recovery. K. R. Reddy and W. H. Smith, (Eds.). Magnolia Publishing, Orlando, FL. Holmes, B. J., Doll, B., Rock, C. A., Bubenzer, G. D., Kostinec, R. A., and L. R. Massie. 1995. Experiences with two constructed wetlands for treating milking center wastewater in a cold climate. Submitted: Animal waste and the land-water interface conference. Johnston, C.A. 1993. Mechanisms of Wetland-Water Quality Interaction. In: Constructed wetlands for water quality improvement. G.A. Moshiri (Ed.). CRC Press, Inc., Boca Raton, FL. Jones, H. R. 1974. Pollution control in the dairy industry. Noyes Data Corporation, Park Ridge, New Jersey. pp. 45-47.
101
Kadlec, R. H. 1988. Northern natural wetland water treatment systems. In: Aquatic plants for water treatment and resource recovery, K. R. Reddy and W. H. Smith, (Eds.). Magnolia Publishing, Orlando, FL. Kadlec, R.H. and R.L. Knight. 1996. Treatment wetlands. CRC Press, Inc. Boca Raton, FL. Krider, J. K. and W. H. Boyd. 1992. SCS technical requirements for constructed wetlands for agricultural wastewater treatment. Presented at the Dec. 15-18, 1992 International Winter Meeting of the American Society of Agricultural Engineers, Paper No. 924523. American Society of Agricultural Engineers, 2950 Niles Rd., St. Joseph, MI 49085-9659 USA. Miller, G. 1989. Use of artificial cattail marshes to treat sewage in Northern Ontario, Canada. In: Constructed wetlands for wastewater treatment. municipal, industrial and agricultural. Hammer, D. A. (Ed.), Lewis Publishers, Ann Arbor, MI. pp. 636-642. Millet Associates. 1997. Personal communication. 3/12/97. Hermon, ME 04401. (207) 848-2734. Murhy, T. J., Zaginaylo, J., and F. Geter. 1993. Design and construction of a wetland to treat veal waste. Presented at the 1993 International Winter Meeting of the American Society of Agricultural Engineers. Paper No. 932577. ASAE, Saint Joseph, MI. Newman, J. M., and J. C. Clausen. 1997. Seasonal effectiveness of a constructed wetland for processing milkhouse wastewater. Wetlands, Vol. 17, No. 3, September 1997, pp. 375-382. Newman, J. M., J. C. Clausen, and J. A. Neafsey. 2000. Seasonal performance of a wetland constructed to process dairy milkhouse wastewater in Connecticut. Ecological Engineering 14, pp. 18 1- 198. Niering, W. A. 1987. Wetlands. The Audubon Society Nature Guides. Alfred A. Knopf, Inc. New York. Oldfield, M. K. 1996. Constructed wetland and aerobic lagoon use in the treatment of dairy milkhouse wastewater in Maine. Graduate Thesis, University of Maine, Orono, ME. Perle, M., Shlomo, K. and G. Shelef. 1995. Some biochemical aspects of the anaerobic degradation of dairy wastewater. Wat. Res. 29, No. 6. pp. 1549-1554.
102
Ralph, J. P., and S. J. Palmer. 1989. Wetlands microbiology: Form, function, processes. IN: Constructed wetlands for wastewater treatment, municipal, industrial and agricultural. Hammer, D. A. (Ed.), Lewis Publishers, Ann Arbor, MI. pp.89-105. Reaves, R. P., DuBowy, P. J., Jones, D. D. and A. L. Sutton. 1995. Constructed wetland treatment of animal waste in Indiana: Management implications. IN: Clean water - Clean environment - 21st century. Volume 11, Nutrients. American Society of Agricultural Engineers. St. Joseph, MI. Reddy, K. R. and T. A. DeBusk, 1987. State-of-the-art utilization of aquatic plants in water pollution control. Water Sci. Tech., vol. 19, No. 10, pp. 61-79. Reed, S. C. and D. S. Brown. 1992. Constructed wetland design -- The first generation. Water Environment Research, Alexandria, VA. Sept./Oct. V. 64 (6) pp. 776-781. Reed, S. C., Middlebrooks, E. J. and R. W. Crites. 1988. Natural systems for waste management and treatment. McGraw-Hill Book Co., NY. Rynk, R. 1992. On-Farm Cornposting Handbook. Northeast Regional Agricultural Engineering Service, Cooperative Extension, Ithaca, NY. Schaafsma, J. A., Baldwin, A. H. and C. A. Streb. 2000. An evaluation of a constructed wetland to treat wastewater from a dairy farm in Maryland, USA. Ecological Engineering, 14, pp. 199-206. Schwer, C. B. and J. C. Clausen. 1989. Vegetative filter treatment of dairy milkhouse wastewater. J. Environ. Qual. 18:446-451. Simeral, K. D. 1998. Using constructed wetlands for removing contaminants from livestock wastewaters. Ohio State University Fact Sheet. Available at: http ://ohioline.ag.ohio-state.edu/a-fact/0005.html. Steiner, G.R. and R. J. Freeman. 1989. Configuration and substrate design considerations for constructed wetlands wastewater treatment. In: Constructed wetlands for wastewater treatment, municipal, industrial and amicultural. Hammer, D. A., pp. 363-377. Steiner, G. R., Watson, J. T., and K. D. Choate. 1991. General design, construction, and operation guidelines: Constructed wetlands wastewater treatment systems for small users including individual residences. Technical report series for Tennessee Valley Authority. T V A " Q - - 9 1/2,23pp. Steiner, G. R. and T. J. Watson. 1993. General design, construction, and operation guidelines: Constructed wetlands wastewater treatment systems for
103
small users including individual residences. Second Edition. Technical report series for Tennessee Valley Authority. TVA/WM--93/10,42pp. Stengel, E. and R. Schulz-Hock. 1989. Denitrification in artificial wetlands. In: Constructed wetlands for wastewater treatment. municipal, industrial and agricultural. Hammer, D.A. (Ed.), Lewis Publishers, Ann Arbor, MI. pp. 484492. Tanner, C. C., Clayton, J. S. and M. P. Upsdell. 1995. Effect of loading rate and planting on treatment of dairy farm wastewaters in constructed wetlands - I. Removal of oxygen demand, suspended solids and fecal coliforms. Wat. Res. Vol. 29, NO. 1, pp. 17-26. Tchobanoglous, G. and F. L. Burton. 1991. Wastewater engineering: treatment, disposal, and reuse. Metcalf & Eddy, Inc., 3rd Ed. McGraw-Hill, Inc., NY. Ulmer, R., Strong, L., Cathcart, T., Pote, J. and S. Davis. 1992. Constructed wetland site design and installation. Presented at the Dec. 15-18, 1992 American Society of Agricultural Engineers International Winter Meeting, Nashville, TN. USDA- National Agricultural Statistics Service, 1999. 1997 Census of agriculture, rankings of states and counties. National Agricultural Statistics Service, US Department of Agriculture, report AC97-S-2. May 1999. Washington, DC, USA. U.S. Environmental Protection Agency. 1988. Constructed wetlands and aquatic plant systems for municipal wastewater treatment. Design Manual, EPA 625/188/022, U.S. EPA, Washington, DC. U.S. Environmental Protection Agency, 1993, Guidance specifying management measures for sources of nonpoint pollution in coastal waters. Office of Water, Washington, DC. EPA-840-B-92-002. Vrhovsek, D., V. Kukanja and T. Bulc. 1996. Constructed wetland (CW) for industrial wastewater treatment. Water Research, Vol. 30, No. 10, pp. 2287-2292. Watson, J. T., Reed, S. C., Kadlec, R. H., Knight, R. L., and A. E. Whitehouse. 1989. Performance expectations and loading rates for constructed wetlands. In: Constructed wetlands for wastewater treatment, municipal, industrial and agricultural. Hammer, D. A. (Ed.), Lewis Publishers, Ann Arbor, MI. pp. 3 19351. Welch, E.B. and T. Lindell. 1992. Ecological effects of wastewater: Pollution in fresh water svstems. Chapman & Hall, NY.
104
BIOGRAPHY OF THE AUTHOR
Robert Kostinec was born in Omaha, Nebraska on July 17, 1963. He was raised in Fremont, Nebraska and graduated from Fremont Senior High School in 1982. He attended Wayne State College and graduated in 1986 with a Bachelor’s degree in Biology and a minor in Chemistry. Later, he attended the University of South Dakota at Vermillion and graduated with a Master’s degree in Biology with a concentration in fisheries science in 1992. Following this he attended the University of Nebraska at Omaha to take a full year of undergraduate preengineering courses. In the fall of 1992 he entered the Civil and Environmental Engineering graduate program at the University of Maine. After receiving his degree, Robert will continue his work in the remediation division of the Minnesota Pollution Control Agency. Robert is a candidate for the Master of Science degree in Civil Engineering from The University of Maine in May, 2001.
105