Stephen F. Austin State University, Nacogdoches, TX1;. NASA Ames Research Center, Moffett Field, CA2. ABSTRACT. Our previous experiments with additive ...
Contrast measures for predicting text readability L. F. V. Scharff 1, and A. J. Ahumada Jr.2; Stephen F. Austin State University, Nacogdoches, TX1; NASA Ames Research Center, Moffett Field, CA2. ABSTRACT Our previous experiments with additive and multiplicative transparent text on textured backgrounds show that readability can be more accurately predicted by adjusting the contrast with a contrast-gain-like divisive factor that includes the background RMS contrast. However, the factor performed poorly at predicting readability differences on two different patterned backgrounds. Using the same images of the previous study we presented the target words alone and single letters cut out of the target words. We found that word identification and word discriminability was affected by the backgrounds in the same way that the paragraph search performance was affected, but that letter identifiability on these two backgrounds was predicted by the metric. We also found a significant improvement from including different contrast gains for positive and negative contrasts in the metric. Unfortunately, word readability is not necessarily simply related to letter identifiability and simple contrast measures. Keywords: text readability, text contrast, visual masking
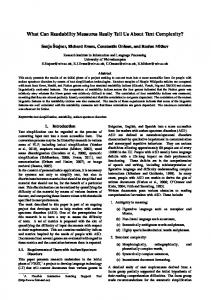
1. Introduction Scharff and Ahumada 1 measured text readability for two types of transparent text: additive (as occurs in head-up displays) and multiplicative (which occurs in see-through LCD virtual reality displays). These two types of transparency resulted in polarity differences: additive text was lighter than the background (positive polarity), and multiplicative text was darker than the background (negative polarity). Text contrast and background texture were also manipulated. To predict their results, Scharff and Ahumada1 used a contrast metric similar to their earlier Global masking metric2, 3. Their adjusted masking index, C = CT / (1 + (CRMS/C2) 2 ) 0.5 , combined text contrast CT (with respect to the image luminance) and the image RMS contrast CRMS. The earlier global masking metric computed text contrast with respect to the average background luminance and only used the background contrast in the divisive masking term. Because the contrast of the experimental conditions was defined relative to the background, the global metric predicted no effect of text polarity. The adjusted metric correctly predicted the direction but under-predicted the magnitude of the polarity effect, improved performance for the negative contrast text as compared with the positive contrast text. Neither metric correctly predicted which background texture would be the most detrimental to readability. They predicted that the “wave” pattern (Figure 1, center, shown with multiplicative transparency text at 45% contrast) would be more detrimental than the “culture” background (Figure 1, left, shown with additive transparency text at 45% contrast) because the wave background had a larger RMS contrast (0.27 and 0.15, respectively). In fact, the additive culture pattern was the most difficult condition to read. (Graphs of these previous results are included in Figures 3 and 4 [below] for comparison with the current results.)
1
Figure 1. Sample background patterns with text used in the transparent text experiment : (left) culture pattern with additive text at 45% contrast, (center) wave pattern with multiplicative text at 45% contrast, and (right) plain background with additive text at 30% contrast. Each example was cut from the top left corner of an actual stimulus.
One explanation for the discrepant pattern difference is that the spatial homogeneity of the culture pattern made it difficult to read any of the letters, while the large plain areas in the wave pattern allowed some letters to be seen clearly, although other letters were difficult to identify. The task in the original text readability experiment was to find one of three target words (triangle, circle, or square) located within paragraphs of text placed on textured backgrounds. In the current experiment, the target words were cut from the original text stimuli, so that the backgrounds exactly matched those in the original conditions. Participants performed two word tasks: an identification task, and a discrimination task using decoy words also cut from the original text stimuli. These two word experiments were used in an effort to differentially weight different aspects of the original task that might have led to the difficulty with the additive transparency, low contrast, culture-pattern condition. The word identification task more directly measured readability of the specific target words, regardless of the other words around them. The discrimination task required higher-level cognitive processing that occurs when comparing words in order to determine which is the target. The target words were also chopped up so that the legibility of the individual letters could be measured. If a letter is in a constant region of the background, the metric will now only consider that region and not reduce its equivalent contrast because of contrast variation elsewhere in the background.
2. Methods 2.1.
Participants
Twenty-eight participants completed all of the word tasks. Half of these participants completed the letter task for the additive transparency condition, while the remaining 14 did so for the multiplicative condition. An additional 2 participants completed the letter experiment, so that there were 15 for each transparency type. All participants were undergraduate psychology students who received course research participation credit.
2.2.
Stimuli and Procedure
For all experiments, the words and letters were cut from the original transparent text stimuli, so that the way they were placed on a specific part of the background was identical to the original conditions1. See Figure 2 for examples of cutout
words and letters. As in the original experiment we used all combinations of additive and multiplicative transparency, the plain, culture and wave backgrounds, and 30% and 45% text contrast.
Figure 2. (Top.) One each of the three target words cut from the three background patterns. (Bottom.) These same words chopped into letters. All examples are of additive transparency with 30% contrast placed on a plain background of the average luminance of the patterned backgrounds.
In addition to the above three variables (transparency type, pattern behind the word, and contrast), the word identification task experiment included an additional variable, the background upon which the word was pasted. The background was either a plain background of the same average luminance as that used in the original experiment (~47 cd/m2), or the background matched the background behind the word. Each of these background conditions included all the target words (six trials for each condition, each of the three target words used twice). Note that, for the plain background cases, the words were cut from the three backgrounds in the original experiment, so 1/3 had the wave pattern in a small rectangular area behind the word, another 1/3 had the culture background, and the final third had the plain background, so it blended smoothly with the larger background. For the patterned background condition, each word was placed so that the background pattern behind the word matched the larger background. Thus, the placement of the words was not perfectly centered, but varied somewhat across the trials. In order to make the word identification tasks as similar as possible other than the larger background patterns, the target word placement was also varied around center when using the plain backgrounds. As in the original experiment, there were three shapes at the bottom of the screen, and the participant’s task was to click on the corresponding shape as quickly as possible. Transparency type and the large background conditions were blocked, but word background pattern and contrast were randomized within each block. The word discrimination task experiment required that the participants make a forced-choice decision regarding whether or not the presented word was one of the three target words (triangle, circle, or square), or one of six other words also cut from the original stimuli. These decoy words were chosen to be similar to the target words: financial, telephone, crisis, cities, shared, and soured. All words were individually placed in the center of a plain background of the same average luminance as that used in the original experiment (~47 cd/m2).
For the letter task, each of the target words (six each for all conditions) was chopped so that the letters could be tested for identifiability on the original textured backgrounds. Due to testing time constraints, transparency type was blocked and run as a between variable. Otherwise, letter presentation was randomized. For each trial, a small fixation square was presented, followed by the letter presented on a plain background of the same average luminance as that used in the original experiment (~47 cd/m2). The letter remained onscreen until the participant indicated its identity by typing it using a standard keyboard. Feedback was given on each trial by a text message that indicated the correct letter. Experiment order was counterbalanced. Half of the participants did the letter experiment first, and half did the word experiments first. The order of the word experiments was also counterbalanced across participants. Viewing distance was controlled and matched to the original experiment by using a headrest. Total testing time was approximately one hour.
3. Results For each participant, median reaction times for each condition were calculated for each of the experiments. A single 4way ANOVA was performed on the word identification data (type of large background, transparency type, background pattern behind the word, and contrast). There were two significant main effects, and four significant two-way interactions. See Table A1 for the summary table. The pattern behind the words significantly affected response times, so that the words placed on plain backgrounds were identified more quickly than those on either of the patterned backgrounds, and there were no differences for the two backgrounds behind the words. Low text contrast conditions were significantly slower than high contrast conditions. The large background did significantly interact with the pattern behind the words, as did transparency type and contrast. Finally, contrast interacted with transparency type. The wave pattern words placed on the wave pattern were significantly harder to identify than those placed on the plain background. The large background made no difference for the plain or culture pattern words. Culture pattern words presented using additive transparency were identified significantly slower than those presented using multiplicative transparency. Transparency type had no effect for the wave or plain pattern words. Similarly, the culture pattern words were identified significantly more slowly at the low contrast, while there was no effect for the wave or plain pattern words. Finally, the additive transparency conditions were significantly slower than multiplicative conditions only for the low contrast conditions. Contrast did not affect the multiplicative conditions. Figure 3 shows the 3-way interaction between transparency type, word pattern, and contrast. Large background is not shown as it was not manipulated in the word discrimination and letter experiments. A 4-way ANOVA was also performed on the word discrimination data (target v. decoy, transparency type, background pattern behind the word, and contrast). See Table A2 for the statistical summary table. As with the identification task, there were only significant main effects for word pattern and contrast, with plain pattern words and higher contrasts being discriminated more quickly. Contrast significantly interacted with transparency type, target/decoy, and word pattern. Further, transparency type and word pattern interacted. Similar to the word identification task, the additive transparency condition was significantly slower for the low contrast conditions, but the multiplicative conditions were not affected by contrast. Unlike the word identification task, both the wave and culture word patterns were significantly slower when using low contrast; again there was no effect of contrast for the plain conditions. Also similar to the word identification task, the culture word pattern led to slower discrimination for the additive transparency conditions; transparency type did not affect the multiplicative or plain word patterns. Both the target words and decoy words were significantly slower for the low contrast conditions; further, at low contrast the decoy words were discriminated more slowly than the target words, but there was no difference at high contrast. Figure 3 shows the 3-way interaction between transparency type, word pattern, and contrast. The target/decoy variable is not shown, as it was not manipulated in the word identification and letter experiments. For letter identification data a 3-way ANOVA was performed using transparency type (a between participants variable for the letter task), the pattern behind the letter, and contrast. For the letter identification summary table, see Table A3. There were significant main effects for contrast (low contrast slower) and pattern. The plain background led to significantly faster identification times than both patterns, but in contrast with the word tasks, the culture pattern letters led to significantly faster responses than the wave pattern letters. The only significant interaction occurred between letter pattern and contrast, with the plain pattern letters not affected by contrast, and the wave and culture pattern letters
both slower at the lower contrast. Figure 3 shows the 3-way interaction between transparency type, word pattern, and contrast.
Word Identification
Word Discrimination plain add plain mult wave add wave mult culture add culture mult
1.5
plain add plain mult wave add wave mult culture add culture mult
1.7
1.6
1.4
1.3
latency (sec)
latency (sec)
1.5
1.2
1.4
1.3
1.2
1.1
1.1
1
1 0.9
30%
45%
30%
45%
30%
45%
contrast condition
45%
Paragraph Search
Letter Identification 3.0
30%
contrast condition
plain add plain mult wave add wave mult culture add culture mult
plain add plain mult wave add wave mult culture add culture mult
60 50
2.5
latency (sec)
latency (sec)
40
2.0
30
20
1.5
10
1.0 30%
45%
30%
contrast condition
45%
30%
45%
30%
45%
contrast condition
Figure 3: Three-way interactions between transparency type, pattern, and contrast for word identification, word discrimination, letter identification, and for comparison, the paragraph word search task from Scharff and Ahumada1 . Error bars indicate 95% confidence intervals. Only for the letter identification task is the low contrast, additive transparency (open symbols), wave pattern (circle symbols) condition slower than the corresponding culture pattern condition.
4.Predictions We computed predictions for the above results based on the contrast measures described in Scharff and Ahumada1. Their contrast-based metrics were computed from the mean luminance and the average contrast variance in the image. As they pointed out, the display is not spatially homogeneous because of the space between the lines of text and the text margins. The observer’s gaze path was not monitored. And the observer’s spatial averaging functions for computing the effective mean luminance and the contrast variation are also unknown. Thus, the average percentage of text pixels in the regions controlling the mean luminance and the contrast gain are also unknown. Scharff and Ahumada1 effectively assumed that these regions are the same and derived a formula for the contrast metric as a function of the effective proportion of text pixels pT. They reported the performance of the metric for the value pT = 0, which gives the Global
masking metric, and for the value pT = 0.2, a value close to the proportion of text pixels in a word, ignoring the spaces between words, the lines between words, and the margins. Including the text pixels in the average value of the luminance level defining zero contrast reduces the contrast of the text in a nonlinear way: the contrast of positive contrast text is reduced more than the contrast of negative contrast text is increased. Including the text pixels in the average thus allowed the metric to correctly predict that the additive text was more difficult to read than the multiplicative text when the two conditions had the same contrast with respect to the background alone. However, with a value of pT = 0.2, a seemingly high estimate of the proportion of text pixels, the adjusted metric still predicted a much smaller polarity effect than was observed. Nonlinear averaging rules can lead to the less frequent text pixels being given more weight than their relative frequency would predict, so we decided to also look at the predictions of the metric for the case of pT = 0.5, which is the highest weight text pixels could obtain if the averaging rule is symmetric in contrast polarity and treats text and background in the same way. Similarly to Scharff and Ahumada1, we define T to be a vector (list of numbers) of the text pixel luminances with mean mT and variance vT, and we let B be the vector of background pixel luminances with mean mB and variance vB. We let pT represent the proportion of text pixels (the number of pixels in T over the number in T and B) and pB = 1-pT. As detailed in Appendix B in Scharff and Ahumada1, the average text contrast with respect to the average luminance is given by CT = mT /(pT mT + pB mB) -1. And, the pooled variance of the contrasts of all the pixels is given by CRMS2 = (pT vT + pB vB + pT pB (mT - mB) 2) / (pT mT + pB mB)2 . These are combined in a contrast-gain-control fashion to give a predicted effective contrast metric, C = CT / (1 + CRMS2/C22 ) 0.5. As before, we set the contrast masking threshold C2 to the to contrast value of 0.05. When we fit the above metric to the paragraph data, the best fitting value for pT was in the neighborhood of 0.8, which is difficult to explain when there are fewer than 50% text pixels. One possibility we considered was that the luminance response of the monitors used in that study may not have fit the simple gamma function used in the calibration. In the current studies with words and letters, only one monitor was used in each study and an empirical gamma function was used to accurately account for the entire luminance range. Another possibility is that the observer’s gains for positive and negative contrast are just not the same. We decided to allow for such an effect in the metric in a simple way: We included a contrast gain asymmetry factor A, used only when the contrast or the effective contrast is positive, C ← (AC), if C > 0. We used three values of pT, pT=0, pT=0.2, and pT=0.5 and looked at the symmetric predictions (A=1) and also searched for the best value of A for each value of the three values of pT for each of the four experiments. For the word and letter experiments, each metric value was computed for each stimulus separately. The condition prediction was then the mean of the metrics for all the stimuli in that condition. Table 1 shows for each of the four experiments and for each value of pT the value of A that gave the best correlation and rA, the value of that correlation. The correlation when A=1 is labeled r1 and the F values test the significance of the difference between rA and r1 : F = [ (rA2 – r12 ) / df1 ] / [ (1- rA2 ) / df2 ],
where the numerator degrees of freedom df1 is 1, from the one additional parameter estimated (A), and the denominator degrees of freedom df2=9 is the number of data points (12) less two for the regression parameters and less one more for the asymmetry parameter. The tabled results show a trade-off between the parameters A and pT in that when a larger value of pT is used, a smaller value of A is required. For the paragraph and word experiments, the improvement in fit from the addition of the asymmetry parameter is not significant, but for the letter experiment, the asymmetry factor makes a highly significant contribution even for the case of pT=0.5, where the best fitting value of the asymmetry parameter is very close to unity (A=0.85). For the letter experiment, the pT = 0, A = 0.49 fit is as good as those in any of the other experiments, but it is significantly worse than the non-zero pT fits, which are similar to each other and extremely good. Table 1: Metric goodness-of-fit (see text for explanation).
pT
A
rA
Paragraphs
0 0.2 0.5
0.677 0.801 0.867
-0.770 -0.734 -0.815 -0.758 -0.806 -0.768
Word search
0 0.2 0.5
0.889 -0.825 -0.822 1.056 -0.857 -0.853 1.129 -0.818 -0.781
0.144 0.220 1.642
Word 0 Discrimination 0.2 0.5
0.952 -0.776 -0.776 1.065 -0.858 -0.853 1.134 -0.840 -0.799
0.018 0.299 2.075
Letter Identification
0.490 -0.839 -0.724 0.774 -0.963 -0.835 0.851 -0.966 -0.887
5.50* 28.9*** 19.7**
0 0.2 0.5
r1
F 1.200 2.431 1.527
*F(1,9,0.95) = 5.12; **F(1,9,0.99) = 10.6; ***F(1,9,0.999) = 22.9.
Figure 4 shows the same latencies appearing in the abscissas of Figure 3 for each of the four experiments now plotted against the asymmetric adjusted metric with parameters set for the letter identification experiment (pT =0.2, A = 0.77). The plots illustrate that the metric does a good job of prediction for all experiments for the culture and plain backgrounds, but that only for the letter experiments do the observers actually perform worse on the wave background as the metric predicts.
Word Discrimination
Word Identification plain add plain mult wave add wave mult culture add culture mult
1.4
1.5
1.3
1.4
latency (sec)
latency (sec)
plain add plain mult wave add wave mult culture add culture mult
1.6
1.2
1.3
1.2
1.1
1.1
1 1
0.9 0.04
0.05
0.06
0.07
0.08
0.09
0.1
0.04
0.11
0.05
0.06
0.08
0.09
0.1
0.11
Paragraph Search
Letter Identification 3.0
plain add plain mult wave add wave mult culture add culture mult
plain add plain mult wave add wave mult culture add culture mult
60 50
2.5
40
latency (sec)
latency (sec)
0.07
index contrast
index contrast
2.0
30
20
1.5
10
1.0 0.04
0.05
0.06
0.07
0.08
0.09
index contrast
0.10
0.04
0.05
0.06
0.07
0.08
0.09
0.10
index contrast
Figure 4: Graphs of the average response latencies as a function of the asymmetric index contrast for word identification, word discrimination, letter identification, and for comparison, the paragraph word search task from Scharff and Ahumada1. Error bars indicate 95% confidence intervals for each condition. For all graphs, pT = 0.2, A = 0.77, C2 = 0.05.
5. Discussion and Conclusions Explanations have been provided for the problems encountered in our previous attempts to use the contrast gain model to predict text readability. With the simple contrast gain asymmetry modification, the adjusted masking metric of Scharff and Ahumada1 was a very good predictor of letter identifiability. It may not predict word identifiability when there is large variation in letter identifiability, because the combination rule from letters to words is not linear. As an extreme case of what we believe to be the reason that the metric worked poorly with the “wave” background, imagine a background of black and white vertical bars one character wide with the dark text combined multiplicatively. Only the letters on the white bars would be visible. Raising their contrast above a low, but readable level would have no effect on performance, and the identifiability of the words would depend on the predictability of the illegible letters. There may be some contrast gain masking in this situation, but it will not be the dominant factor determining word readability. Similarly, in a study of the relationship between letter recognition and reading speed, Legge, Mansfield, and Chung4
concluded that when letter recognition is degraded (in their case in peripheral vision), word recognition becomes slowed and lexical inferences are utilized to a greater degree. The contrast gain asymmetry factor as estimated here is that the ratio of the positive gain to the negative gain is somewhere between 0.5 and 0.9. Such a gain asymmetry is expected if the internal luminance response function is modeled as having a monotonically decreasing slope, such as a logarithmic function or a power function with an exponent less than one. We plan to try to follow the suggestion of Martens and colleagues 5, 6 that image quality metrics need to include a more detailed model of the internal luminance response.
6. Appendix A: Summary Tables Table A1. Response Times Analysis Summary for Word Identification (ms)
Effect Background Transparency Word Pattern Contrast BxT BxW TxW BxC TxC WxC BxT xW BxTxC BxWxC TxWxC BxTxWxC
df Effect 1 1 2 1 1 2 2 1 1 2 2 1 2 2 2
MS Effect 49887 126858 1938800 514545 11188 165566 318516 11717 173861 172249 11062 4022 16722 17823 16736
df Error 27 27 54 27 27 54 54 27 27 54 54 27 54 54 54
MS Error 50240 111865 26346 24270 37749 14894 16723 20925 18314 19026 21442 17066 10869 18523 22348
F 0.99 1.13 73.59 21.20 0.30 11.12 19.05 0.56 9.49 9.05 0.52 0.24 1.54 0.96 0.75
p-level 0.33 0.30 0.00 0.00 0.59 0.00 0.00 0.46 0.00 0.00 0.60 0.63 0.22 0.39 0.48
MS: Mean Squared df: degrees of freedom Table A2. Response Times Analysis Summary for Word Discrimination (ms) Effect Transparency Target v. Decoy Word Pattern Contrast T x TD TxW TD x W TxC TD x C WxC T x TD x W
df Effect
MS Effect
df Error
MS Error
F
p-level
1 1 2 1 1 2 2 1 1 2 2
351223 236025 6369978 4241803 85817 697834 12816 727722 322482 887453 15158
27 27 54 27 27 54 54 27 27 54 54
439003 96774 235881 206628 54933 134067 35738 104848 25288 161283 33724
0.80 2.44 27.01 20.53 1.56 5.21 0.36 6.94 12.75 5.50 0.45
0.38 0.13 0.00 0.00 0.22 0.01 0.70 0.01 0.00 0.01 0.64
T x TD x C TxWxC TD x W x C T x TD x W x C
1 2 2 2
130121 202004 45228 2000
27 54 54 54
26148 90117 29170 51772
4.98 2.24 1.55 0.04
0.03 0.12 0.22 0.96
MS: Mean Squared df: degrees of freedom Table A3. Response Times Analysis Summary for Letter Identification (sec) Effect
df Effect
MS Effect
df Error
MS Error
F
p-level
1 2 1 2 1 2 2
8.67285 11.17063 3.33212 0.26214 0.00399 0.46326 0.08204
26 52 26 52 26 52 52
3.45 0.28 0.12 0.28 0.12 0.12 0.12
2.51 40.33 26.84 0.95 0.03 3.98 0.71
0.13 0.00 0.00 0.39 0.86 0.02 0.50
Transparency Pattern Contrast TxP TxC PxC TxPxC
MS: Mean Squared df: degrees of freedom
7.References 1. L. F. V. Scharff and A. J. Ahumada Jr., “Predicting the readability of transparent text,” Journal of Vision 2(9), (653666), http://www.journalofvision.org/2/9/7/, 2002. 2. L. F. V. Scharff, A. J. Ahumada Jr., and A. L. Hill, “Discriminability measures for predicting readability,” in Human Vision and Electronic Imaging III, eds. B.E. Rogowitz and T.N. Pappas, Proc. Vol. 3644, (270-277), SPIE, San Jose, CA, 1999. 3. L. F. V. Scharff, A. Hill, and A. J. Ahumada Jr., “Discriminability measures for predicting readability of text on textured backgrounds,” Optics Express, 6(4), (81-90), 2000. 4. G. E. Legge, J. S. Mansfield, and S. T. Chung, “Psychophysics of reading XX. Linking letter recognition to reading speed in central and peripheral vision,” Vision Research, 41, (725-743), 2001. 5. N. Belaïd and J. B. Martens, “Grey scale, the `crispening effect', and perceptual linearization,” Signal Processing, 70(3), (231-245), 1998. 6. N. Belaïd, I. van Overveld, and J. B. Martens, “Perceptual linearization as display standard: Link between psychophysics and contrast discrimination models,” in Medical Imaging 1997: Image Perception, ed. H.L. Kundel, SPIE Proc. Vol. 3036, Newport Beach, CA, USA, February 26-27, (130-142), 1997.
Acknowledgements Funding was provided by the Airspace Operations Systems (AOS) Project of NASA's Airspace Systems Program. It was partially supported by NASA Ames Research Center cooperative agreement NCC 2-1095 with the San Jose State University Foundation. We are grateful for the assistance of Robin Rustad and Lori Shird.