Wetlands https://doi.org/10.1007/s13157-018-1038-1
ORIGINAL RESEARCH
Contrasting Photosynthetic Responses of Two Dominant Macrophyte Species to Seasonal Inundation in an Everglades Freshwater Prairie Junbin Zhao 1 & Steven F. Oberbauer 1 & Paulo C. Olivas 1,2 & Jessica L. Schedlbauer 1,3 & Jeremy L. May 1 & Jonathan G. Moser 1,4 & Sparkle L. Malone 1 & Christina L. Staudhammer 5 & Gregory Starr 5 Received: 12 July 2017 / Accepted: 25 April 2018 # Society of Wetland Scientists 2018
Abstract The Everglades short-hydroperiod freshwater prairies exhibit strong reductions in CO2 uptake that coincide with inundation, but the underlying basis is not fully understood. To address one of the processes potentially underlying this decline, we measured photosynthetic capacity of the dominant species, sawgrass (Cladium jamaicense) and muhly grass (Muhlenbergia filipes), during wet and dry seasons (2009–2012 and 2016–2017). The measurements in the seasonally inundated prairie were compared to those taken on a nearby rarely inundated levee situated 29 cm above the prairie with similar species composition. During the dry seasons, muhly grass exhibited a much higher photosynthetic capacity (28.5 μmol m−2 s−1) than sawgrass (14.2 μmol m−2 s−1), and no differences were found between the prairie and levee for either species. During the wet seasons when the prairie was inundated, photosynthetic capacity declined substantially (67%) in the prairie for muhly grass while it remained similar across seasons for sawgrass. Analyses of leaf reflectance, chlorophyll fluorescence and leaf nutrient indicated photosystem impairment was the main driver of photosynthetic capacity reduction for muhly grass when the ecosystem is inundated. Our study suggests that declines in photosynthesis of macrophytes, particularly muhly grass, contribute to low wet season productivity in Everglades short-hydroperiod freshwater prairies. Keywords Fluorescence . Sawgrass . Muhly grass . Photosynthesis . Stomatal conductance . Subtropical wetland ecosystem
Introduction Electronic supplementary material The online version of this article (https://doi.org/10.1007/s13157-018-1038-1) contains supplementary material, which is available to authorized users. * Junbin Zhao
[email protected] 1
Department of Biological Sciences, Florida International University, Miami, FL 33199, USA
2
Present address: GIS-RS Center, Florida International University, Miami, FL 33199, USA
3
Present address: Department of Biology, West Chester University, West Chester, PA 19383, USA
4
Present address: US Department of Agriculture, Dale Bumpers National Rice Research Center, Stuttgart, AR 72160, USA
5
Department of Biological Sciences, University of Alabama, Tuscaloosa, AL 35487, USA
In the Florida Everglades, hydrology is influenced by rainfall, regional runoff, topography and water management (Obeysekera et al. 1999). As a principal wetland ecosystem in the Everglades, short-hydroperiod freshwater prairies are characterized by an inundation period that partially submerges vegetation for 4–6 months each year (Davis and Ogden 1994; Malone et al. 2014). Previous studies have shown a reduction in ecosystem CO2 uptake rates during the wet season when plants are submerged compared to the dry season when water is below the soil surface (Schedlbauer et al. 2010; Jimenez et al. 2012; Malone et al. 2014). Theoretically, ecosystem CO2 uptake is determined by amount of photosynthetic tissue in the ecosystem and the photosynthetic capacity per unit of that tissue. For Everglades freshwater wetlands (including prairies), the ecosystem CO2 uptake is dominated by macrophyte photosynthesis, while the contributions from
Wetlands
aquatic photosynthesis of cyanobacteria, diatoms, algae, and aquatic plants such as bladderworts (Utricularia sp.) are limited (Schedlbauer et al. 2012). Macrophyte leaf submergence, which reduces the active area of photosynthesis, was suggested to be partially responsible for the decline in ecosystem CO2 uptake (Schedlbauer et al. 2010, 2012). However, the responses in physiological activities (e.g. photosynthetic rate per leaf area) of the dominant plants to wet season inundation remained unknown, which established the foundation for this study. Inundation creates an anoxic environment which can lead to lower redox potentials and increase plant stress by limiting oxygen that is required for metabolism (Pezeshki 2001). Depending on the tolerance to inundation, plants can exhibit various responses to inundation stress. For instance, photosynthetic rates often decline when roots experience anoxic conditions (Else et al. 2001, Chen et al. 2010). Being one of the drivers of the photosynthetic decline, stomatal closure is typically found as a result of decreased hydraulic conductivity in response to root oxygen depletion (Pezeshki et al. 1996; Else et al. 2001; Jackson 2002). Reduction in leaf chlorophyll fluorescence has also been observed in response to flooding, suggesting that levels of leaf chlorophyll or other photosystem components may be reduced (Chen et al. 2010). Nutrient elements, such as nitrogen and phosphorus, are important components of plant photosystems (Reich and Schoettle 1988; Evans 1989). Anoxia in roots can limit nutrient uptake and transport (DeLaune et al. 1998, 1999), which results in a reduction of these elements in the leaf and, consequently, affects photosynthesis. Depending on the inundation tolerance of a species, a combination of these mechanisms may also interact in controlling photosynthesis upon inundation. The Everglades has a large area that is inundated seasonally (Todd et al. 2010). To understand plant responses to seasonal inundation in an Everglades short-hydroperiod freshwater prairie, we measured leaf-level photosynthesis on the two co-dominant macrophyte species: sawgrass (Cladium jamaicense), a C3 sedge, and muhly grass (Muhlenbergia filipes), a C4 grass. To reveal the physiological processes underlying the changes in photosynthesis, measurements of stomatal conductance, leaf reflectance, chlorophyll fluorescence and nutrient status were also conducted at the leaf-level. The effect of inundation was explored by comparing these variables under different water levels. This study aims to answer two questions: 1) Does inundation reduce the photosynthetic capacity of co-dominant freshwater prairie species? 2) Do the two co-dominant species respond differently to inundation? This work will improve our understanding of the inundation tolerance of two species and yield insights into the roles of these plants in driving the seasonal ecosystem CO 2 exchange pattern in Everglades short-hydroperiod freshwater prairies.
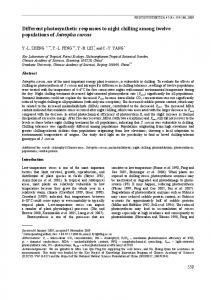
Materials and Methods Site Description This study was carried out near the headwaters of Taylor Slough (25o26’ N, 80o35’ W), which is co-located with the Florida Coastal Everglades long-term ecological research (FCE-LTER) site TS/Ph1B on the eastern edge of Everglades National Park (ENP) (Fig. 1). Precipitation in the Florida Everglades is on average 1380 mm annually, with ~70% occurring during June–November (Davis and Ogden 1994). Our study site is a short-hydroperiod oligotrophic freshwater prairie that is usually inundated for 4–6 months when water levels reach 20–30 cm above the soil surface, while water levels stay below the soil surface for the remaining months (~December–May) (Davis and Ogden 1994; Malone et al. 2014). Since this study focuses primarily on the effect of inundation on the plants, we define the wet season as the period when water level continuously exceeds 0 cm above the soil surface and the period when water level remains below the soil surface as the dry season. The site is characterized by shallow marl soils (~14 cm depth) overlying limestone (Jimenez et al. 2012). The vegetation has an average canopy height of ~0.73 m and is dominated by a mix of sawgrass (Cladium jamaicense Crantz, a C3 sedge) and muhly grass (Muhlenbergia filipes M.A. Curtis, a C4 grass). We paired the site in the seasonally inundated prairie with a nearby levee site comprised of the same plant species located ~20 m away. The levee site has a 5-10 cm soil layer overlying rocks and an elevation ~29 cm higher than the prairie, and it was therefore rarely inundated. Thus, the levee was used to represent the same climatic conditions without the effects of inundation during wet seasons.
Photosynthetic Capacity and Stomatal Conductance Measurements To determine the photosynthetic capacity of the dominant plants under contrasting water levels, we measured net assimilation rates and corresponding stomatal conductance (gs) on the emergent leaves of sawgrass and muhly grass at the phot o s y n t h e t i c a l l y a c t i v e r a d i a t i o n ( PA R ) l e v e l o f 2000 μmol m−2 s−1 in the prairie and levee. Since photosynthesis of both the species saturates below PAR of 2000 μmol m−2 s−1 (Fig. S1), the measured assimilation rate was used to indicate the photosynthetic capacity (Amax). Measurements were taken during 2009–2011 and 2016– 2017 with at least one measurement in each season, making a total of four wet season measurements and five dry season measurements (see Table 1 for detailed measurement dates). The measurements were conducted using a LI-6400 Photosynthesis System (LI-COR, Inc., Lincoln, NE, USA) equipped with a 2 × 3 cm leaf chamber configured at ambient
Wetlands
Fig. 1 Location of the study sites at Taylor Slough (TS), which is on the eastern edge of Everglades National Park. The marsh and levee sites are in close proximity
temperature and relative humidity. The internal LED light source was used to regulate the light intensity. Air CO2 concentration (Ca) within the chamber was set to 400 ppm. Intercellular CO2 concentration (Ci) was also derived from each measurement. For each of the nine measurement occasions, 5–10 randomly selected healthy leaves from separate individuals (at least 1.5 m away from each other) in the prairie and on the nearby levee for each species were measured between 9:00–11:30 a.m. After each measurement, the section of
leaf that was measured within the chamber was cut and scanned for projected leaf area using a LI-3000a Portable Leaf Area Meter (LI-COR, Inc., Lincoln, NE, USA). This leaf area was then used to correct the Amax and gs computed by the LI-6400. Due to equipment problems, gs measurements on September 3, 2009 and those taken on the levee April 1, 2010 and July 14,-2011 were discarded. Negative gs values, which were occasionally measured ( 0.14). In contrast, muhly grass Amax was on average 28.5 ± 1.4 (SE) μmol CO2 m−2 s−1, twice the magnitude of the sawgrass Amax during the dry season, and was similar between the prairie and levee (P > 0.66) (Fig. 2b). However, during wet seasons, muhly grass Amax declined to 0.46), indicating the responses of gs to inundation were similar between the two species. For sawgrass, water level did not have a significant influence on Amax either in the prairie (P = 0.11) or on the levee (P = 0.92) (Fig. 3a, see Supporting Information Table S1 for a summary of the models). Changes in gs had a significant effect on sawgrass Amax in both the prairie and levee (P < 0.01), and this effect (i.e. slopes of the model) did not differ between the prairie and levee (P = 0.57) (Fig. 3c). In contrast, the effect of water level on Amax of muhly grass was significant in the prairie (P < 0.01) but not on the levee (P = 0.48) (Fig. 3b). According to the model, the increase of water level from the average level of the dry season (i.e. -37 cm) to that of the wet season (i.e. +30 cm) caused the Amax to decline by 67% for muhly grass in the prairie. Moreover, gs of muhly grass correlated with Amax in both the prairie and the levee, even though Amax was less sensitive to gs changes in the prairie than on the levee (P = 0.04) (Fig. 3d).
Wetlands
Fig. 2 Photosynthetic capacity (Amax, a–b) and stomatal conductance (gs, c–d) of sawgrass (C. jamaicense) and muhly grass (M. filipes) at the prairie (black boxes) and levee (white boxes) during 2009–2011 and 2016–2017. Grey backgrounds indicate wet seasons. The bottom and top of a box indicate the values of lower and upper quartiles,
respectively, and the horizontal line within the box is the median. The lower and upper whiskers represent the minimum and maximum values, respectively (5 ≤ n ≤ 10). Different lowercase letters indicate significant differences between the levee and prairie on each date (P < 0.05)
The Ci/Ca ratio of sawgrass was significantly affected by gs (P < 0.01), rather than Amax (P > 0.05), in both prairie and levee (Fig. 3e, g). In contrast, the Ci/Ca ratio of muhly grass was not correlated to gs (P > 0.05). Instead, Amax exhibited a significant effect on Ci/Ca of muhly grass in the prairie (P < 0.01), but not those on the levee (P > 0.05) (Fig. 3f, h).
Effect of Inundation on Leaf Reflectance Indices and Chlorophyll Fluorescence
Table 2 Summary and analysis of variance (ANOVA) of mixedeffects models for photosynthetic capacity (Amax) and stomatal conductance (gs) with the main effects of species (C. jamaicense/ M. filipes), site (levee/prairie) and season (dry/wet) and their twoway interaction terms as independent variables
Similar to patterns observed for Amax, sawgrass did not show significant differences in CI and PRI both between prairie and levee (P > 0.23) and between seasons (P > 0.19) (Fig. 4a, c). However, for muhly grass, significantly lower CI and PRI
Dependent variable
Independent variable
SS
NumDF
DenDF
F-value
P-value
Amax
Species
10,332.88
1
228.80
125.10