Early evidence from bacteria (Gale, 1946) had, in fact, suggested that metabolism can act as a ..... Harold, 1977; Walker, 1980). However, determinations of ...
Control of Intracellular pH Predominant Role of Oxidative Metabolism, Not Proton Transport, in the Eukaryotic Microorganism Neurospora
DALE SANDERS and CLIFFORD L. SLAYMAN From the Department of Physiology, Yale University School of Medicine, New Haven, Connecticut 06510
ABSTRACT
Recessed-tip microelectrodes were used to measure internal pH (pHi) in the fungus Neurospora, and to examine the response of pHi to several kinds of stress : changes of extracellular pH (pHo), inhibition of the principal proton pump in the plasma membrane, and inhibition of respiration . Under control conditions, at pH o = 5.8, pHi in Neurospora is 7 .19 t 0.04. Changes of pH . between 3.9 and 9.3 affect pHi linearly but with a slope of only -0.1 unit pHi per unit pH., stable pHi being reached within 3 min of changed pH.. Despite a postulated high passive permeability of the Neurospora membrane to protons (Slayman, 1970), neither active nor passive H+ transport appears critical to pHi because (a) specific inhibition of the proton pump by orthovanadate has little effect on pHi, and (b) cytoplasmic acidification produced by respiratory blockade is unaffected by the size or direction of proton gradient . To convert measured changes in pHi into net proton fluxes, intracellular buffering capacity (li) was measured by the weak acid/weak base technique. At pHi = 7 .2, Qi was (-)35 mmol H+ (liter cell water) -1 (pH unit)-1 , but 8i increased substantially in both the acid and alkaline directions, which suggests that amino acid side chains are the principal source of buffer . INTRODUCTION
There is now substantial evidence from a variety of cell types that intracellular pH (pHi) is maintained within relatively narrow limits (animals : Roos and Boron, 1981 ; plants : Smith, 1980 ; fungi : Navon et al ., 1979 ; bacteria : Slonczewski et al ., 1981) . This conforms with the general expectation, based on the pH optima of cytoplasmic enzymes, that large deviations of pH from neutrality would be severely inhibitory to metabolism . It is also clear that this constancy of internal pH represents a steady state, not true equilibrium ; in all circumstances where metabolism is active, there is a steady flux of protons into and out of the cytoplasmic proton pool . Previous work on nerve and muscle has established a predominant role for J. GEN. PHYSIOL.
Volume 80
© The Rockefeller University Press " 0022-1295/80/09/0377/26$1 .00 377-402
September 1982
377
378
THE JOURNAL OF GENERAL PHYSIOLOGY " VOLUME
80 " 1982
membrane transport in control of pHi . In response to an acid load on the cytoplasm, a variety of excitable cells uses electroneutral exchanges of CI - for HCO3 and of Na' for H+ (either in separate or combined transport systems) to return cytoplasmic pH to more alkaline levels (Roos and Boron, 1981) . Energy for these exchanges comes primarily from the gradient of Na', which means ultimately from work done by the sodium pump . The situation in microorganisms must be quite different, however, because the primary pump in the plasma membrane is an outwardly directed, electrogenic H + pump (Slayman, 1974) . It therefore seemed reasonable to expect that regulation of cytoplasmic pH in these cells would be accomplished by the proton pump, and cogent theoretical arguments have been made that this is indeed the case (Raven and Smith, 1974, 1976a) . However, the magnitude of influence that the pump has on cytoplasmic pH will be limited by at least two circumstances . First, the pump consumes a large fraction (25% : Slayman et al ., 1973) of the total phosphate bond energy, which is itself tightly controlled in respiring cells (Atkinson, 1977) . This will set a limit on the degree to which the pump can be stimulated in the presence of a proton load. Second, metabolism can liberate or consume substantial quantities ofprotons, depending on the predominant pathways being used at any particular time (Raven and Smith, 1976a, b) . Early evidence from bacteria (Gale, 1946) had, in fact, suggested that metabolism can act as a controller of intracellular pH, and more recent studies using 3IP nuclear magnetic resonance (NMR) have identified a very considerable sensitivity of pHi to imposed metabolic conditions (Ugurbil et al ., 1978; Navon et al ., 1979; den Hollander et al ., 1981) . However, limitations intrinsic to the NMR technique have retarded attempts to assess the relative contributions of metabolism and the proton pump to pHi control (for example, when one process, but not the other is inhibited), and we have adopted a more direct approach using intracellular pH microelectrodes on the relatively large cells of the mycelial fungus Neurospora. Our two main findings have been (a) that, despite a large inward transmembrane gradient for protons, the dominant source of cytoplasmic protons is intracellularly produced acidity ; and (b) that metabolism alone is capable of controlling pHi, even when the proton pump is inhibited . MATERIALS AND METHODS
Growth of Cells
For internal pH measurements, wild-type Neurospora crassa, strain RL21a, was grown on scratched cellophane underlaid with minimal medium plus 2% sucrose (Slayman, 1965) . After ^30 h growth, a portion of the hyphal mat and cellophane was removed and soaked in the standard buffer solution (see below) for 1-2 h before the commencement of experiments, at room temperature (usually 23 ° C) . This pretreatment allowed the cells to come to a new steady state in which they were actively respiring, but no longer growing . Hyphae that had adhered firmly to the cellophane and reached 12-14 j,m diameter were used . Measurements of respiration were made at 25 ° C on cells that had been grown 12-15 h in shaking cultures, as described by Slayman and Tatum (1964) and Lambowitz and Slayman (1971) .
SANDERS AND SLAYMAN
Intracellular pH and Metabolism in Neurospora
379
Solutions
All cells were grown in Vogel's (1956) minimal medium, pH 5.8 . Measurements of respiratory rate, and in some cases (Fig. 6) of internal pH, were performed in phosphate-free dilute (0.3X) minimal medium (P-free DMM), to which were added 1% glucose, 2.3 mM CaC12, and 20 mM dimethylglutaric acid (DMG) titrated to pH 5.8 with NaOH. The standard buffer medium (designated "standard DMG") for most experiments was 20 mM DMG, 1 mM CaC12, and 1% glucose, brought to pH 5.8 with KOH (final K+ concentration 25 mM) . DMG titrated with KOH was also used for experiments below pH 5.8 ; HEPES (30 mM, pH 7.5-8.4, usually 8.2) or glycylglycine (30 mM, pH 9.0; 18 mM, pH 9.2-9 .5) was used at higher pH's. In all cases, the solutions were titrated to the desired pH with freshly prepared KOH, and the final K+ concentration was brought to 25 mM with KCI . Additions to these solutions (inhibitors, weak acids, or weak bases) were made from concentrated stock solutions brought to the appropriate pH with NaOH or HCI . Orthovanadate was used from a freshly boiled 200-mM stock solution of the Na' salt, pH 9.5, and subsequently neutralized with HCI.
Measurement of Internal pH.- the Electrodes
Recessed-tip electrodes of the Thomas (1974, 1978) design were fabricated for each experiment . Efforts were made to reduce the outside tip diameter and the dead volume of the electrodes below sizes conventionally described (Thomas, 1978), in order to minimize penetration damage and increase response speed . However, test studies showed that with very small dead spaces (resistances on the order of 5 X 10 12 S2), the time constant for response to a step change of pH was essentially identical to the time constant for response to a current pulse ; i.e., the sensing time constant (TPH) and the electrical time constant (Tel) were the same. For larger electrodes this relationship did not hold, and Tel was generally faster than TP H, which presumably means that H+ diffusion into the dead volume was rate limiting. Optimization of the various factors in construction and use of the pH electrodes led to the following dimensions : tip diameter (outside), 0.5 gum; recessed distance between casing aluminosilicate glass and the pH glass, 2-6 ,um ; overall length of exposed pH glass, 25-35 jum ; sensitivity, >55 mV/unit pH; electrical resistance, 1012 52; TPH, 5-20 s (usually close to Tel) .
Experimental Protocol and Correction of the pH Trace during Rapid Changes of Membrane Potential
All measurements were made with a high-impedance differential amplifier (Model F223 ; WP Instruments, Inc ., Hamden, CT), which compared the signal from the pH electrode with a second, intracellular, microcapillary reference electrode reporting membrane potential alone. Fig. 1 shows a sample recording that demonstrates the general experimental protocol and some of the problems associated with the use of recessed-tip microelectrodes . Initially, the reference microelectrode was inserted into the hypha, and after a stable voltage was achieved, the pH electrode was positioned in the same cell . The sudden depolarization accompanying entry of the pH electrode is typical, but recovery was taken as an indication that the cell was not damaged by entry of the (comparatively coarse) pH electrode . Addition of CN- results in rapid depolarization by ^-100 mV. This event produces a transient artifact in the pH trace (apparent alkalinization) because of the markedly different electrical time constants of the two electrodes . A segmental linear method for correcting the artifact is described in the Appendix, and the results of the correction are shown in Fig . 1 (dashed line). (Note that since Fig . 1 is traced from an original pen recording, the pH trace is
THE JOURNAL OF GENERAL PHYSIOLOGY " VOLUME 80 " 1982
38 0
E
e cm Em
-50
-200
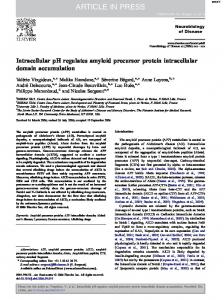
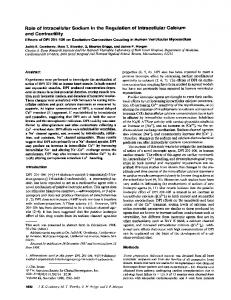
1 mMCN Insertion of recessed-tip pH electrode and potential-measuring electrode into Neurospora, and the effect of rapid depolarization on measured internal pH . Upper trace : voltage difference between signals from the pH electrode and a conventional, KCl-filled microcapillary electrode . Lower trace : output from the microcapillary electrode alone . Before insertion of either electrode, the upper trace displays external pH = 5 .70 . Upon insertion, the microcapillary electrode registered membrane potential of -157 mV ; note accompanying equal and opposite deflection in the difference trace . 4.7 min later, the pH electrode was inserted, which resulted in a transient depolarization of 47 mV . On attainment of a stable reading for internal pH (7 .32), the preparation was pulsed with 1 mM NaCN for 1 min . The apparent alkalinization that paralleled depolarization was caused by the markedly different time constants of the two electrodes . Similarly, the (slower) repolarization produced a (smaller) apparent acidification upon washout of NaCN . Dashed trace shows the "true" internal pH, after correction of pH trace for Tel (see Appendix) . Tel in this case was 8 .7 s . Further discussion of the effects of CN - on pHi is given in the Results . FIGURE 1.
inverted . Throughout the rest of this paper, pH data have been oriented with increasing pH values upward, after correction for the membrane potential artifact.) Normally, experiments were terminated after 15-20 min by "sealing off" of the pH electrode by a cytoplasmic cap (Umrath, 1932 ; Walker, 1955 ; Slayman, 1965), although cells were capable of surviving for ?2 h with the pH- and potential-recording electrodes inside .
SANDERS AND SLAYMAN
Intracellular pH and Metabolism in Neurospora
38 1
Correction of pH Traces for Slow Response to pH In some experiments, pH was monitored simultaneously inside and outside the cells, using separate pH electrodes. In these cases, we wanted to know the exact behavior of pH in both phases, so correction for the response time of each pH electrode was necessary . Again, reconstruction of the actual time course of pH change from the observed traces was performed by segmental linear analysis, using the Tp H for each electrode (see Appendix) . Measurement of Cytoplasmic Buffering Capacity Weak acids (or bases) can be used in conjunction with pH electrodes to estimate the buffering capacity (Bi) of cytoplasm, as has been demonstrated by numerous previous investigators (see Roos and Boron, 1981) . When the internal pH has attained a new steady level in the presence of a weak acid, it is assumed that the undissociated acid is at equilibrium across the cell membrane . The internal concentration of the acid anion can then be calculated from the Henderson-Hasselbalch equation (Waddell and Bates, 1969), provided the internal pH and pK are also known . Under normal conditions, the stable amount of acid anion closely approximates the quantity of protons absorbed by the cytoplasmic buffer (only a very small fraction of the total protons released from the acid remains free in the cytoplasm) so that fi can be written as
where dA` is the change in internal concentration of the weak acid anion, and dpHi is the change in internal pH . For a weak base, analogous arguments hold and the corresponding equation is
ai -
(+)
dB+
dpHi
(l b)
where dB + is the change in internal concentration of the weak base cation .' The pKa's of butyric acid (the weak acid in the present study) and procaine (the weak base) were measured by titration either in 25 mM KCI plus 1 mM CaCl2 (similar to the external medium in these experiments) ,ar in 200 mM KCI (a simulation ofcytoplasm) . For butyric acid, the measured pKa in both cases was 4 .81, in agreement with the published value (Weast, 1971) . For procaine, values of 9 .03 and 9 .13, respectively, were obtained, these values being used for the determination of ai .
Experimental Checks on Assumptions Made by the Weak Acid/Base Method of Determining It POSSIBLE METABOLISM OF THE WEAK ACID The method assumes that any changes in internal pH result simply from dissociation of free acid inside the cell . Since microorganisms are known for their ability to use simple organic acids as carbon sources, it seemed important to determine whether butyrate might be metabolized and thereby alter internal pH . To answer this question, cells were allowed to take up ' Although the introduction of high concentrations of weak acid or base into the cytoplasm in itself raises the total cytoplasmic buffering capacity, the method measures only the intrinsic cytoplasmic buffering, since the sole participant in proton exchange with the acid or base is the preexisting cytoplasmic buffer .
THE JOURNAL OF GENERAL PHYSIOLOGY " VOLUME 80 " 1982
38 2
14C-butyric acid for 30 min (15 mM butyrate, pH 5 .8) . Evolution of 14CO2 was monitored, and at intervals, aliquots of cells were removed, extracted with ethanol, and analyzed by thin-layer chromatography. No release of 14 CO2 was detectable in 30 min, and >95% of total 14C counts co-chromatographed with pure butyric acid, independently of the incubation time . COMPARATIVE PERMEABILITIES OF THE CHARGED AND NONCHARGED FORMS Clearly, if the membrane is significantly permeable to the charged form of the weak acid or weak base, the condition that the noncharged form alone is at concentration equilib rium across the membrane will be violated . However, the following preliminary experiments demonstrated, both for butyric acid and for procaine, that the charged species have low permeability coefficients. (a) To test whether influx was proportional to the free acid concentration or the acid anion concentration, the initial uptake of 5 mM 14C-labeled butyric acid was measured at two different external pH values. Raising pH . from 5 .80 to 8 .02 resulted in a 300-fold reduction of influx, compared with a 150-fold reduction of free acid, and a 10% increase of acid anion. The discrepancy is in the wrong direction to be accounted for by significant anion permeability . (b) In electrical experiments, butyrate (applied at high pH) and procaine (applied at low pH) had no effects on membrane potential . High passive permeability to either charged species should have been signaled by hyperpolarization (butyrate) or depolarization (procaine) . These experiments demonstrate that interference of the buffering capacity measurement by entry of the charged forms is probably minimal. However, errors could arise from significant exit of the charged forms, particularly in the case of an acid for which the driving force on the anion will be strongly outward in the steady state . If the ionized form of the acid leaks from the cell, a biphasic change in pHi would be expected-the initial phase corresponding to free acid equilibration, and the second to further acid uptake as the anion leaks out . For butyric acid, no such biphasic changes were observed . In addition, initial rate measurements showed that influx of 14C butyric acid (measured at 5 mM total acid) is at least fourfold greater than efflux of H + through the pump; the effect of pump activity on the estimate of Ni would therefore be largely nullified by continued free acid entry . On application of procaine, pHi often did show a transient overshoot, which might indicate either regulation of pHi or the slower entry of the charged form of the base (cf. Boron, 1977) . Either could produce an error in the estimate of Pi. However, the transient response was nearly abolished in the presence of CN - and the estimates of Ni made with procaine in the presence of CN- did not deviate significantly from those over the same pH range in the absence of CN - . 1-
Statistics Throughout the manuscript, averaged results are stated as the mean ± 1 SEM . RESULTS
Normal Intracellular pH of Neurospora In standard DMG, pH 5.8, pHi in 24 cells was measured as 7 .19 ± 0.04 on initial impalement . In standard HEPES, pH 8 .2, pHi on initial impalement was 7 .41 ± 0.04 (n = 12) . Rather wide variability was observed between hyphae : at pH. = 5.8, recorded pHi ranged from 6.85 to 7 .62 . The origin of this variability is not known, but similar variability has also been observed in measurements of membrane potential (range -160 to -240 mV under Stan-
SANDERS AND SLAVNtAN
Intracellular pH and Metabolism in Neurospora
383
dard conditions) ; it may arise, at least in part, from differences in the physiological ages of hyphae sampled in a petri plate culture . It is important to note, however, that the steady pHi did not correlate either with the membrane potential or with the magnitude or direction of pH response to experimental tests . Effect ofpH, on pHi
A large amount of circumstantial evidence in the literature has led to the belief that major electrical conductance of plasma membranes in Neurospora 9 n ô c ô
8
x w
7
S a
7.8
ö c 0 r c
7.6 7.4 0
6 ô 0
d
0 c 0 E 0
2
4
6
8
Time/min -150 -170 -190
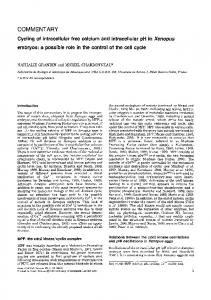
Parallel, but attenuated, behavior of pHi with rising pH. . The FIGURE 2. bathing medium was changed from standard DMG (pH 5 .9) to standard glycylglycine (pH 9 .3) and pH . was monitored with a pH microelectrode at the cell surface (uppermost trace) . Both pH traces were corrected, as described in the Appendix, for lag in response of the electrodes to the change in pH . Note the fivefold magnification of the ordinate for pHi, in comparison with PH. . and other eukaryotic microorganisms is that for protons (Slayman, 1977; Harold, 1977 ; Walker, 1980). However, determinations of intracellular pH over a wide range of extracellular values show that pH ; is only slightly sensitive even to large changes of pH. . This fact is demonstrated for alkaline and acid shifts of pH . i n Figs . 2 and 3, respectively . For these experiments, a chamber of small volume (0 .8 ml) was perfused
384
THE JOURNAL OF GENERAL PHYSIOLOGY " VOLUME 80 " 1982
a 0 c 0 IC W
a
Cc w 0
c
65 4 7.7 7.5 7.3 0
6 e
2
4
6
8
Time /min
-80
.`c -120 0 CO L a
-160
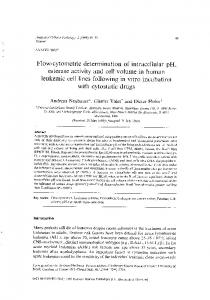
FIGURE 3. The effect of lowered external pH on internal pH and membrane potential. Bathing medium was changed from pH 5.7 to pH 3.9 and back to pH 5.7 . As in Fig. 2, pH . was monitored with a pH microelectrode at the cell surface. Medium at pH 5.7 was standard DMG, and the lower pH medium was also buffered with 20 mM DMG, as described in Materials and Methods. The middle trace shows the response of pHi, and the bottom trace shows that of the membrane potential. Again, both pH traces were corrected for lag in electrode responses. Note the fivefold magnification of the ordinate for pHi compared with that for external pH . The pseudo-first-order time constants for the changes in external pH and internal pH (fitted by nonlinear least squares) were, respectively, 0.49 and 1.79 min. The dashed line superimposed on the trace of membrane potential is drawn as the sum of two exponentials whose time constants were identical with those for the changes in external and internal pH ; the fitting equation is
V�, = 82 + 75 exp(-t/0 .49) + 103 exp(-t/1 .79), where Vm is membrane potential (mV) and t is time (min) . rapidly (12 ml/min), and an extracellular pH microelectrode was positioned 2 pin from the hypha being studied. Readings were obtained simultaneously from this electrode and the intracellular one. Fig. 2 shows that increasing pH . from the normal value (near 5 .8) to 9.25 caused pHi to rise, from 7.50 to 7 .84 in this case . It should be noted, also, that the time course of change of pHi followed closely that of pH .; there was neither an initial transient nor any
SANDERS AND SLAYMAN
IntracellularpH and Metabolism in Neurospora
385
longer-term (10-20 min) tendency of pHi to return to the control value with sustained high pH . This simple behavior of pHi in response to changing pHo contrasts with the complex changes of membrane potential (bottom trace, Fig. 2) : a slight transient depolarization, which was followed by a much larger hyperpolarization peaking at the time of maximal slope in the pH curves [dpH/d(time)], and then a return to the control value. Slayman (1965) has reported that membrane potential rises monotonically with increasing extracellular pH, but those original data extend only to pH 9.0; at still more alkaline values, the voltage response to pHo is less stable. For acid changes of pH o (from the control value near pH 5 .8), pHi also moved in the acid direction, but with a substantial delay. As can be seen in the example of Fig. 3 (middle trace), pHi did not begin to fall until external acidification was almost complete ; the time constant for internal acidification was -1 .8 min. On return of pHo to the control value, pHi also returned, but once again with a delay. As in the case of external alkalinization, changes of pHi were monotonic, with no indication of either rapid transients or iongterm correction . The response of membrane potential followed the general pattern observable in most microorganisms and plants (Slayman, 1970) : depolarization . However, an important feature of the data accompanied the decrease in pH in Fig. 3 is that not all of the depolarization occurred concurrently with the change in external pH; about half the overall change in membrane potential was observed after the external pH reached the new steady level. The dashed line on the voltage trace in Fig. 3 shows that the depolarization can be fitted well as the sum of two declining exponentials whose time constants are identical with those for the change in external and internal pH (0.5 and 1 .8 min, respectively) . Repolarization on returning to the original pHo was also biphasic in the same fashion. Thus, the dependence of membrane potential on pHo in the acid range consists of at least two components-one directly ., and the other probably mediated by an intracellular event, related to pH perhaps the small change in pHi. Absence of Detectable Feedback Control of pHi
Fig. 4 is a summary plot for the results from two types of experiments. Closed symbols represent pHi recorded after long-term (1-2 h) preincubation at the specified pH ; open symbols represent data from shorter-term experiments of the type in Figs . 2 and 3, in which the steady pHi was recorded after times >3 min . In the short-term experiments, pHo was always returned to the reference value of 5.8 between each treatment. The two sets of data are readily .), described by a single straight line function (slope = 0.08 unit pHi/unit pH which indicates that there is little or no long-term tendency for pHi to deviate . Thus, from the value obtained only a few minutes after the change in pH, pHi either is effectively controlled in short term or is insulated from effects of . This behavior of Neurospora contrasts with that of Escherichia coli after pH acid jumps in pHo; there, a transient fall in pHi occurs in the first 30 s, and is followed by spontaneous recovery over the ensuing 3-4 min, so that pHi is
386
THE JOURNAL OF GENERAL PHYSIOLOGY " VOLUME
80 " 1982
restored to a value close to the original one (R . M. Macnab, personal communication) . The resultant steady state dependence of pHi on pHo in E. . coli, however, is very similar to that in Neurospora : -0 .1 unit pHi/unit pH
Effects of Proton Pump Inhibitors on pHi The internal H+ concentration ([H+]i) rests at a level significantly lower than if H+ were at equilibrium across the plasma membrane (EH = +75 mV in 0.4
0
c 0 V E
0
0.2
a
c
e c
0
0
c
o 0 0
-0 .2
-0 .4
External pH
. Solid FIGURE 4 . Summary plot of variations in pHi for different values of pH points (0) : cells bathed in the appropriate buffer medium (standard DMG or standard HEPES) for periods of 1-2 h. Open circles (O) : steady pHi's recorded ., 3-5 min after changing pH . (pH electrode inserted before the change in pH as in Figs . 2 and 3) . All data are normalized with respect to those obtained at pHo 5.8, which was used as the control condition in the shorter-term experiments. Absolute pHi at pH o 5.8 : 7.19 ± 0.04 (24) . Other points are mean ± SEM for 7-12 cells. Note the expanded scale of the ordinate . The line was fitted by least squares to the individual data points and obeys the relation pHi = 0.08 pH. + 6.72. standard DMG, membrane potential = -200 mV) . Inhibitors of the proton pump were therefore applied in order to investigate the role of the H+ extrusion pump in maintaining this relatively alkaline pHi. Pump inhibitors fall generally into two classes : indirect inhibitors, which act through reduction
Intracellular pH and Metabolism in Neurospora
SANDERS AND SLAYMAN
387
of the supply of ATP to the pump by metabolic blockade ; and direct inhibitors, which act on the pump, but (ideally) not on any other metabolic processes . INDIRECT INHIBITION BY CYANIDE Fig . 5A shows the effects of 1 mM NaCN on membrane potential and pHi, at pHo = 5.8. Rapid depolarization resulted from switching off the electrogenic H + pump by ATP withdrawal (Slayman et al ., 1973) . A large (0 .70 unit) but slow cytoplasmic acidification also occurred, in this example from pHi = 7 .03 to 6.33 . The effect of CN- on pHi was usually biphasic, the two time constants in this case having values of 0.5 and 3.2 min. (Acidification cannot result from H + transport into the cell as HCN, because that acid is too weak [pK. = 9.1] to release significant H + at pHi = 7 .2.) On removal of CN - , both membrane potential and pHi recovered to the control values, but again membrane potential shifted faster than pHi . a 0c e C
7.0 6.6 6.2 0
E w 0 C m
d
4
.
.
16 Time/min
-40 r
.
.
20
.
I .M CN'
24
M 4 , 8 0 Time/min
n__
-120 1
0 -200 0
.n
E
0 -280 L
A
external pH =5.8
x -40
1
-120
J -280 B external pH=8.4
E
O
0
-0
0
Cyanide-induced depolarization (lower trace) and cytoplasmic acidification (upper traces) . External solutions : (A) standard DMG, pH 5 .80 ; (B) standard HEPES, pH 8 .40 . FIGURE 5 .
On the basis of the long-standing notion that plasma membranes of microorganisms are highly permeable to H ions (see above), it seemed likely that the CN--induced acidification might result from inward proton leakage uncompensated by normal pump-efflux . In the experiment of Fig. 5A, for example, 30 s after the introduction of CN- there is an inwardly directed electrochemical potential difference for H + (AAH+) = 170 mV (pHi = 7 .00, pH . = 5.80 ; Vrn = -100 mV) . However, further experime, its (Fig . 5B) showed that CN--induced acidification occurred essentially with the same time course even when the extracellular pH was kept at 8.40 . Hence t,-H+ = 0 just after CN - addition (pHi = 7 .05, pHo = 8.40 ; Vn, = -80 mV) . Because the absence of a net inward driving force on protons not only fails to halt the cytoplasmic acidification, but does not even modify its time course, an uncompensated
388
THE JOURNAL OF GENERAL PHYSIOLOGY " VOLUME 80 " 1982
proton leak cannot be responsible for the CN--induced acidification. Obviously another source of cytoplasmic H+ must be sought . DIRECT INHIBITION BY ORTHOVANADATE It has recently been shown that orthovanadate acts both as a potent inhibitor of the partially purified plasma membrane ATPase from Neurospora (Bowman and Slayman, 1979), and as a specific inhibitor of proton pumping, with little or no effect on the ionic leak pathways through the membrane (Kuroda et al ., 1980) . The effect of 1 mM
FIGURE 6. Effects of orthovanadate and cyanide on pHi (upper trace) and membrane potential (lower trace) . Cells were phosphate starved (to facilitate vandate entry) for 6 h in P-free DMM, pH 5.8. The experiment was performed in the same medium. Both orthovanadate and cyanide were used at 1 ITIM .
vanadate2 on pHi was surprisingly small, sometimes producing a -0.1-unit acidification, sometimes giving no discernable effect, and occasionally resulting in a slight pH increase, as shown in Fig. 6. Previous analysis (Kuroda et al., 1980), confirmed by the vanadate-induced depolarization in Fig. 6, indicates a threefold decrease of current flow through the proton pump ; but despite that implied reduction of H+ efflux, pHi was maintained near 7 .3 in the face of an inwardly directed AAH+ , equal to -130 mV . Strikingly, however, 2 This
relatively high concentration must be used in order to obtain a sufficient amount of vanadate ir. the cytoplasm for rapid inhibition of the pump . Because of this access problem, the cells must also be phosphate starved to derepress the phosphate transport system that facilitates vanadate entry.
SANDERS AND SLAYMAN
IntracellularpH and Metabolism in Neurospora
389
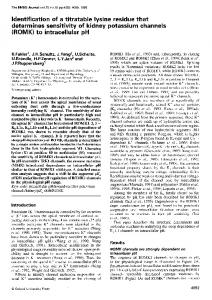
CN- still caused a 0.7-unit acidification, which could be reversed on removal of the respiratory inhibitor alone (Fig. 6). The overall effect of CN- in the presence of the specific pump inhibitor was thus similar to that in its absence. (Hyperpolarization of the membrane on CN- washout suggests that not all of the pump activity has been inhibited by vanadate, in agreement with the results ofKuroda et al . [ 1980]. After application of CN-, membrane resistance increases [Slayman, 1980] so that a rapidly rising [but small] pump current produces a large I-R drop, seen as membrane hyperpolarization .) These results strongly support the conclusions reached for application of CN- alone; viz., proton leakage into Neurospora plays a minor role as a source of cytoplasmic H+. Thus, metabolic changes induced by CN--whether or not the pump has previously been working-must constitute the major input to the cytoplasmic H+ pool. How can vanadate specifically inhibit the proton-extruding pump in respiring Neurospora without allowing H+-producing processes to lower cytoplasmic pH? Because a major source of H+ must be oxidative metabolism, it would seem that vanadate must also inhibit respiration and glycolysis in order to keep the cytoplasmic proton pool constant . Fig. 7 demonstrates that respiration is indeed partially vanadate sensitive in intact hyphae of Neurospora . Oxygen consumption is reduced biphasically over a 10-min period to ^-35% of the control value. The distinct presence of two components in the decline of respiration (time constants 0.4 and 5 .4 min in Fig. 7) indicates that vanadate action may be metabolically complex, but because of the speed of the initial response, it is likely that this part of the respiratory inhibition results from blockade of the proton pump at times when the internal concentration of vanadate is still low. This interpretation was supported by experiments on mitchondria isolated from Neurospora (Fig. 7B) . No inhibitory effects of 0.8 mM vanadate were observed either on electron transport, or on state 3 respiration. Since it takes 10 min for 0.8 mM vanadate to accumulate in the cytoplasm under these conditions (B. J. Bowman, personal communication), but the vanadate Ki of the partially purified membrane ATPase is 1 .5,UM, we conclude that the action of vanadate on respiration in vivo results from secondary effects following pump inhibition . Such effects do not directly touch electron transport, since the respiratory inhibition in vivo can be abolished by uncouplers (data not shown) . Therefore, it appears that a signal, whose role might be related to turning off H+ production by metabolism, is generated by the pump and acts on mitochondria at the level of oxidative phosphorylation. The concept of metabolic proton production can therefore provide an explanation for the observations in Fig. 6, because, under the influence of vanadate, output and input to the proton pool would be reduced, leaving only a small effect on pool size . Interrelations between the proton pump and oxidative metabolism are considered further in the Discussion . Intracellular Buffering Capacity
To calculate the quantity of acid added to, or subtracted from, the cytoplasm during various manipulations, the intracellular buffering capacity (t0i) must be known . It was measured in the experiments reported below.
THE JOURNAL OF GENERAL PHYSIOLOGY " VOLUME
80 - 1982
100
O w t C O
V 0
50 T
O E 'a N O
0
5 Time in Vanadate/Min
10
FIGURE 7 . Biphasic retardation of respiration by vanadate in suspension-cultured Neurospora . Cells were grown in shaking culture, harvested, and starved of phosphate for 3 h in P-free DMM . 02 consumption was measured in the same medium at 25 ° C with a Clark oxygen electrode (Slayman and Slayman, 1970 ; Lambowitz and Slayman, 1971), and 1 mM orthovanadate was added at time zero from a 200-mM stock solution, pH 9 .5. Respiratory rate was estimated at 10-s intervals from tangents drawn along the trace (inset A) Of 02 content of the chamber vs. time . Control rate = 44.8 I,mol 02/g dry wt -min. Data were fitted (solid line) by the equation
r= 24 .3 + 37 .1 " exp(-t/0.423) + 38 .6 " exp(-t/5 .35) where r is respiration rate as percent control, and t is time in minutes . Dotted line on inset A shows that for a separate batch of cells incubated in the presence of 20 mM phosphate (which competes with vanadate for entry), addition of vanadate was without effect . Inset B . Absence of inhibitory effect of vanadate on state 3 respiration of isolated mitochondria : oxygen electrode recording . Numbers in parentheses give the respiratory rate in microatoms of oxygen per milligram protein per minute . Respiration medium contained : 30 mM sucrose, 8 mM NaH2PO4, 5 MM MgC12, 0 .7 mM EDTA, and 1 mM NADH, pH 7 .2 . 5 Id mitochondrial suspension (0.143 Etg protein/ml), prepared according to Lambowitz et al . (1972), was added to the medium as indicated, and a basal respiratory rate was established . Where shown, ADP and vanadate were added to final concentrations of 0 .67 and 0.8 mM, respectively .
SANDERS AND SLAYMAN
Intracellular pH and Metabolism in Neurospora
391
Fig. 8 shows the effects of three different concentrations of butyrate (applied at pHo = 5.8) on pHi. After a short delay, which reflects the time taken for new medium to reach the cell, pHi decreased rapidly to a new stable value within 2.5 min. The new level could be sustained essentially as long as the recording lasted (in practice for periods of 10-15 min in butyric acid) with little or no tendency to return spontaneously to the control value. Upon washout of butyric acid, pHi returned promptly to the control level, again (7.12)
(6.65) wash
(6.28)
ApH
l 0
1 5
(5 .96)
0.5 I 10
loq[Butyratel I 15
1 .5
Time in butyrate /min FIGURE 8. Lowering of pHi by external butyric acid. Results from three different hyphae exposed at time zero to various concentrations, indicated at left, of butyrate/butyric acid in standard DMG, pH 5 .8. Bracketed numbers indicate pHi at the break in each trace. Uppermost trace also shows restoration of pHi to the control level with washout of butyric acid. The inset displays the same data, replotted to show the near linearity of the change in steady state pHi with log (butyric acid concentration) . without a large overshoot. AS is expected from ordinary buffer considerations, the magnitude of the pH change induced by butyric acid was not proportional to the butyric acid concentration itself, but rather to the logarithm of the butyric acid concentration (Fig . 8, inset) . To shift pHi in the alkaline direction, a weak base is required that can appreciably bind protons within the cell. Optimally, the pKa of the base
THE JOURNAL OF GENERAL PHYSIOLOGY " VOLUME 80 " 1982
392
should be higher than pHi, and a correspondingly high external pH must be used in order to generate sufficient free base externally. Procaine (pK. -9 .0), applied in millimolar concentrations at pHo = 8.2, gave the predicted effect on pHi, as shown in Fig . 9. The rise of pHi was -0.4 unit with 5 mM procaine, and, like the response of pHi to butyric acid, was complete within 3 min. Unlike the results with butyric acid, there was a slight systematic tendency for
ApH 2mM procaine (7.55)
(7.70) log [procaine)
5mM procaine
1
/0- (775)
(739) (7.99 15 mM procaine
wash
(7.33)
(729) 0
5
10
Time in procaine/min
FIGURE 9. Elevation of pHi by the weak base procaine . Results are from three different hyphae exposed at time zero to various concentrations of procaine, indicated at left, in standard HEPES, pH 8 .2 . Bracketed numbers indicate pHi at the break in each trace . The lowest trace also shows the time course for restoring pH; to the original level upon washout of procaine . The inset displays the same data, replotted to show near linearity of the change in pHi with log (procaine concentration) .
pHi to return to the control value in the continued presence of the base (trace B), and also for a small overshoot when the base was washed from the cell (not shown) . By applying Eq . 1 to several concentrations of butyric acid and procaine (producing many different values of pHi), a general curve of lai vs . pHi could be calculated . The summary results of such calculations are plotted in Fig. 10 .
SANDERS AND SLAYMAN
IntracellularpH andMetabolism in Neurospora
393
Internal pH 10 . Cytoplasmic buffer capacity (fli) as a function of internal pH, determined by the weak acid/weak base method . Each point represents a single determination at the specified concentration of butyric acid or procaine . Points are plotted at the midpoint of the pH; over which individual values of fi were measured. Filled symbols : butyric acid at pH. = 5 .8; open symbols : procaine at pH. = 8 .2 . Circles (" , O) : 5 mM ; squares ( ", E1) : 15 mM ; open triangles (0) : 2 mM procaine ; inverted closed triangles ( " ) : 50 mM butyrate. The curve was fitted to the plotted points by a nonlinear least-squares procedure (Marquardt, 1963) using the following equation for total buffer capacity of a binary buffer system : FIGURE
i(3s = #I + #2 = 2.303[H+]1(H
C + KI)2 + (H+CKz) 2 ]'
where t8 1 and t82 are the buffer capacities contributed by the two dissociable groups, H + is the prevailing proton concentration, KI and K2 are the dissociation constants for the two groups, and CI and C2 are the corresponding group concentrations . The fitted values are as follows : KI = 6 .9" 10-7 M (pKa = 6 .16), K2 = 3 .4-10 -9 M (pKa = 8.47), CI = 159 mM, C2 = 103 mM. The significance of these values is discussed in the text.
THE JOURNAL OF GENERAL PHYSIOLOGY " VOLUME 80 " 1982
394
At the normal pHi of 7 .2-7 .4, fli is 30-35 mM Hi'/pH unit . The general form of the data in Fig. 10 indicates that the pHi dependence of fli cannot arise from titration of a single ionizable group, which would produce a bell-shaped curve. However, the data can be fitted by the sum of two titratable groups, each with a pKa well removed from normal values of cytoplasmic pH. The optimal values for these pKa's appear from the fitted curve in Fig. 10 to be 6.16 and 8.40. DISCUSSION
Normal pH, of Neurospora
A previous estimate of pHi in Neurospora from the distribution ratio of the weak acid 2,4-dinitrophenol (DNP) (at non-uncoupling concentrations) resulted in an absolute value of pHi of 6.4 at pH. = 5 .8 (Slayman and Slayman, 1968) . The present direct measurements find a value that is almost 1 pH unit higher, which suggests that in the case of DNP, the anion may be substantially permeant . An absolute value for pHi of 7.2-7 .4, reported in the present work, is in close agreement with values obtained from a variety of animal and bacterial cells by the more reliable methods of recessed-tip pH electrodes (Roos and Boron, 1981) or 31P-NMR (Ugurbil et al ., 1979 ; Slonczewski et al ., 1981) . pHi Changes Produced by Weak Acids and Bases: Measurement of fli Our estimate of cytoplasmic buffering capacity at normal pHi is also in good agreement with estimates for other cells, obtained either by identical methods (giant barnacle muscle fiber: Boron, 1977 ; snail neurone: Thomas, 1976), by weak acid/base pertubation combined with 31 P-NMR (yeast : A. BallarinDenti, unpublished data), or by direct titration of de-energized cells (Micrococcus : Scholes and Mitchell, 1970 ; Streptococcus: Malone, 1979). A noteworthy feature of all studies on whole cells, as well as those on isolated mitochondria (Mitchell and Moyle, 1967), is the finding that Ni increases steeply as pHi is lowered . This presumably indicates that the major buffering groups have pK.'s far more acidic than normal pHi, and is consistent with the idea that amino acid side chains of proteins constitute the major cytoplasmic buffer . With the exception of the histidyl residue, all side chains have pK.'s outside the pH range 6-8, which would give a minimum value of fli at the normal pHi and maxima at the pKa's of the dominant charged amino acids (i.e., at both higher and lower pH's) . It follows from this that the remarkable uniformity of fli over the whole phylogenetic range from bacteria to mammals would be explainable on the basis of the fundamental similarity of protein composition. Role of the Cytoplasmic Buffer in pHi Stabilization Although the concentration of buffer-bound protons exceeds by more than five orders of magnitude the concentration of free protons, the buffer cannot be viewed as true pH regulator for anything more than very small acid or alkaline assaults . Suppose, for example, a normal, steady, pumped proton
SANDERS AND SLAYMAN
IntracellularpH and Metabolism in Neurospora
395
efflux of 100 pmol cm -2 s-I, as previously calculated for Neurospora (Gradmann et al., 1978) ; sudden cessation of the pump, with all other metabolic processes continuing, would result in decline of pHi at the rate of 0.6 unit min-1 for a cell of 14,um diameter and buffering capacity of 40 mM H+/unit. Relative Insensitivity ofpH to Changes in pH,, Near-independence of pHi from pHo makes good sense for any free-living organism, such as Neurospora, which may need to survive and grow over a wide range of external pH (C . L. and C. W. Slayman, unpublished observations) . Similar insensitivity has been demonstrated for yeast and bacteria (e.g., Navon et al ., 1979 ; Slonczewski et al ., 1981) . The result is nevertheless surprising in view of the generally accepted transport model for plasma membranes of these and other nonanimal cells, which includes a large passive influx of protons (Harold, 1977 ; Slayman, 1977 ; Walker, 1980) . At least two of the observations reported above are not in agreement with the simple H+ conductance model. First, even when the H+ pump is inhibited, H+ does not reach electrochemical equilibrium across the membrane, as would be expected if the leak to H+ were dominant . For example, in Figs . 5A and 6, AAH+ is -130 mV in the presence of each inhibitor. Second, Fig. 5 shows that when the pump is . Thus, the transmembrane leak of, inhibited, pHi is still independent of pH, H+ into the cell must be small, and the major source of cytoplasmic H+ must be internal . Given this conclusion, there is no a priori reason pHi should respond to pHo. The relative lack of response of pHi is impressive as a homeostatic phenomenon, but not necessarily indicative of feedback regulation of pHi. It is possible that the small dependence on pH o that is seen results from changes in the activity of the H+ pump, and this idea is currently under investigation.
Origin of Cytoplasmic H + Under aerobic conditions, protons will be generated in the cytoplasm from several sources : C02/H2CO3, protein synthesis (Raven and Smith, 1976a), and Krebs-cycle acids (which are secreted in large amounts by Neurospora : C. L. Slayman, unpublished observations) . A question now arises concerning the origin of cytoplasmic H+ in the presence of CN- . It seems most likely that the production of acidic glycolytic end products is responsible, since this is the widely used method of regenerating oxidized pyridine nucleotide in aerobes deprived of oxygen as an electron acceptor . Similar cases of acidosis are seen in squid axons upon addition of metabolic inhibitors (also, in the presence of outwardly directed AAH+) (Boron and De Weer, 1976) ; on removal of oxygen from mammalian muscle tissue (Garlick et al ., 1979) ; in glucose-derepressed yeast (den Hollander et al., 1981) ; and in E. coli (Ugurbil et al ., 1979) . The total production of acid equivalents in response to CN- can be estimated as 35 mmol/kg cell water, taking for fli an average value of (-) 50 mM H+ /unit over the pHi range 7 .0-6 .3 . (Net acid secretion by the cell stops in the presence of CN - [Slayman, 1970] .) The initial rate of H+ production after application of CN- is 12 mM/min (dpHi/dt = 0.3 unit/min, Ni = [-]40 mM H+/unit at pHi = 7 .0) . This is compatible with a normal rate of glucose
396
THE JOURNAL OF GENERAL PHYSIOLOGY " VOLUME
80 " 1982
use of 2 .7 mM/min (Slayman, 1973), which could yield as much as 16.2 mM H + /min for complete oxidation of the sugar. Under anaerobic conditions (CN - ), the yield of H + should be less than this . Metabolism, the Proton Pump, and Control of pHi Because H + entry into the cell is small, control of pHi must result from the balance achieved between metabolism (the major producer of H'}) and the operation of the H + pump (the site of H + ejection from the cell) . Which of these two processes is regulated to stabilize pHi? At present we do not have sufficient information to give a rigorous answer to this question, although one observation reported here indicates a dominant role for metabolism : whether the H + pump is working normally (Fig . 5A) or is severely curtailed (Fig . 6), recovery of pHi after CN - treatment takes place at the same rate and to the same extent . This suggests that under some circumstances, metabolism can actually consume H + , as would occur, for example, if acidic glycolytic products were converted to neutral compounds . On the other hand, when an acid load is imposed with butyric acid (Fig . 8), fairly large increases in pump activity have been recorded (Sanders et al ., 1981), and there is little effect on oxidative metabolism under these conditions (D . Sanders, unpublished experiments) . The nature of the response to an acid load therefore seems to depend on the particular form that the load takes . In other words, proton concentration is probably not the only error signal involved in regulation of the pump and metabolism . Control ofpHi in Relation to Other Physiological Parameters The requirement for additional error signals can be rationalized by considering at least two functions of the proton pump and oxidative metabolism that might act to compromise the role of each in pHi control . (a) AAH+ . Uptake of many solutes in microorganisms is energized by DAH+, and the present work provides some evidence that DAH+ might itself be tightly controlled, at least in the pH range more acid than the normal growth pH . Fig . 11 is a replot of the data in Fig . 3, and shows that, with a slight lag, changes in membrane potential act to compensate, or even overcompensate, for the change in OpH . The result is a tendency for QAH+ to return to near the control value after a transient overshoot and undershoot . The time course of this slower change in membrane potential is shown in Fig . 3 to correspond with that for the small change in pHi, and on the basis of previous currentvoltage measurements of the plasma membrane with acid pHi, probably originates from an increase in membrane leak conductance (Sanders et al ., 1981) . 3
3 The membrane potential can be replotted as a function of pHi (over the range where pH. has stabilized) to yield an apparent dependence of membrane potential on pHi of 120 mV/unit . This value is in reasonable agreement with that published earlier (Sanders et al ., 1981) where pHi was lowered with butyric acid-a value of 170 mV/unit can be derived from those data.
SANDERS AND SLAYMAN
Intracellular pH and Metabolism in Neurospora
397
-100
-200 MV
-300
-400
Relative constancy of the driving force on protons (DAH+) during and after decrease of pH. . Data from experiment shown in Fig. 3 have been replotted to show variation with time of 4H' and its separate electrical (Vm) and chemical (OpH) components, all expressed in units of millivolts. Note the slower response of Vm, which tends to restore 4H+ after the initial perturbation caused by the change in bpH. FIGURE
11 .
(b) ATP. The requirement for stable intracellular ATP pools apparently must also involve modulation of both the H+ pump and oxidative metabolism, since the pump is a major consumer of ATP (Slayman et al ., 1973). In this context, a pH-independent mechanism for feedback inhibition of respiration during blocking of the pump by vanadate (Fig . 6) is required, since [H +]i is not elevated and cannot serve as an error signal . The situation is reminiscent of that in animal cells, where the dominant electrogenic pump (the Na + K ATPase) may exert negative feedback on oxidative metabolism, via the ATP/ ADP ratio (Whittam, 1961 ; Blond and Whittam, 1964 ; Balaban et al ., 1980) . It is probably, therefore, too oversimplified an approach to look for a unique regulator of pHi in organisms where the H+ pump is intimately involved in other metabolic processes ; ultimately the maintenance of constant pHi will rely on the manner in which the pump is integrated into those processes . Kinetic investigations in the alga Nitella have already provided evidence for the existence of a feedback loop between metabolism and the proton pump (Hansen, 1978, 1980, 1982) and the challenge will now be to assign biochemical identity to such links.
39 8
THE JOURNAL OF GENERAL PHYSIOLOGY " VOLUME
80 " 1982
APPENDIX
Correction of Recorded pH for Slow Electrode Response to Vm and pHi Background
In general, the pH traces [pHi(meae)] that represent the primary data in most of the experiments described above should show three distinct components during experimental manipulation : ApHi(meas) = L1mp Hi(t ) = FI[OpHi(t)] + F2[AVm(t)] - OVm(t),
(A1)
in which OpHi(t) and AV,, (t) represent the variations of internal pH and membrane potential, respectively, with time (t) after the onset of an experimental change . Fl and F2 are the fractions (