Table of Contents
Go Back
Controlling Company Knowledge Productivity Index through The 4-Dimensional Cost of Management Model: System Dynamics Approach By Omar El-Badry Sales and Procurement Manager, EMEC
[email protected] Mohamed Kholief Web and Software Development Manager, GoodNews4ME 2 Abdel Kader Hamza St., Garden City, Cairo, Egypt
[email protected] Yasser Abouelenein Network Access Transmission Manager, Vodafone Egypt Dallah Tower 7 A Corniche El Nil, Maadi, Cairo
[email protected] Khaled Wahba Assistant Professor, Systems and Biomedical Engineering Department Faculty of Engineering, Cairo University Tel: +2 02 737 6006, Fax: +2 02 739 1380
[email protected]
ABSTRACT Knowledge has become the vital source of company’s competitive advantage. It also has become accepted that knowledge represents an intangible as well as significant cornerstone of a company’s market value and hence an asset to be measured and managed, just like others tangible assets are measured and managed. So, no wonder that knowledge-workers have now replaced capital and labor as the scarce resource limiting growth. As a result, there is already an expanding literature on the subject – much of it theoretical, but all regarding the identification and management of a company’s knowledge assets as crucial for commercial success. This paper is about how organizations can better manage their knowledge, viewed from a practical standpoint with the emphasis on the impact of investing in knowledge on a company’s productivity. Investment on knowledge management in this study has been subdivided into 4 main categories (dimensions), namely; investing on Training, allocating budget for Total Quality Management, Investing on Internal Organization Learning, and finally, Hiring New Skilled and Experienced employees. So, all costs associated to the above mentioned dimensions are considered the cost of management, that will be used to evaluate the company’s productivity index using the system dynamic approach in order to quantitatively getting the sense of the subject.
1
The proposed model is an initial attempt to build a viable predictive model for application of Knowledge Management in businesses. The model should assist managers to increases competitiveness of the company by applying knowledge management practices.
KEYWORDS Knowledge Management, Cost of Management, Tacit Knowledge, Explicit Knowledge, Company Shared Knowledge, Knowledge Productivity Index.
INTRODUCTION Peter Drucker in his article (Drucker, 2000) pointed out that although the production equipment was the most valuable asset for the company in the 20th century, knowledge workers and their productivity will be the most valuable asset of the company in the 21st century. The history witnessed throughout different episodes the efforts and trials in defining productivity with the objective to improve it. The researches also have witnessed the change in the attention of the researchers from emphasizing on the manual-worker productivity to the knowledge-worker productivity. Different approaches and methodologies have been adopted and applied to making manual workers more productive. Manual workers were lucky to have the more-than-hundreds-year of attention from researchers. However, few researches have just started to tackle the Knowledge-worker productivity. The companies in the developed countries – after Drucker – have to emphasis on the knowledgeworker productivity, as it is their first survival requirement, if they want to maintain themselves, their leadership and their standard of living. For Drucker emerging and developing countries still have to finalize their role and job to improve the manual-workers productivity before they start to enter the era of knowledge-worker productivity, which can take from 30-40 years. In other words, he wanted to point out that those countries still are behind the developed countries with the distance of that period of time. By that time the developed countries can expect to have significant advantage, both in quality and quantity, which ensures their leadership.
PROBLEM DEFINITION AND OBJECTIVE All countries whatever their economic status can have the same and all chances to leverage their productivity whichever the methodologies and principles they adopt or/and adapt, as long as they have the least potential to build and develop knowledge-workers without ignoring the still-toimprove of the manual-workers productivity. Making knowledge-workers more productive requires changes in basic attitudes not only from the side of the individual knowledge-worker, but also from the side of the whole organization. Changing attitudes is not the only requirement, but also the continuous innovation as well as continuous learning and teaching have to build into the job, all within the framework of what is so-called “Knowledge Management”. So, companies should not look at the associated costs as components that should be added to expenses of the companies. On contrary, building and development of knowledge-workers have to been seen like investment in the company assets.
2
So, the objective of this paper is to study the impact of such investment on the requirements (enablers) for productivity of the whole company. In other words, it is the aim of this paper is to evaluate the return on investment on knowledge management elements, by measuring the company knowledge productivity index. Doing so, different methodologies can be used, however one of the objectives of this paper is also to make use of the advantage of the system dynamic approach as a tool to highlight the importance of such investment and to show its return.
STATE-OF-THE-ART The current researches in Knowledge Management can be classified into three main categories according to their purpose: Researches seeking to explore the importance of Knowledge Management on the company performance: Within this category, researchers divided Knowledge into Explicit Knowledge and Tacit Knowledge of individuals. They discussed how Individual Knowledge build-up through the three learning channels: training, studying, and experience. While companies are growing, individual experience is built-up automatically, and by return enhances the company overall Knowledge. On the other hand, training and teaching are initiated by management to improve the learning process; however, their effect is heavily depending on individual’s intelligence, motivation, and their willingness to learn. According to Koenig/Membrillo, companies’ Intellectual Capital increases by the Explicit Knowledge and the fraction of Tacit Knowledge convertible to Explicit. However, we believe that core competences are those competitive advantages embedded in companies’ performance and cannot even be recognized by employees. While researches made good achievements to identify learning process, and how Individual Knowledge may affect companies Applicable Knowledge, they lack to assess the financial impact of knowledge. In today world, it is impossible to convince management to make any move without quantifying its cost and benefits. Even management recognized Knowledge importance; they need tangible indicators to assess worthiness of budget spent to improve it. Consequently, Knowledge Management expenditures are always the first victim of cost cutting programs. ABB, one of the giants in the electrical industry, was applying a networking program, the so-called “International Training Program”, aiming to manage Knowledge through its 140 countries of activities. The program was seeking to gather employees with average experience of 3-5 years in ABB aging less than thirty, whom we could expect to be the future middle management. At ABB campus in Sweden, participants from 19 countries attended management lectures and workshops in order to create same culture across countries and to assure that all ABB employees speak the same language, which eliminate barriers between line managers and enable them to share Knowledge more efficiently. During such meetings, lasting for three months, employees shared their experience, and when returning back to home countries, all participants remain in contacts and support each others solving work problems. As soon as financial indicators decayed and cost cutting programs started, the ambitious program was hold. If top management could evaluate clearly the financial effect of such program, may be they would change their decision.
3
Researches addressing the different ways to manage Knowledge: This category is considering mainly different ways of managing Knowledge especially within wide spread multinational organizations. The objective is to find efficient tools to convert Explicit & Tacit Individual Knowledge to company Knowledge Capital. One of the comprehensive models in this field is the ‘T-Shaped Managers” model by Morten T. Hansen and Bolko von Oetinger. They stated as follows: “You might ask, Why rely so heavily on managers to share knowledge? Why not just institute a state-of-the-art knowledge management system? The trouble is that, while those systems are good at transferring explicit knowledge-for example, the template needed to perform a complicated but routine task – direct personal contact is typically needed to effectively transfer implicit knowledge – the kind that must be creatively applied to particular business problems or opportunities and is crucial to the success of innovation driven companies.” According to their findings, managers must act in two areas; Horizontal part of “T” with the objective to share knowledge with different Business Units through peer groups, transferring expertise, sharing critical decisions, etc. as well as Vertical part of “T” with the objective to secure their own Business Units performance and results. Top management award managers for both roles not only for their vertical roles as it used to. The model touches the financial impact of Knowledge Management as increasing revenues and saving expenses, however, the model still not reliable enough and cannot be treated as generic model from financial point of view. Researches trying to find the financial value and indicators of Knowledge: Articles in this category are scarce, but one of the practical and comprehensive researches is by Paul A. Strassmann, 1996. In his research, Strassmann tried to measure the financial Cost & Effect of managing Knowledge, as well as the market value of companies’ Knowledge Capital. He based his findings on the famous physical law and system view “There is no Output without Input”. The theory can be summarized as follow: Using traditional financial tools, i.e. Capital Asset Pricing Model, one can identify the required return at a certain risk level and business environment. After calculating companies’ net income, we may deduct the expected return on equity, i.e. net income – (ke*equity). By doing so, we eliminated all return on financial input such as interest, taxes, preferred stock, and owner equity. What does the surplus reflect? It simply reflects the Management Value Added. The Management Value Added is the obvious reflection of the Management Knowledge. What is the input to get the measured return? Simply it is all costs not related directly to the delivered goods/services, or what he called Cost of Management, such costs are traditionally recognized as overhead. “Management Value Added is what is left over after obviously all costs are fully accounted for. This calls for subtracting from the Profit after Tax an allowance for the costs of shareholders’ equity as well as other adjustments to correct for accounting peculiarities largely influenced by the tax code.” mentioned Strassmann. “Rigorous cost analysis is necessary to isolate all expenses that cannot be
4
directly attributed to the delivery of goods or services to customers and then designate them as the Costs of Management”, pointed out Strassmann in his article. By dividing the Management Value Added by Costs of Management, we get a new indicator ReturnOn-Management (R-O-M). The R-O-M is the financial indicator of Knowledge. As a good approximation, he used the Sales, General & Administrative expenses item mentioned in the published financial statements. He used this indicator to create a company ranking called Information ProductivityTM (strassmann, 1996). He went further to assure that investors recognized the value of the management Knowledge, which is the difference between the market share price and its book value. However, we are not convinced by his method to evaluate Knowledge Capital, as we believe that he would use the difference between the market value of shares and their book value instead of just dividing the Management Value Added by the weighted Average Cost of Capital as an approximation of the cost of Knowledge Capital, since there is no evidence to illustrate such approximation. The change in that difference determines the market price of the Knowledge Capital. In addition, we would base our comparison using Industry Average Knowledge Productivity in order to take into consideration external factors, which may affect the Management Value Added and the related Costs of Management, i.e. PEST factors.
SYSTEM DYNAMICS APPROACH Believing in the advantage of the system dynamics approach in different fields, the researchers have suggested using it to show the financial impact (return) of Knowledge Management on company productivity. A simulation model has been built with the emphasis on the 4-dimenasional expenses (investments) model; Learning, Quality, Networking as well as hiring (adding) new experiences to the already existing pool. Figure 1, shows the interrelated elements of the proposed model.
5
(I) Individual Knowledge
Learning-By-Experience
(II) Knowledge Transfer
(III) Knowledge Accumulation
(IV) Knowledge Evaluation
Tacit & Explicit Knowledge Flow Company Culture: • Team-working • Economic Transparency • Networking • Intelligence • TQM
Company Knowledge
Company KPI Vs. Industry KPI
Tacit & Explicit Learning-By-Training Knowledge Flow
Figure 1: Block Diagram for Knowledge Management Proposed Model
PROBLEM ARTICULATION Here are the key variables of the proposed model to be defined and explained as follows: (Note that some of the below definition have been supported by the cassell consice dictionary, 1997) Key Variables: Networking: A group of people who are useful to each other because of the similarity of their aims, background etc. Team-working: A group of people who work together for the same purpose. Economic Transparency: The quality of being clear and transparent in presenting economic data. (http://www.hyperdictionary.com/dictionary?define=transparency) Individual Tacit Knowledge: An important cognitive dimension embedded in individual experience and involves intangible factors such as personal belief, perspective and the mental models (Nonaka, 1991). Individual Tacit Knowledge Conversion Rate: The change from one state to another of the individual familiarity or understanding gained by experience or study or from instruction implied but not actually expressed. 6
Average Individual Intelligence: The mean rate or value of the acquired knowledge, which is a characteristic of a particular person (intelligence: quickness or sharpness of intellect). Individual Explicit Knowledge: Knowledge, which can be articulated in formal language including mathematical expressions and manuals (Koenig, 1998). Individual Explicit Knowledge Conversion Rate: The change from one state to another of the individual familiarity or understanding gained by experience or study or from instruction implied and is serving to explain or interpret. TQM effort/commitment: Total Quality Management, in industry, a systematic commitment to quality of product and customer service while increasing efficiency and reducing costs. Knowledge Productivity Gap: Difference between Average Industry Productivity Index and Company Knowledge Productivity Index. Knowledge Productivity Index: A numerical scale indicating variations in the efficiency in the production desired by the company by reference to a given base level; Management Value Added divided by Cost of Management (Strassmann, 1996). Company Shared Knowledge: The part to which one has a right or which one is obliged to contribute, a fair or just portion of the familiarity or understanding gained by experience or study or from instruction, for the whole company. Skilled Employees Turnover: The rate at which the experienced, highly trained employees leave and have to be replaced. Job Satisfaction: Job satisfaction is a summary evaluation that people make of their work. People’s levels of job satisfaction are the result of their job tasks, the characteristics of the organization in which they work, and individual differences in needs and values (Hodson and Sullivan 1995). Experience: The knowledge gained by observation or trial. New Comer Experience: The required threshold experience of new comers. Training: The preparation of a person for a particular activity, occupation. Best Practices: It is a state that every one in the company knows what do in a specific situation and what not to do. Applicable Knowledge: The familiarity or understanding gained by experience or study or from instruction, which is capable of being applied. Epiphanies of Scale: Creative insights that a hot start-up company that has a fewer intellectual resources may not be able to achieve (Hansen and Von Oetinger, 2001).
7
Entry Barrier: Immaterial obstruction to become a competitor in an industry Decision Quality: The degree of excellence, relative goodness of the determination of a trial, contest or question. Cost of Shareholder’s Equity: Obtained by multiplying the Shareholder Equity shown on the Balance Sheet by the costs of Shareholder Capital Management Value Added: The difference between the final value of goods/services and the cost of manufacturing and marketing it resulting from the act of managing; what is left over after absolutely all costs are fully accounted for (Strassmann, 1996). Cost of Management: The price charged or paid for the act of managing; all expenses that cannot be directly attributed to the delivery of goods/services. Desired Knowledge Productivity Index: The average of the efficiency in the production of the familiarity or understanding gained by experience or study or from instruction in a field of activity organized for economic gain. Obsoleteness: The property of being out of date and not current. (http://www.hyperdictionary.com/dictionary/obsoleteness) This set of variables provides a reasonable starting point, for conceptualization of the feedback structure; governing the dynamics of the “Controlling Company Knowledge Productivity Index through the 4–Dimensional Cost of Management Model.
CAUSAL LOOP MAPPING Next we are going to use the description of the systems and reference modes to develop the causal loop of the feedback processes we believe are responsible for the dynamics of the model we are discussing. The overall Causal Loop Diagram is shown in figure 2 (see appendix A). DIMENSION 1 -- THE “INTERNAL EXPERIENCE LOOP”: BALANCING LOOP The “Transparency”, “Teamworking” and “Networking” are assumed to be exogenous variables: once any combinations (or only one variable) of these variables increase, based on the management decision, the “Individual Tacit Knowledge Conversion Rate” will increase. By new hiring (based on certain criteria), this will in turn increase the “Experience”, hence the “Individual Tacit Knowledge Conversion Rate” will also increase see figure 1. Doing so, the “Company Overall Shared Knowledge” increases, hence the individual “Experience” will increase. This basically will motivate the employees and will make them satisfied with their job “Job Sat”, which eventually will decrease the “Skilled Employees Turnover”. Consequentially, the decision to hiring new skilled employees will not be taken frequently, that might stop the flow of new blood. So, here the company should decide to build and develop new experiences internally through the other dimensions (see the other loops below), rather than acquiring it externally.
8
Skilled Employess Turnover
Osoleteness Rate
New Comer + Experience
Job Satisfaction
Int. Exp + Experience
+ + +
Individual TK
Company Shared Knowledge
+
Individual TK CR +
Best Practices
+
+
+
Quality
Management Value Added
+ +
+ Industry Average Productivity Index
+
+
Co. Knowledge Productivity Index -
+ Cost Of Management
Training Budget
Cost of Shareholders' Equity -
+
Training Budget
+ Entry Barrier
Profit
+ TQM
Revenues
+
Expenses -
Individual XK CR + +
Learning
Epiphanies of Scale
-
+
+
Training
+
Decision Quality -
+
Applicable Knowledge
Direct Costs
Individual XK +
+
+
+
Avg. Individual Intelligence
+
-
-
Networking +
+
Teamworking +
+
+
Economic Transparency
+
Knowledge Productivity Gap
+
Figure 2: Causal Loop Diagram THE “TRAINING BUDGET LOOP”: BALANCING LOOP If the company management decided to capitalize on its existing human resource by investing in the training, so the “Training Budget” will increase and hence giving the chance to have more effective “Training” that hence increases the “Company Overall Shared Knowledge”, and then the individual “Experience”. DIMENSION 2 -- THE “LEARNING LOOP”: BALANCING LOOP Based on the performance of the company in the industry, the “Desired Knowledge Productivity Index”, exogenous variable, can be increased in case of high competition in the market. Once this variable will increase, this will lead to an increase in the “Knowledge Productivity Gap”. This in turn increases the chance of management decision either to increase “Training Budget” to leverage “Individual Knowledge (both the explicit and the tacit)” as well as the “Company Knowledge Productivity Index” through increasing the effective “Training” and the “Company Overall Shared Knowledge” with the objective to cope with the “Desired Knowledge Productivity Index”, or to encourage the “Total Quality Management Expenditure” a mean to increase the “Individual Explicit Knowledge” which contributes in building the Quality Loop, see below. DIMENSION 3 -- THE “QUALITY LOOP”: BALANCING LOOP As mentioned above one of the alternative decisions that the management can make as a result of increased “Desired Knowledge Productivity Index”, is to increase the expenditure on the “Total Quality Management” as a way to ensure increasing the “Individual Explicit Knowledge”, which in turn leverage the “Company Overall Shared Knowledge”, hence the “Company Knowledge
9
Productivity Index”. Consequently the “Knowledge Productivity Gap” will decrease, which constitutes the balancing loop that limits the investing in the “Total Quality Management”. DIMENSION 4 is represented by controlling (managing) the overall experiences inside the company acquired through the Learning, the Networking, the Quality Dimensions and through hiring new skilled employees (with certain experiences/intelligence level). It is important to notice that “Experience” has three effects: first, when employees acquire experience over time, they will need less “Training”, they may as well conduct training courses or on-job training for new incomers, which will decrease the “Training Budget”. Secondly, having such employees, the company “Tacit Knowledge” will increase allowing other mechanisms – “Teamworking”, “Networking”, & “Transparency” – to enhance the “Individual T.K. Conversion Rate”. Finally, the only negative effect of “Experience” is that experienced employees will definitely have higher salaries and they will have retirement compensation, which will increase “Cost of Management”. This last effect is compensated by the first two effects only if the company is applying knowledge management program. On the other hand, if knowledge management is ignored, our model proves that the company is paying for a certain asset without being deployed.
SIMULATION MODEL FORMULATION A stock and flow model has been developed (Figure 3) from the Causal Loop Diagram with additional scaling variables to adjust the scaling of the resultant graph. Moreover, to facilitate reading the stock and flow model table 1 indicates the mapping of causal loop diagram variables into the abbreviated variables in the simulation model and table 2 explains the auxiliary variables functionality. Table 1: Mapping the Variables in the Causal Loop Diagram into the Variables in the StockFlow Model Abbreviation Full Name New Comer Exp New Comer Experience Ind TK CR Individual Tacit Knowledge Conversion Rate Ind TK Individual Tacit Knowledge Ind XK CR Individual Explicit Knowledge Conversion Rate Ind XK Individual Explicit Knowledge Job Sat Job Satisfaction Delay CSK to Exp Delay due to converting Company Shared Knowledge to Experience CSK to BP delay Delay due to converting Company Shared Knowledge to Best Practices Convert to BP Converting Company Shared Knowledge to Best Practices BP Stream Best Practices Stream Desired KPI Leverage Delay Inflow of Leverage Req Leveraging Desired KPI
Delay due to request to leverage the Desired Knowledge Productivity Index (KPI) Request to Leverage KPI Leveraging Desired Knowledge Productivity Index (KPI)
10
Desired KPI MVA TQM Art Delay
Desired Knowledge Productivity Index (KPI) Management Value Added Total Quality Management Artificial Delay to simulate delay in Reinvesting Decision
Table 2: Auxiliary Variables added to the stock and flow to facilitate simulation Variable Description Magmt Factor The intervention by Management to enforce Best Practices Aux Auxiliary Variable function is to help in setting the obsoleteness rate value TBManagement Training Budget Management controls to what limit should the company increase or decrease the training budget Competitor Pressure It is the pressure exerted by competitors to take the brilliant skills from the company in order to gain more ready to apply knowledge and also to weaken their competitor. Management Intervention Management Intervention is making the reverse action to the competitor pressure. It tries to increase the job satisfaction through incentives, policies,…etc Time Constant Necessary for the Art Delay Management Strategic Decision Strategic Decision here is to increase or decrease the Desired Knowledge Productivity Index Magnitude o Profit Effect It depends on the company culture. It determines upon profitability whether to increase Desired KPI or to keep it low. Decision Quality Sign It is considered Sign on both profitability of the company and its performance against the Desired KPI. If it is performing well, the probability will increase to affect the decision quality positively and accordingly the revenues will increase and expenses will decrease. On contrary, If the company is not performing well, the probability that the Decision Quality will be affected negatively is higher. The following assumptions must be taken into consideration: •
• • •
Individual Tacit Knowledge CR is assumed to have S-Shaped curve and on the other hand the Individual Explicit Knowledge CR takes the form of a goal seeking curve. The assumption is based on the hypothesis that acquiring Tacit Knowledge (TK) is more difficult than acquiring Explicit Knowledge (XK). It is assumed that the contribution of both TK and XK is different in weights when affecting the Company Shard Knowledge. Experience adds more to TK than XK Training adds more to XK than TK 11
• • •
Company Shared Knowledge is converted to Applicable Knowledge through Best Practices identification Applicable Knowledge affects Sales Revenues more than the Decision Quality Decision Quality affects Expenses more than the Applicable Knowledge
12
Skilled Employees Turnover Competitors Pressure
Delay CSK to Exp
New Comer Exp
Economic Transparency
inflow
outflow
Job Sat
~ Networking
Management Interevention
~ Teamworking
Profit
Corporate Culture
New Comer Exp Avg Individual Intelligence Company Shared Knowledge Ind TK
Experience
~ Ind TK CR
Scale
~ Ind XK CR
Training Budget Training
outflow
Inflow
Aux
Decision Quality
Obsoleteness
Ind XK Avg Individual Intelligence
CSK to BP delay
Reinvesting TQM
BP stream
Convert To BP Mgmt Factor
Epiphanies of Scale
BP stream
Profit
Applicable Knowledge
Best Practices
historical Expenses
Decision Quality
Entry Barrier
Profit Knowledge Productivity Gap Sales Revenue ~ Networking
Expenses Direct Cost and Other Costs Control
historical Revenues
Decision Quality Sign
Decision Quality Sign
Direct Cost and Other Costs Desired KPI Leverage Delay
Experience Cost of Management
inflow of Leverage Req
Leveraging Desired KPI
Cost of Management Control Training Budget TQM TBManagement MVA
Reinvesting
Magnitude of Profit Effect
Cost of Shareholder Equity
Time Constant Inflow invest
Management Strategic Decision Knowledge Productivity Index Dividend Decision Art Delay
Desired KPI Knowledge Productivity Gap
Figure 3: Stock and Flow Diagram
13
TESTING MODEL AND SCENARIO/POLICY ANALYSIS Taking the assumptions mentioned and described above into considerations, the model has been tested and we can conclude the following: • For the Company Shared Knowledge in the normal situation we see that it is increasing as long as the company taking the proper procedures. The Company Shred Knowledge is affected by the inflow which controlled by Tacit Knowledge and Explicit Knowledge. Another Factor is the outflow which is controlled by the Skills Turnover and Obsoleteness Rate of Knowledge for the industry of concern. From (Figure 4) we see that the company shared knowledge directly affects the profitability of the company. : Company Shared Knowledge : : : :
. . . .
: : : :
. . . .
: : : :
. . . .
: Inflow
.
: outflow
.
Graph
(Untitled )
: Profit
.
.
Years
.
:
AM
Mar
Figure 4: Company Shared Knowledge, Inflow, outflow and Profit
14
: Company Shared Knowledge : : : :
. . . .
: : : :
. . . .
: : : :
. . . .
: Inflow
.
.
Graph
• •
: outflow
(Untitled )
: Profit
.
Years
.
.
:
AM
Mar
Figure 5: Company Shared Knowledge, Inflow, outflow and Profit From Figure 5 we can see that, by increasing the Obsoleteness Rate the Company Shared Knowledge will decrease and also this will decrease the Profitability growth rate In spite of the increase in the Cost of Management as shown Figure 6 we can see that the Profitability of the company still going up. This is due to the fact that any increase in Cost of Management means more and more Knowledge which positively increases the company
15
competitiveness. : Company Shared Knowledge : : :
. . .
: : :
. . .
: : :
. . .
: Profit
.
: Cost of Management
.
Graph
.
.
.
Years
(Untitled )
:
AM
Mar
Figure 6: Company Shared Knowledge, Profit and Cost of Management : Company Shared Knowledge : : :
. . .
: : :
. . .
: : :
. . .
: Profit
.
.
Graph
•
(Untitled )
: Cost of Management
.
Years
.
.
:
AM
Mar
Figure 7: Company Shared Knowledge, Profit and Cost of Management Cost of Management and Profitability are correlated. Although the cost of Management is considered on the Expenses side. We can see in (Figure 7) that by decreasing cost of management the profitability goes down and vice versa.
16
•
Now we will examine the effect of Cost of Management on Knowledge Productivity Index which affects the company competitiveness. The figure below shows the initial situation before changing Cost of Management. : Company Shared Knowledge : : : :
. . . .
: : : :
. . . .
: : : :
. . . .
: Profit
.
.
Graph
•
: Cost of Management
(Untitled )
.
Years
: Knowledge Productivity Index
.
.
:
AM
Mar
Figure 8: Company Shared Knowledge, Profit, Cost of Management and KPI By decreasing the Cost of Management as shown Figure 9, we notice that Profitability instability became apparent and also we realize the fact The company Knowledge Productivity Index is an indicator for the company profitability
17
: Company Shared Knowledge : : : :
. . . .
: : : :
. . . .
: : : :
. . . .
: Profit
.
: Cost of Management
.
Graph
(Untitled )
.
Years
: Knowledge Productivity Index
.
.
:
AM
Mar
Figure 9: Company Shared Knowledge, Profit, Cost of Management and KPI •
Finally we can make use of the above results by measuring KPI and Cost of Management and monitor their values. Investing in Knowledge Management gives companies the necessary tools to monitor its performance and to enhance it.
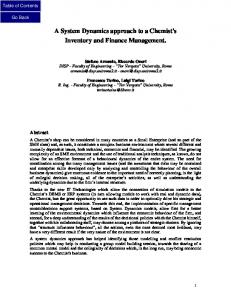
EXTENDING THE MODEL To extend the above model we need to: • Identify the industry and the company of interest • Identify the Desired Knowledge Productivity Index (KPI) for that industry which represents the average of KPT for the top companies in the intended industry. • Based on the behavior of the company in acquiring their knowledge we can simulate the current state and show the hidden dimensions to the company management that affect the company shared knowledge and hence the applicable knowledge which will affect the knowledge productivity index of the company • For each industry there are many factors that can affect the job satisfaction of employees that’s why the link from Company Shared Knowledge to Job Satisfaction and hence to Employees Turnover is industry specific.
18
Figure 10: Employee Turnover Rates - Total Separations by Industry (Oct/01 - Sep/02) (source: http://www.nobscot.com/survey/us_total_separations_0902.cfm)
From figure 10 we can see that the turnover rates are different which must obligates us to consider the industry of interest in our extension of the model. •
One of the critical points in this model is measuring the Cost of Capital. Strassmann (1999) said “The tricky problem is determining the appropriate cost of capital to be used in estimating the worth of knowledge value-added. This is where academics have spun elaborate theories, including the most popular approach taught to MBA students as the "capital asset pricing model”. We used shareholder’s cost of capital because it is easy to get from balance sheets. But in order to help companies calculate the Management value added it is required to study the company processes very well case by case, the KVA methodology (creation of Drs. Thomas J. Housel and Valery Kanevsky) can help in this process
CONCLUSION Knowledge Management (KM) is a very broad term - it is not just about technology, but includes all the human and organizational aspects of integrating knowledge. It is practiced by most companies, whether they know it or not, but often as accidental practice. Efficient integration of this Knowledge Management is the challenge for such companies. Today, Knowledge is the most important product in organizations. They hiring minds, and not hands, knowledge is the company assets. So, organizations are seeking to create systematic ways to identify and convert individual expertise, skills and experiences into organization knowledge. A company’s ability to use knowledge depends on how eager people are, about sharing it. Individual knowledge is power, but will be much powerful when its be shared. Leverage knowledge is possible only when people value building on each other’s ideas and sharing their own insights. Much of this is shaped by the culture of the organizations.
19
So, throughout the discussion in this paper, it has been pointed out that a company can leverage it knowledge by different lines of investment on external as well as internal experiences. The later one has been realized by hiring (if needed) new blood, which has certain level of experiences and intelligent. As for the internal experiences, the study has shown how company can build and develop it (1) through deploying the total quality management programs and initiative, (2) through investing in people through training and finally, (3) through injecting/building the culture of knowledge sharing. However, to convince the decision makers to take the actions towards the above mentioned lines and the associated 4 dimensions, the researchers have proposed the system dynamic methodology to show quantitatively, their impact on the productivity of the company through evaluating the cost of management and the management value added.
REFERENCES The CASSELL CONSICE DICTIONARY; Version 1.0; Copyright 1989 – 1997 Cassell Plc; Software copyright 1997 Gentian IT. Consultants ltd. Drucker, Peter (2000), “Knowledge-Worker Productivity: The Biggest Challenge”, in the Knowledge Management Year Book 2000-2001, edited by James W. Cortada and John A. Woods, Butterworth Heinemann. IEC WebForum Tutorials, “Knowledge Value Added Methodology”, at (http://www.iec.org) (Retrieved Date: Feb 2003). Hansen, M. T., Von Oetinger, B. (2001), “Introducing T-Shaped Managers: Knowledge Management's Next Generation”, Harvard Business Review. Hodson, R. and Sullivan, T. A. (1995), “The Social Organization of Work”, 2nd ed. Belmont, CA: Wadsworth Publishing Company. Liebowitz, Jay (1999), “Knowledge Management Handbook”, CRC Press. Koenig, U.H, Membrillo, A. (1998) “Impact of Individual Knowledge on the Increase of Sustainable Intellectual Capital of Organizations - A Systemic Approach”, System Dynamics Society 16th International Conference, Quebec, Canada. NobScot Corporation (2003), “Employee Turnover Rates - Total Separations by Industry (Oct/01Sep/02)”, (Retrieved Date: Feb 2003 at http://www.nobscot.com/survey/us_total_separations_0902.cfm Otto, Peter and Belardo, Salvatore (2002), “Design of Information Systems: Simulating the effectiveness of Knowledge transfer throughout the system analysis phase”, System Dynamics Society. Strassmann, Paul (1996), “The Value of Computers, Information and Knowledge”, at (http://www.strassmann.com/pubs/cik/cik-value.shtml Strassmann, Paul (1998), “The Value of Knowledge Capital”, in the American Programmer march 1998, at http://www.strassmann.com/pubs/valuekc/ 20
Strassmann, Paul (1999), “Calculating http://files.strassmann.com/pubs/km/1999-10.php
Knowledge
Capital”
at
21
Back to the Top