Journal of Sedimentary Environments Published by Universidade do Estado do Rio de Janeiro 1(4): 401-418, October-December, 2016 doi: 10.12957/jse.2016.26872
RESEARCH PAPER
CONTROLLING FACTORS ON THE ABUNDANCE, DIVERSITY AND SIZE OF LIVING BENTHIC FORAMINIFERA IN THE NE SECTOR OF GUANABARA BAY (BRAZIL) MARIA VIRGÍNIA ALVES MARTINS1,2*, LAZARO LUIZ MATTOS LAUT3, FABRIZIO FRONTALINI4, CRISTINA SEQUEIRA2, RENE RODRIGUES1, MARIA CLARA MACHADO DA FONSECA5, SERGIO BERGAMASHI1, EGBERTO PEREIRA1, FRANCIELLI PAULA DELAVY6, ALBERTO GARCIA FIGUEIREDO JR.7, PAULO MIRANDA2, DENISE TERROSO2, ASSANE LUÍS PENA8, VANESSA MATTOS LAUT9, RUBENS FIGUEIRA10, FERNANDO ROCHA2 1 Universidade do Estado do Rio de Janeiro, Faculdade de Geologia, Departamento de Estratigrafia e Paleontologia. Av. São Francisco Xavier, 524, sala 2020A, Maracanã. 20550-013 Rio de Janeiro, RJ, Brazil.
[email protected];
[email protected];
[email protected];
[email protected] 2 Universidade de Aveiro, GeoBioTec, Departamento de Geociências, Campus de Santiago, 3810-193 Aveiro, Portugal.
[email protected];
[email protected];
[email protected];
[email protected] 3 Universidade Federal do Estado do Rio de Janeiro - UNIRIO, Laboratório de Micropaleontologia - LabMicro, Av. Pasteur, 458, IBIO/CCET sala 500 Urca, 22.240-490, Rio de Janeiro, Brazil.
[email protected] 4 Università degli Studi di Urbino "Carlo Bo", Dipartimento di Scienze Pure e Applicate (DiSPeA) Urbino, Italy.
[email protected] 5 Undergraduate student, Laboratório de Micropaleontologia, Universidade do Estado do Rio de Janeiro (LMP-UERJ), Faculdade de Geologia, Departamento de Estratigrafia e Paleontologia. Av. São Francisco Xavier, 524, sala 4037F, Maracanã. 20550-013 Rio de Janeiro, RJ, Brazil.
[email protected] 6 Programa de Capacitação Institucional, Museu Paraense Emílio Goeldi, Coordenação de Botânica. Av. Perimetral, Terra Firme, CEP 66077-830, Belém, PA, Brazil.
[email protected] 7 Universidade Federal Fluminense, Departamento de Geologia, Lagemar. Av. Milton Tavares de Souza, s/n, CEP 24210-340, Niterói, RJ, Brazil.
[email protected] 8 Universidade Pedagógica - Moçambique, Departamento de Ciências Naturais e Matemática. Rua D. Francisco de Almeida 2º Bairro, Ponta-Gêa, 737/751 - Beira - Mozambique - Caixa-postal: 2025.
[email protected] 9 Programa de Pós-Graduação em Biologia Marinha e Ecossistemas Costeiros, Universidade Federal Fluminense – UFF. Outeiro São João Batista, s/nº - Niterói - RJ, Brazil. CEP 24001-970.
[email protected] 10 Departamento de Ocenografia Física, Instituto Ocenográfico, Universidade de São Paulo, Brazil.
[email protected] * C ORRESPONDING AUTHOR ,
[email protected] Received on 30 October 2016 Received in revised form on 1 December 2016 Accepted on 5 December 2016 Editor: Maria Antonieta da Conceição Rodrigues, Universidade do Estado do Rio de Janeiro, Brazil
Abstract The disposal of waste and sewage by anthropic activities in Guanabara Bay (GB), Rio de Janeiro State (Brazil) is negatively affected this coastal ecosystem over the last few decades. This research intends to document how organic
Citation:
Martins, M.V.A., Laut, L.L.M., Frontalini, F., Sequeira, C., Rodrigues, R., Fonseca, M.C.F., Bergamashi, S., Pereira, E., Delavy, F.P., Figueiredo Jr., A.G., Miranda, P., Terroso, D., Luís Pena, A.L., Laut, V.M., Figueira, R., Rocha, F., 2016. Controlling factors on the abundance, diversity and size of living benthic foraminifera in the NE sector of Guanabara Bay (Brazil). Journal of Sedimentary Environments, 1(4): 401418.
matter and metal enrichment affect the benthic organisms. Physicochemical, textural, geochemical and microfaunal data (foraminifera) are analyzed in nine stations in the NE sector of Guanabara Bay. The size and structure of the living
401
Journal of Sedimentary Environments Published by Universidade do Estado do Rio de Janeiro 1(4): 401-418, October-December, 2016 doi: 10.12957/jse.2016.26872
foraminiferal assemblages are analyzed on each sedimentary fractions (63-150 μm, 150-250 μm, 250-500 μm and >500 μm) of every station. In the fraction >500 μm no foraminifera were found. Results suggest that organic matter contents are high everywhere whereas metals concentrations increase in São Gonçalo region. The dimension, diversity and equitability of the living foraminiferal assemblages were reduced in the study area. Ammonia tepida was the dominant taxon in all samples. Living specimens identified in the 63150 μm sedimentary fraction were found at all stations except in front of São Gonçalo city (stations GB9 and GB8). Most of species were not found in the 250-500 μm sediment
RESEARCH PAPER
fraction in most sites except for instance Ammonia tepida. This species dominate in eutrophic areas but where organic matter is in an oxide stage and regardless of whether there is or not gas seep. Foraminiferal density and diversity increased in areas with a prevalence of organic matter from oceanic biological production and declined in areas where organic matter and metals are retained in disoxic/anoxic phases of the sediments. Keywords: Metals, organic matter, gas seep, dimension of living foraminifera, assemblages structure, Guanabara Bay
1. Introduction Guanabara Bay (GB) is located at latitude 22°40’ and 23°00’ S and longitude 43°00’ and 43°20’ W, in Rio de Janeiro State (Brazil). It has 131 km of perimeter and approximately occupies an area of ~384 km2 (Guimarães and Mello, 2006). It has maximum north-south length of ~28 km from the Copacabana tip to the Magé River mouth and an east-west length of ~30 km between the Meriti and Guapimirim Rivers (Kjerfve et al., 1997). Nowadays about 11 million people live around GB basin and negatively affect this ecosystem. In addition, GB is located in the second greater industrialization area of Brazil, which has also significantly contributed to its environmental degradation (Baptista Neto et al., 2006). Deforestation, rivers rectification, release of about 8 million of domestic untreated sewage, maritime terminals, ports, refineries and shipyards are among the human activities that mostly contribute to the environmental degradation of GB (Vilela et al., 2014). Because of this, GB was identified as one of the most polluted coastal environments in Brazilian coastline (e.g., Rebello et al., 1986; Vandenberg and Rebello, 1986; Leal and Wagener 1993; Barrocas and Wasserman, 1995; Perin et al., 1997; Baptista Neto et al. 2000, 2005, 2006; Faria and Sanchez, 2001; Covelli et al., 2012; Donnici et al., 2012; Cordeiro et al., 2015). The effects of pollution on organisms living in this environment are still poorly understood. Foraminifera have been widely recognized for their importance as bioindicators of environmental conditions (Alve, 1995; Armynot du Châtelet and Debenay, 2010; Frontalini and Coccioni, 2011; Schönfeld et al., 2012 for review) and have been therefore used in environmental impact studies (e.g. Frontalini et al., 2009; Martins et al. 2015; 2016 a, b; Laut et al., 2016; Yamashita et al., 2016).
Several studies aiming to assess the environmental conditions in GB based on benthic foraminifera have been performed (Vilela et al., 2004, 2007, 2011; Fontana et al., 2006; Kfouri-Cardoso et al., 2006; Donnici et al., 2012; Eichler et al., 2013; Clemente et al., 2015). Due to the low abundance of living benthic foraminifera in GB, these works were based on the dead plus living (total) assemblages. However, according to Schönfeld et al. (2012), the environmental status evaluation must be exclusively based on the living assemblages of foraminifera. Excluding the work of Delavy et al. (2016), this work is one of the first studies considering living foraminiferal assemblages in the bay and represents the first that considers the abundance and structure of the living benthic foraminiferal assemblages in selected sediment fractions.
1.1 The main goals of this work The main aim of this research is to analyze the influence of organic matter and metals enrichment in the structure of living benthic foraminiferal assemblages in the NE sector of GB.
2. Material and methods The structure of living benthic foraminiferal assemblages was analyzed in nine stations on 27 January 2016 in the NE of GB (Fig. 1; Table 1). At least three replicates of sediment were collected in each station by independent deployments of a box-corer. The first centimeter of sediments was removed and preserved for sedimentological and microfaunal analyses. Samples for microfaunal analyses were
402
Journal of Sedimentary Environments Published by Universidade do Estado do Rio de Janeiro 1(4): 401-418, October-December, 2016 doi: 10.12957/jse.2016.26872
RESEARCH PAPER
preserved with alcohol and Rose Bengal (2 g of Rose Bengal in 1000 ml alcohol) to differentiate living from dead specimens (Schönfeld et al., 2012). The methodology applied in the analyses of physicochemical parameters, grain size, δ13C in sedimentary organic matter, total organic carbon content (TOC), parameters of pyrolysis (Rock-Eval) and living foraminiferal data were described in Delavy et al. (2016). This work
reanalyzed some of data obtained by Delavy et al. (2016), namely: percentage of fine fraction, TOC, δ13C and the S2 index values, as well as the total living assemblage of foraminifera found in each station. The S2 is the amount of hydrocarbon released from cracking organic compounds (mg HC/g sediment) and heavy hydrocarbons. This parameter is obtained by pyrolysis (300–600°C) and is related to hydrocarbon source potential (Espitalié et al., 1977).
7490000
680000
Sample Locations
695000 Roncador R.
Surui R.
Magé
REDUC
Paqueta Island
3 6
Sapê R.
2
Duque de Caxias
Brazil
4
5
N
1
7475000
Governador Island
9
7 8
S. Gonçalo
Guanabara Bay
GB
Niterói
7460000
Rio de Janeiro
0
9 Km
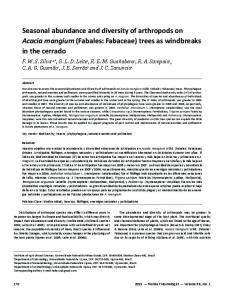
Fig.1. Samples locations in the NE sector of Guanabara Bay, Rio de Janeiro State (Brazil). Legend: S. Gonçalo – São Gonçalo; R. – River, Reduc – oil refinery.
2.1 Geochemical analyses and structure of living foraminifera New data analyzed in this work include: 1) total sulfur (TS) estimated in the Chemostratigraphy and Organic Geochemistry Laboratory of Universidade do Estado do Rio de Janeiro (LGQM-UERJ), with a LECO SC-632 equipment; 2) concentrations of Cr, Cu, Pb, Zn, Sr, Al2O3, Fe2O3, P2O5, CaO, MnO, MgO and SO3 analyzed by X-Ray Fluorescence (XRF) technique with a Panalytical equipment (Axios model) in the Laboratory of X-Ray Diffraction
Analysis of Universidade de Aveiro (Portugal) in the fine fraction; 3) living benthic foraminiferal assemblages in four selected sediment fractions; 63-150 μm, 150-250 μm, 250500 μm and >500 μm were analyzed in the Laboratory of Micropaleontology of Universidade do Estado do Rio de Janeiro (LMP-UERJ). In order to obtain a reliable characterization of the assemblage integrated in each granulometric fraction ideally, 300 living foraminiferal specimens were counted and identified in each size fraction (63-150 μm, 150-250 μm, 250-
403
Journal of Sedimentary Environments Published by Universidade do Estado do Rio de Janeiro 1(2): 184-201, April-June, 2016 doi: 10.12957/jse.2016.22534
RESEARCH PAPER
500 μm and >500 μm) of each sample composed by the sediment of three combined replicates.
Tab. 1. Geographic coordinates of studied stations in the NE area of Guanabara Bay. Samples were collected at about 2.5-5.5 m water depths. Station
Latitude
Longitude
GB1
22°47'42.33"S
43°05'6.29"W
GB2
22°46'16.62"S
43°04'32.85"W
GB3
22°44'56.03"S
43°04'0.82"W
GB4
22°42'57.70"S
43°04'31.16"W
GB5
22°43'07.02"S
43°06'6.54"W
GB6
22°45'48.52"S
43°06'22.53"W
GB7
22°48'48.27"S
43°05'38.48"W
GB8
22°49'05.2"S
43°04'57.5"W
GB9
22°48'33.00"S
43°04'27.80"W
The species identification followed the same methodology described in Delavy et al. (2016). Sediment fractions with a number of living organisms 100 specimens). Foraminiferal density (FD) was calculated as the number of living specimens in each sediment fraction per gram of bulk sediment. Despite foraminiferal species have different dimensions, considering that there were no foraminifera found in the >500 μm sediment fraction, we assume that specimens occurring in the sediment fraction 63-500 μm represent the living foraminiferal assemblage (LFA) in each station. In order to simplify the data discussion we refer the living specimens identified in the 63150 μm sedimentary fraction as foraminifera of the fine fraction (FFF); 150-250 μm sediment fraction as foraminifera of the medium fraction (FMF) and 250-500 μm sedimentary fraction as foraminifera of coarse faction (FCF).
relative abundance of living species found in each sediment fraction (with enough foraminifera as refereed above) were compared with selected abiotic data by Principal Components Analysis (PCA). Spearman correlations between the analyzed variables were also determined. Correlations are significant at p < 0.05. Statistical analyses were performed with the software Statistica v.12. Maps were performed with Arc Gis 9.2® using coordinates according to WGS84 (UTM 23) datum.
3. Results Water temperature was relatively high (mean 30.2°C) and salinity varied between 12.1 and 35.9 (mean 24.4) during the sampling event. The lowest values of salinity were recorded near the rivers mouths. The water column presented mean dissolved oxygen values of 7.0 mg/l and basic pH values from 7.7 to 8.5 (mean 8.3). The lowest pH values were recorded in station GB5 under the Suruí River outflow.
3.1 Sediments characteristics and metals concentrations The sediments are mainly composed of mud to muddy sand particles with mean grain size varying from 17-125 μm (mean 42 μm). In these sediments, the fine fractions ranged from 27% to 94.6% (mean 72.9%; Table 2). In all the stations, the sediments were poorly sorted and composed by trimodal to polymodal particles except in station GB3, which had unimodal sedimentary particles. The mean values of sediments characteristics and metals concentrations are reported in Table 2. The highest concentrations of metals such as Cr (Fig. 2A), Cu (Fig. 2B), Pb (Fig. 2C) and Zn (Fig. 2D) were mostly found near São Gonçalo city. A slight increase of Cu (Fig. 2B) and Pb (Fig. 2C) was also observed in Paquetá Island and of Pb in front of the Sapé River (Fig. 2C).
2.2 Statistical analysis
The lowest CaO content was observed in the inner area of the NE region of GB (Fig. 3A). The highest concentrations of P2O5 (Fig. 3B) were observed near the Suruí River and São Gonçalo city.
Biotic and abiotic data were logarithmically transformed log (X+1) before the statistical analysis. The most frequent foraminiferal species (with a relative abundance ≥3% and an occurrence in at least three stations), assemblages parameters (FD, H’ and J’) by station and the
The contents of Al2O3 (Fig. 3C) and Fe2O3 increased mostly in front of rivers mouths (Fig. 3D). The distribution pattern of MnO (Fig. 3E) and SO3 (Fig. 3F) contents presented opposite trends. The highest MnO values were recorded in the outer stations.
404
Journal of Sedimentary Environments Published by Universidade do Estado do Rio de Janeiro 1(2): 184-201, April-June, 2016 doi: 10.12957/jse.2016.22534
RESEARCH PAPER
3.2 Living foraminiferal assemblages According to data presented in Delavy et al. (2016), a total of 46 taxa were recognized in the studied area. The specific richness varied between 6 and 30 excluding station GB8 that was basically devoid of living foraminifera. The highest species values were found in the most external stations (GB7, GB6 and GB1). The highest values of H’ (0.25-1.75)
Magé
56.3 - 64.5
5
64.6 - 74.5
680000 Roncador R.
REDUC
74.6 - 86.2
Paqueta Island
Duque de Caxias
7490000
52.5 - 5.2
695000 Surui R.
(mgkg-1) kg-1) Cu (mg
25.8 - 29.9
4
3
6
2
Sapê R.
1
7475000
30.0 - 36.9
5
REDUC
50.2 - 63.3
Paqueta Island
S. Gonçalo
1
S. Gonçalo
N
7460000 Magé
5
REDUC
54.1 - 70.9
Paqueta Island
Duque de Caxias
6
7490000
Roncador R.
Surui R.
Zn Zn (%) (mg (mgkg-1) kg-1)
4
2
3 Sapê R.
9
7
8
S. Gonçalo
4
210-250 0.021 - 0.025
Paqueta Island
2
Sapê R.
9 8 7
S. Gonçalo
Guanabara Bay
Niterói
N
Rio de Janeiro 7460000
7460000
3
6
1
Governador Island
Niterói
9 Km
5
REDUC
Duque de Caxias
Guanabara Bay
N
Roncador R.
Magé
0.013 - 0.016 130-160
0.017 - 0.020 170-200
695000 Surui R.
100 0.010 - 0.012 -120
1
Governador Island
B.
680000
695000
45.3 - 50.8
7475000
9 Km
A.
44.3 - 45.2
50.9 - 54.0
0
Rio de Janeiro
7475000
7460000
9 Km
680000 7490000
Niterói
Rio de Janeiro
Pb (mg (mg kg-1) kg-1)
0
Guanabara Bay
N
Sapê R.
2
7
Niterói
6
9 8
Governador Island
Guanabara Bay
0
4
3
Duque de Caxias
7 9 8
Governador Island
Roncador R.
Magé
37.0 - 50.1
695000 Surui R.
7475000
7490000
680000 (mgkg-1) kg-1) Cr (mg
and J’ (0.14-0.57) were found in GB7, GB6 and GB9 stations. Ammonia tepida was the dominant species in all samples (Fig. 4). In station GB9, A. tepida co-dominated with Cribroelphidium excavatum and Ammotium salsum. The abundance of miliolids was low in all the stations during this sampling event and was frequently poorly preserved. The agglutinated species were mostly represented by A. salsum, Reophax nana, Haplophragmoides wilberti and Trochammina inflata.
C
0
Rio de Janeiro
9 Km
D
Fig. 2. Maps of distribution of concentrations: A. Cr (mg kg-1); B. Cu (mg kg-1); C. Pb (mg kg-1) and; D. Zn (mg kg-1). Legend: S. Gonçalo – São Gonçalo; R. – River; Reduc – oil refinery.
405
Journal of Sedimentary Environments Published by Universidade do Estado do Rio de Janeiro 1(2): 184-201, April-June, 2016 doi: 10.12957/jse.2016.22534
RESEARCH PAPER
Tab. 2 – Sedimentary data of the studied stations in the NE sector of Guanabara Bay. Maximum (max), minimum (Min) and mean values for each variable are indicated.
Variables/Stations
GB1
GB2
GB3
GB4
GB5
GB6
GB7
GB8
GB9
Max
Min
Mean
Fines
%
92.3
94.6
93.6
92.2
79.4
62.8
27.0
29.3
84.8
94.6
27.0
72.9
TOC
%
TS
%
4.21 1.60
4.44 1.80
4.68 1.60
4.22 1.80
5.80 2.10
1.98 1.00
2.54 1.10
1.50 0.75
4.23 1.40
5.8 2.10
1.5 0.75
3.7 1.46
2.63
2.47
2.93
2.34
2.76
1.98
2.31
2.00
3.02
3.02
1.98
2.49
-23.11 7.4
-24.56 6.4
-24.27 5.4
-21.60 10.5
-21.69 3.4
-21.73 4.2
-23.95 2.7
-24.34 8.4
-21.60 10.5
-24.56 2.7
-23.05 6.2
C/S δ13C
‰
S2
mg HC/g sediment
-22.24 7.7
Cr
mg kg-1
69.1
60.9
56.2
52.5
68.5
63.6
74.5
86.2
64.5
86.2
52.5
66.2
Cu
mg kg-1
43.5
26.2
29.9
25.8
36.9
50.1
35.2
63.3
47.3
63.3
25.8
39.8
Pb
mg kg-1
Zn
mg kg-1
49.9 170
44.3 140
52.1 100
45.2 130
50.8 160
64.5 150
54.0 160
70.9 250
47.6 190
70.9 250
44.3 100
53.3 161
Sr
mg kg-1
90
80
90
100
90
120
200
110
120
200
80
111
MgO
%
1.82
1.78
1.75
1.97
1.87
1.52
1.25
0.85
2.10
2.1
0.9
1.7
MnO
mg kg-1
920
890
570
530
720
760
880
460
490
920
460
691
Al2O3
%
14.8
13.9
16.5
20.6
16.4
11.0
12.8
9.1
20.3
20.6
9.1
15.0
CaO
%
0.72
0.50
0.44
0.44
0.43
2.21
0.89
0.40
0.94
2.21
0.40
0.78
Fe2O3
%
6.23
6.07
6.94
8.16
6.48
5.55
6.43
6.29
6.83
8.16
5.55
6.55
P2O5
%
0.16
0.14
0.17
0.24
0.26
0.13
0.14
0.11
0.27
0.27
0.11
0.18
SO3
%
2.97
3.10
3.31
3.27
3.92
2.23
2.23
2.27
3.55
3.92
2.23
2.98
406
Journal of Sedimentary Environments Published by Universidade do Estado do Rio de Janeiro 1(2): 184-201, April-June, 2016 doi: 10.12957/jse.2016.22534
RESEARCH PAPER
Roncador R.
Magé
0.51 - 0.72
0.73 - 0.94
7490000
0.40 - 0.50
680000
695000 Surui R.
0.95 - 2.21 Duque de Caxias
3
Paqueta Island
6
Sapê R.
3
Paqueta Island
8
9
S. Gonçalo
1
8
S. Gonçalo
Niterói
7460000
9 Km
695000
Magé
11.1 - 14.8
3 6 2 4
5
REDUC
16.6 - 20.6
7490000
9.1 - 11.0
Paqueta Island
Duque de Caxias
Governador Island
B
680000 Roncador R.
Surui R.
7475000
0
A
Al2O3 (%) Al2O3 (% )
14.9 - 16.5
Rio de Janeiro
Fe2O3 (%)) Fe2O3 (%
5.55 - 6.00
1 9 7 8
6.01 - 6.50
5
REDUC
S. Gonçalo
Paqueta Island
S. Gonçalo
Roncador R.
Magé
0.050 - 0.057 500-570
Paqueta Island
Duque de Caxias
6
2
Sapê R.
7475000
9
7
8
S. Gonçalo
2
3
3.56 - 3.92
Paqueta Island
6
Sapê R.
1 9 7
8
S. Gonçalo
Guanabara Bay
Niterói
N
Rio de Janeiro 7460000
7460000
4
5
REDUC
Niterói
9 Km
2.28 - 3.10
Governador Island
Guanabara Bay
0
Roncador R.
Magé
Duque de Caxias
1
Governador Island
695000 Surui R.
2.23 - 2.27
3.11 - 3.55
3
- 0.092
SO3 (%)) SO3 (%
4
5
REDUC
D
680000
Surui R.
460-490 0.046 - 0.049
9 Km
695000
7490000
MnO MnO (mg kg-1) kg-1) MnO (%) (mg
0
Rio de Janeiro
7475000
7460000
7460000
C
680000 7490000
N
Rio de Janeiro
N
Sapê R.
1 9 7 8
Niterói
9 Km
0.077 777-920
2
6
Guanabara Bay
N
580-760
4
Governador Island
Niterói
3
7.01 - 8.16 Duque de Caxias
Guanabara Bay
0.058 - 0.076
Roncador R.
Magé
6.51 - 7.00
Sapê R.
695000 Surui R.
7475000
7460000
9 Km
680000
7490000
N
Rio de Janeiro
0
9
Guanabara Bay
N
7
Niterói
Sapê R.
2
Governador Island
Guanabara Bay
0
6
Duque de Caxias
7
4
5
REDUC
0.25 - 0.27
1
7475000
0.16 - 0.20
2
Governador Island
Roncador R.
Magé
0.21 - 0.24
695000 Surui R.
0.11 - 0.15
4
5
REDUC
P2O5 P2O5 (%) (% )
7475000
7490000
680000 CaO (%)
E
0
Rio de Janeiro
9 Km
F
Fig. 3. Maps of distribution of concentrations: A. CaO (%); B. P2O5 (%); C. Al2O3 (%); D. Fe2O3 (%). E. MnO (%); F. SO3 (%). Legend: S. Gonçalo – São Gonçalo; R. – River; Reduc – oil refinery.
407
Journal of Sedimentary Environments Published by Universidade do Estado do Rio de Janeiro 1(2): 184-201, April-June, 2016 doi: 10.12957/jse.2016.22534
RESEARCH PAPER
GB4
GB5
GB3
GB6
680000
GB7
2
3
4
5
6
7
8
7490000
1
1
2
3
4
5
6
695000 7
1
8
2
3
4
Sample Locations
5
6
7
8
Roncador R.
Surui R.
Magé
1
N
2
3 GB2 4 5
6
7
8
4
5 REDUC Paqueta Island
3 6
Sapê R.
2
Duque de Caxias
1
7475000
Governador Island
9
7 8
S. Gonçalo
Guanabara Bay
1
2
4GB9 5
3
6
7
8
Niterói
1
2
3
1
2
3
4 5 GB1
6
7
8
6
7
8
7460000
Rio de Janeiro
1
2
3
4
5
6
7
8
0
9 Km
- A. tepida
- C. excavatum
- A. salsum
- B. striatula
- G. praegeri
- B. elegantissima
- R. nana
- E. gerthi 4
5
Fig. 4. Relative abundance of the main living benthic foraminiferal species from the NE sector of Guanabara Bay. Legend: S. Gonçalo – São Gonçalo; R. – River; Reduc – oil refinery.
3.3. Living foraminifera in sediment fractions The percentages of living benthic foraminifera on three sediment fractions (63-150 μm, 150-250 μm and 250-500 μm) and all the foraminiferal assemblages parameters (N, FD, S, H’ and J’) are presented in Appendix 1. The sediment fraction >500 μm was discarded due to the absence of living foraminifera. No living specimens were found in the 250-500 μm sediment fraction for most of the stations (Fig. 5A; Appendix 1) and only rare living specimens
were recorded in stations GB1, GB2 and GB5. The highest abundances of living organisms were found in the 63-150 μm and 150-250 μm sediment fractions. The abundance of living foraminifera was similar in both sediment fractions in stations GB1 and GB2 (Fig. 5A). The highest FD was found in the 63-150 μm sediment fraction followed by the 150-250 μm one in the GB4, GB5 and GB6 stations, an inverse pattern was documented in stations GB7 and GB9. The living assemblage comprehended only living organisms with dimensions varying between 150-250 μm in GB9 (Fig. 5A).
408
Journal of Sedimentary Environments Published by Universidade do Estado do Rio de Janeiro 1(2): 184-201, April-June, 2016 doi: 10.12957/jse.2016.22534
RESEARCH PAPER
96
386
239
252
33
10 5
1
5
5
12
30
45 1.1
93
151
1.2
118
146
3229
F o ra m in ife ra lDensity De n s ity (n . º / g ) Foraminiferal (n.º/g)
1.3
2.3
2.2
GB1
2.1
3.3
GB2
3.2
3.1
4.3
GB3
4.2
4.1
5.3
GB4
5.2
5.1
6.3
6.2
GB5
6.1
7.3
GB6
7.2
7.1
8.3
GB7
8.2
8.1
9.3
GB8
9.2
9.1
GB9
A
1.71
0.61 0.24
0.75
0.86
1.06
1.44
1.52
1.83
1.64 1.00
1.15
1.84
2.23
2.78
Shannon I nde x Shannon Index
1.3
1.2
1.1
2.3
GB1
2.2
2.1
GB2
3.3
3.2
3.1
GB3
4.3
4.2
4.1
GB4
5.3
5.2
5.1
6.3
GB5
6.2
6.1
7.3
GB6
7.2
7.1
8.3
GB7
8.2
8.1
9.3
GB8
9.2
9.1
GB9
B
0.57 0.39
0.51
0.38
0.45 0.15
0.23
0.27
1.2
0.32
0.27
1.3
0.24
0.28
0.44
0.50
0.73
Eqitability ( J' ) Equitability
GB1
1.1
2.3
2.2
GB2
2.1
3.3
3.2
GB3
3.1
4.3
4.2
GB4
4.1
5.3
5.2
GB5
5.1
6.3
6.2
GB6
6.1
7.3
7.2
GB7
7.1
8.3
8.2
GB8
8.1
9.3
9.2
GB9
9.1
C
Fig. 5. Bar graphs of the following variables in each sediment fraction of the studied samples (1-9) in the NE sector of Guanabara Bay. A. Foraminiferal density (logarithmic vertical scale); B. Shannon Index and; C. Equitability. Stations (1-9) and sediment fractions: 3. 250500 μm (1.3-9.3); 2. 150-250 μm (1.2-9.2); 1. 63-150 μm (1.1-9.1).
409
Journal of Sedimentary Environments Published by Universidade do Estado do Rio de Janeiro 1(2): 184-201, April-June, 2016 doi: 10.12957/jse.2016.22534
RESEARCH PAPER
The specific richness (S