Convergent evolution of coloration in experimental
Recommend Documents
Aug 12, 1999 - independently during evolution. Although .... Convergent evolution of cytokines scientific ... the case for those of 1â2 mm (Table 1). The.
Aug 9, 2010 - and alleged coprolites of the durophagous mosasaur Globidens [24]). Alternatively .... shark (Squalus), and the wolf eel Anarrhichthys. (A) The ...
Jul 6, 2017 - eukaryotes, prokaryotes, and by extrachromosomal genetic elements ... bacterial endosymbionts and plasmids have evolved to successfully ..... symbionts has been discussed to result from mutational bias and increased genetic drift, which
Jun 2, 2012 - of Health, University of the Philippines, Manila, Philippines, and ... Technology Development Institute, Department of Science and Technology, Bicutan, ... Supporting information is available online at http://www.g3journal.org/lookup/ .
Sep 14, 2012 - convergent evolution of modularity is closely associated with the number of (distinct) .... as is the case for the first explanation (Figure 1), is it.
pBT2-βgal derivative, insertion of the ermC cassette in SaPIbov5small. This work. pJP1757. pBT2-βgal derivative, ochre mutation in SaPIbov5 ORF8. This work.
Apr 12, 2011 - niels Bjerg Jensen, mika Zagrobelny, Karin Hjernø, carl erik olsen, Jens Houghton-Larsen, Jonas Borch,. Birger Lindberg møller & søren Bak.
32. Pándy-Szekeres G, et al. (2018) GPCRdb in 2018: Adding GPCR structure models and ligands. Nucleic Acids Res 46:D440âD446. 33. Castiglione GM, et al.
Apr 28, 2015 - mon ancestor, such as the wing and camera-type lens eye in vertebrates and invertebrates, are called cases of convergent evolution. Instances ...
Jun 2, 2012 - Regulators of calcineurin (RCN) are a novel family of calcineurin modifiers, and .... guidelines set forth in the UPH-DJGTMU research manual. The pro- .... in the presence or absence of FK506 (1 mg/ml) while cna1 (YC98) and.
by various authors to create strict definitions for terms that describe the ... duplication), differences steadily accum
Oct 21, 2014 - similarity between human and gorilla testis transcriptomes relative to ...... Figure 2: chimpanzee human go rilla macaque ma rmoset mouse rat.
Apr 17, 2009 - reason is that Sylon hippolytes, which belongs to the Ken- trogonida, is ...... 79. Swofford DL: PAUP*: Phylogenetic Analysis Using Parsimony.
Jessica J. Cunningham1, Joel S. Brown2, Thomas L. Vincent3,y and Robert A. Gatenby1,* ... adaptive strategies in the same tissue cause significant variations in .... Whereas, tumor cells with a high background muta- .... strategy trades off maximally
Apr 29, 2011 - ity results from convergent evolution driven by a shared pollinator. Parsimony-based .... case of the cpIGS; thus, we used the procedure detailed ...
Apr 29, 2014 - Kislev ME (1986) A barley store of the Bar-Kochba rebels (Roman Period). Isr J Bot. 35(3-4):183â196. ..... 0.079. Hordeum vulgare. Salat Cami.
foot of the shock and the nozzle exit imposes the length- scale (L '). ..... on the left end of stage 2, the onset of stage 3 involves a jump by a factor of about 5/3.
foot of the shock and the nozzle exit imposes the length- scale (L '). ... the throat and then a smooth divergence up to the exit ..... Stage (1) resonance on the right.
Nov 23, 2011 - Form of warning signals M. Stevens & G. D. Ruxton 419. Proc. R. Soc. ..... 21 Forsman, A. & Merilaita, S. 1999 Fearful symmetry: pat- tern size ...
butterflies mimic distasteful species. Grzimek's Animal Life Encyclopedia.
Batesian mimicry is disadvantageous to the model species because some
predators ...
Botany School, University of Melbourne, Parkville, Victoria 3052, Australia ... ±Present Address: Department of Biology, University of New Brunswick, Fredricton, ...
Nov 19, 2013 - the case for specific r-proteins. Rather, CoRR simply demands. Convergent Evolution in Plastid and Mitochondrial Genomes. GBE.
Feb 21, 2013 - Furthermore, in Ichthyophthirius multifiliis and Oxytricha trifallax we could detect only one CY- and one ER- type hsp70 homolog comprising all ...
Jan 4, 2018 - this net-like neural arrangement predates the CnidariaâBilateria split2,3 .... Figure 1 | CNS evolution and dorsoventral patterning. a, A nerve net.
Convergent evolution of coloration in experimental
Jul 4, 2018 - cause them to evolve along different trajectories (Blount, Borland, & ... coloration, convergent evolution, experimental introduction, guppy, RNA- ...
|
|
Received: 13 April 2018 Revised: 30 June 2018 Accepted: 4 July 2018 DOI: 10.1002/ece3.4418
ORIGINAL RESEARCH
Convergent evolution of coloration in experimental introductions of the guppy (Poecilia reticulata) Cynthia Dick1*
| Jasmine Hinh1* | Cheryl Y. Hayashi2† | David N. Reznick1†
1 Department of Evolution, Ecology and Organismal Biology, University of CaliforniaRiverside, Riverside, California 2
Abstract Despite the multitude of examples of evolution in action, relatively fewer studies
Division of Invertebrate Zoology and Sackler Institute for Comparative Genomics, American Museum of Natural History, New York, New York
have taken a replicated approach to understand the repeatability of evolution. Here,
Correspondence Cynthia Dick, Department of Evolution, Ecology and Organismal Biology, University of California-Riverside, Riverside, California. Email: [email protected]
(LP) environments. LP introductions were replicated across 2 years and in two differ-
Funding information National Science Foundation, Grant/Award Number: DEB-1258231
analysis. We find that coloration in the introduction sites diverged from the founding
we examine the convergent evolution of adaptive coloration in experimental introductions of guppies from a high-predation (HP) environment into four low-predation ent forest canopy cover types. We take a complementary approach by examining both phenotypes and genetics. For phenotypes, we categorize the whole color pattern on the tail fin of male guppies and analyze evolution using a correspondence Guanapo HP site. Sites group together based on canopy cover, indicating convergence in response to light environment. However, the axis that explains the most variation indicates a lack of convergence. Therefore, evolution may proceed along similar phenotypic trajectories, but still maintain unique variation within sites. For the genetics underlying the divergent phenotypes, we examine expression levels of color genes. We find no evidence for differential expression, indicating that the genetic basis for the color changes remains undetermined. KEYWORDS
(Endler, 1995). This is caused by a trade-off between natural and sexual selection: natural selection favors less colorful males, while sexual selection in the form of female choice favors more colorful males (Endler, 1983). Researchers have conducted several introductions in the Caroni
(b)
drainage system to examine color evolution. Kemp, Reznick, Grether, and Endler (2009) re-examined the original Aripo introduction by Endler (1980) as well as the El Cedro introduction to determine whether body color evolution was predictable. They found that body color did increase in both introductions, but along different routes. Orange/yellow, black, and iridescence increased in Aripo, but only
(c)
iridescence increased in El Cedro and orange and black actually declined. More recent introductions in 2008 and 2009 have been made from Guanapo HP into the LP Upper Lalaja, Lower Lalaja, Taylor, and Caigual Rivers. Gordon et al.’s work examined color evolution in two of those introductions. They found that black coloration decreased
(d)
in Upper and Lower Lalaja compared to Guanapo HP, while orange/ yellow coloration increased (Gordon et al., 2015). Common garden experiments indicated that black changes were most likely due to plasticity and orange/yellow changes were the result of genetic effects. Kemp, Batistic, and Reznick (in review) recently determined that Upper Lalaja, Lower Lalaja, Taylor, and Caigual males had sig-
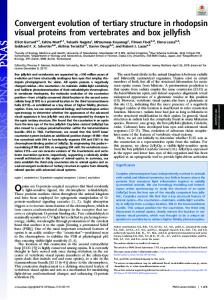
F I G U R E 1 Photographs of fish described as related and unrelated. Photographs (a-c) are males that were considered brothers based on nearly identical body and tail color elements. The male in Photograph (d) is considered unrelated to males (a-c) as the main black body spot was in a unique location. Brothers were filtered out such that only males (a) and (d) would have been included in the analysis. All males are from Taylor and have a black spot on the front margin of the tail
nificantly more iridescent body coloration than Guanapo HP males several years after introduction. These four 2008 and 2009 introductions along with Guanapo HP are the focus here. The goals of this study are twofold. First, we examine phenotypic convergence in tail coloration between the four experimental LP introductions in comparison with the HP ancestor from which they originated. We choose the tail as it is highly color polymorphic (Winge, 1927) and plays a key role in courtship displays (Farr, 1980),
Lenski, 2008; Gould, 2002). Plasticity could cause divergence among
despite rarely being the exclusive subject of color studies in guppies.
populations if differences are induced as a response to unique fea-
We hypothesize that the introduction sites will diverge from the HP
tures of the environment (Oke et al., 2016).
site based on canopy cover and year of introduction. Second, we
Trinidadian guppies provide the opportunity to evaluate whether
examine tail color gene expression differences between contempo-
populations in replicated introductions evolve convergently. Guppies
rary males from the four experimental introductions and the HP site.
from downstream communities co- occur with many predators,
We hypothesize that there would be an increased expression level
hence are referred to as high-predation (HP) communities. Guppies
of color genes in all the introduction sites compared to the HP site.
from headwater streams above barrier waterfalls live with few other species and experience reduced predation, hence are referred to as low-predation (LP) communities. HP guppies differ from LP guppies
2 | M E TH O DS
in a diversity of attributes, including life history, morphology, and behavior (Endler, 1995; Reznick & Bryga, 1996; Reznick & Endler, 1982). HP guppies have occasionally crossed barrier waterfalls to colonize
2.1 | Study system
LP sites (Willing et al., 2010), after which these guppies evolve and
In 2008, juvenile guppies were removed from Guanapo HP and
acquire LP phenotypes. HP guppies have been introduced into previ-
reared to maturity in the laboratory before being placed into mating
ously guppy-free LP environments multiple times to examine evolu-
groups. Mating groups consisted of a single tank with up to five males
tion in action. After the introduction, fish have evolved traits similar
and five females. Additional mating groups were placed in separate
tanks for a total of 38 fish of each sex. All fish were then introduced
1997; Reznick et al., 1990).
into previously guppy-free LP reaches of the Upper and Lower Lalaja
Guppy male ornamental coloration is thought to evolve under
tributaries. The canopy cover was regularly thinned in Upper Lalaja
convergent evolution between HP and LP populations. Although or-
to mimic that experienced by HP guppies, but left intact in Lower
namental coloration is a complex multicomponent trait, LP males are
Lalaja. Males from a cross were introduced into a separate site from
known to have greater spot size, area, and number than HP males
the females they mated with in the laboratory. This ensured that
|
9001
DICK et al.
starting genetic diversity was similar because all males were repre-
ventral. The distal end was not included as a partition because any
sented in both sites, either as stored sperm in introduced females or
distal coloration, if present, was an extension of color from another
by being themselves introduced. In 2009, a similar experiment was
section. Sections were scored for the presence of three color pat-
performed in the Taylor (thinned canopy; 52 males and 52 females)
terns: flags, swords, and highlights (Figure 2). Flags consist of black
and Caigual (intact canopy; 64 males and 64 females) tributaries.
spots on a field of orange/yellow. Swords are very thin stripes of
All introduced fish were individually marked and photographed. A
black or black plus orange/yellow on the dorsal and/or ventral mar-
monthly mark–recapture census was initiated immediately after in-
gins. Highlights are thick stripes of orange/yellow color bounded by
troduction. Virtually all guppies at a site were collected and photo-
black on at least two sides. If the color was present and did not con-
graphed plus new recruits were individually marked, measured, and
form to one of the three patterns (e.g., a single spot), it was scored
photographed, and then, all fish were released at the site of capture.
as having black only, orange/yellow only, or black plus orange/yellow
After a male reached maturity (at least 14 mm in length), a photo-
(Figure 2). The same researcher performed two independent cate-
graph was taken in which the medial fins were spread open.
gorizations for each male photograph on different days to ensure consistency. Any photographs with color score disagreements were
2.2 | Phenotypic analysis of color convergence
checked a third time to correct any data entry mistakes. To test for color pattern convergence, a correspondence analysis
Photographs were taken of wild-caught adult males from the an-
was performed using R package FactoMineR (Le, Josse, & Husson,
cestral HP site located in the Guanapo River (n = 28 photographs)
2008) on a count table of the number of individuals having 35
in May 2008 and from the four introduced, experimental sites of
unique pattern types for each of the five sites. The first three axes
guppies four years after introduction (Upper Lalaja: n = 25, Lower
accounted for 84.6% of the variation and were chosen for further
Lalaja: n = 28, Taylor: n = 24, and Caigual: n = 24 photographs). All
analyses. R package factoextra was used to construct symmetric bi-
photographs analyzed have been uploaded to FigShare (https://doi.
plots plotting all five sites from the correspondence analysis.
org/10.6084/m9.figshare.6130352). Potential brothers, identified based on having near identical body and tail coloration, were first filtered out such that males with identical tail color patterns within sites would not be full siblings (Figure 1). Males were visually placed into categories according to whether the tail coloration was minimal
2.3 | Genetic analysis of color convergence 2.3.1 | Genetic sampling and RNA extractions
(25% colored). The tail was partitioned
Twenty guppies were collected from Guanapo HP and the four in-
into three sections: proximal near the caudal peduncle, dorsal, and
troduction sites in 2013. Fish were bred in the laboratory at the
F I G U R E 2 Example photographs of the color pattern categories that were scored. Note the orange/yellow fish photograph also has upper and lower swords, as that color element was never present by itself. Pattern elements could be found individually or in combination with additional elements
|
DICK et al.
9002
Site
Replicate
Raw reads
Cleaned reads
Mapped reads (%)
Guanapo HP
1
26,870,174
22,586,691
20,766,878 (92.0)
Guanapo HP
2
39,086,645
32,622,487
30,141,929 (92.4)
Upper Lalaja
1
21,814,280
18,212,053
16,555,056 (90.9)
Upper Lalaja
2
18,881,969
15,857,847
14,703,350 (92.7)
Lower Lalaja
1
31,063,239
26,112,166
24,316,619 (93.1)
Lower Lalaja
2
23,971,652
20,331,650
18,682,796 (91.9)
Taylor
1
32,035,905
25,681,736
23,205,491 (90.4)
Taylor
2
25,701,105
20,676,206
18,621,562 (90.1)
Caigual
1
24,075,451
19,278,165
17,624,322 (91.4)
Caigual
2
40,809,576
32,639,238
29,653,795 (90.9)
University of California, Riverside (UCR), for two generations and maintained in a stock tank. The UCR Institutional Animal Care and Use Committee (IACUC) approved all procedures involving the fish.
TA B L E 1 Number of RNA sequencing reads obtained for each sample. Cleaned reads represent the number remaining after quality control. Reads were then mapped to the annotated guppy genome
2.3.3 | Read alignment, read counting and differential expression
Male tails were sampled at a stage in the development of the anal
Reads passing all quality control filters were aligned in TopHat2 to
fin when color was just beginning to develop. Fish were anesthe-
the reference guppy genome (NCBI accession GCF_000633615.1)
tized in MS-222, and 10 tails largely represented by unrelated males
using default options, except the number of threads was four and
were combined into a single sample per site. Some of the stock males
the minimum intron size was 50 bps. Read counts for each gene
within a sample may have been brothers based on color pattern sim-
were obtained using htseq- count in union mode (Anders et al.
ilarity, but no more than two brothers were allowed per family in
2015). Differential expression (DE) analyses were performed using
a sample. This was repeated for another biological replicate taken
DESeq2 (Anders and Huber 2010). A gene was only analyzed if it
from the stock tanks and at all five sites/stock tanks for a total of
had at least one count per million mapped reads for at least two sam-
10 samples. Fish were then immediately sacrificed in a lethal dose
ples. Contrasts were generated between Guanapo HP, and each of
of MS-222 and were not allowed to awake from anesthesia in be-
the four introduction sites and differential expression tests utilized
tween. Samples were flash-frozen in liquid nitrogen and stored at
a false discovery rate cutoff of 0.05. Genes known to be involved in
−80°C until RNA extraction. RNA was extracted by homogenizing
coloration (Supporting Information Table S1) were extracted from
caudal fins in TRIzol (Invitrogen, Carlsbad, CA), purifying with a
the list of differentially expressed genes.
Qiagen RNeasy Mini Kit (Valencia, CA), and treating with TURBO DNase (Ambion, Carlsbad, CA). RNA quality was gauged with an Agilent Bioanalyzer (Santa Clara, CA). All samples had RNA integrity values ≥8.1.
2.3.2 | Illumina sequencing and quality control
3 | R E S U LT S 3.1 | Phenotypic analysis of color convergence The variation in tail color patterns among the four LP introduction sites compared to Guanapo HP was due to a mixture of nonsimilar
The University of California, San Diego Institute for Genomic
and similar trajectories (Figure 3). The first dimension, accounting
Medicine, constructed libraries using the Illumina TruSeq Kit v2 (San
for over 36% of the variation, separated both the 2009 introduc-
Diego, CA), following the manufacturer’s recommendations and
tions (Taylor and Caigual) from all other sites (Figure 3a). The second
with each sample receiving a unique barcode. Samples were pooled
dimension separated Guanapo HP from all of the introduction sites,
into equimolar amounts and sequenced on two lanes of an Illumina
with no trend to the separation within introductions (Figure 3a,b).
HiSeq2500 at UCR (1 × 100 bps). The reads were cleaned using the
The third dimension separated introduction sites according to
fastq_quality_filter tool of the FASTX- Toolkit (Hannon Lab, Cold
whether their canopies were thinned (Upper Lalaja and Taylor) or
Spring Harbor Laboratory, NY). Reads needed to have a Phred +33
intact (Lower Lalaja and Caigual) (Figure 3b).
quality score of at least 20 in 100% of bases to pass quality controls. Any retained reads then had residual adapter sequences trimmed using Trimmomatic 0.20 (Bolger, Lohse, & Usadel, 2014). Each sam-
3.2 | Genetic analysis of color convergence
ple yielded 18.8–40.8 million reads (Table 1). Raw sequence reads
There are 26,071 genes in the guppy genome and 19,897 met the
have been deposited in NCBI’s Sequence Read Archive (Accession:
cutoff imposed for DE estimates of at least one count per million
SRP114275). After cleaning, there were 15.9–32.6 million reads per
(CPM) in at least two samples. Of the 106 genes with at least one
sample (Table 1).
function in coloration located in the guppy genome, 100 met the
|
9003
DICK et al.
F I G U R E 3 Correspondence analysis plots of principal coordinates for Guanapo HP (GH) and each of the four LP introduction sites (Upper Lalaja: UL, Lower Lalaja: LL, Taylor: TA, and Caigual: CA). (a) Dimension 1 plotted against Dimension 2. (b) Dimension 2 plotted against Dimension 3. UL and LL were founded in 2008, while CA and TA were founded in 2009. UL and TA have thinned canopies, while LL and CA have intact canopies. Acute angles between any of the sites indicate greater similarity cutoff for DE tests. There were very few DE genes (range: 77–207) between Guanapo HP and any of the individual introduction sites
4.1 | Phenotypic analysis of color convergence
across the transcriptome. None of the DE genes had known func-
Trait evolution after movement to a new environment can occur via
tions in coloration.
selection or founder effects/drift, among other factors. Although guppy introductions were initiated with