TOXICOLOGICAL SCIENCES 69, 306 –316 (2002) Copyright © 2002 by the Society of Toxicology
Coordination of Altered DNA Repair and Damage Pathways in Arsenite-Exposed Keratinocytes Hisham K. Hamadeh,* ,1,2 Kevin J. Trouba,* ,† ,1 Rupesh P. Amin,* Cynthia A. Afshari,* ,‡ ,3 and Dori Germolec† *Intramural Microarray Center, †Laboratory of Molecular Toxicology, and ‡Laboratory of Molecular Carcinogenesis, National Institute of Environmental Health Sciences, NIH, Research Triangle Park, North Carolina 27709 Received April 11, 2002; accepted June 3, 2002
Human exposure to arsenic, a ubiquitous and toxic environmental pollutant, is associated with an increased incidence of skin cancer. However, the mechanism(s) associated with AsIII-mediated toxicity and carcinogenesis at low levels of exposure remains elusive. Aberrations in cell proliferation, oxidative damage, and DNA-repair fidelity have been implicated in sodium arsenite (AsIII)-mediated carcinogenicity and toxicity, but these events have been examined in isolation in the majority of biological models of arsenic exposure. We hypothesized that the simultaneous interaction of these effects may be important in arsenicmediated neoplasia in the skin. To evaluate this, normal human epidermal keratinocytes (NHEK) were exposed to nontoxic doses (0.005–5 M) of AsIII and monitored for several physiological endpoints at the times when cells were harvested for gene expression measurements (1–24 h). Two-fluor cDNA microarray analyses indicated that AsIII treatment decreased the expression of genes associated with DNA repair (e.g., p53 and Damage-specific DNA-binding protein 2) and increased the expression of genes indicative of the cellular response to oxidative stress (e.g., Superoxide dismutase 1, NAD(P)H quinone oxidoreductase, and Serine/ threonine kinase 25). AsIII also modulated the expression of certain transcripts associated with increased cell proliferation (e.g., Cyclin G1, Protein kinase C delta), oncogenes, and genes associated with cellular transformation (e.g., Gro-1 and V-yes). These observations correlated with measurements of cell proliferation and mitotic measurements as AsIII treatment resulted in a dosedependent increase in cellular mitoses at 24 h and an increase in cell proliferation at 48 h of exposure. Data in this manuscript demonstrates that AsIII exposure simultaneously modulates DNA repair, cell proliferation, and redox-related gene expression in nontransformed, normal NHEK. It is anticipated that data in this report will serve as a foundation for furthering our knowledge of AsIII-regulated gene expression in skin and other tissues and contribute to a better understanding of arsenic toxicity and carcinogenesis. Key Words: arsenic; keratinocytes; microarray; toxicity.
1
Authors contributed equally to the work. Present address: Amgen, Inc., One Amgen Center Drive, Thousand Oaks, CA 91320-1799. 3 To whom correspondence should be addressed at Amgen, Inc., One Amgen Center Drive, Mailstop 5-1-A, Thousand Oaks, CA 91320-1799. E-mail:
[email protected]. 2
Arsenic is a metalloid that has been associated with increased cancer incidence in humans (Mazumder et al., 1998). Epidemiological studies associate human exposure to arsenic in the drinking water with skin cancer and to a lesser extent, internal cancers, as well as noncarcinogenic effects such as vascular disorders, peripheral neuropathy, and diabetes (ATSDR, 2000). Although multiple hypotheses have been proposed to explain arsenic carcinogenesis, the exact mechanism(s) remain elusive (Kitchin, 2001). Numerous carcinogenic mechanisms attributed to arsenic have been derived from studies that have evaluated cancer-related gene and protein expression in arsenic-induced tumors. A limitation of this approach is that tumor tissue represents an advanced stage of disease and may not be reflective of early events, induced by arsenic, that lead to cancer. Potential carcinogenic modes of action for arsenic include genotoxic damage such as chromosomal abnormalities (Gonsebatt et al., 1997) and oxidative stress (Matsui et al., 1999). Other theories support epigenetic events such as increased cell proliferation (Brown and Kitchin, 1996) and alterations in DNA repair (Vogt and Rossman, 2001). Research has yet to resolve whether these modes of action occur independently or concomitantly in a physiologically relevant in vitro model system. Keratinocytes are a primary target of arsenic in vivo (Kichin, 2001) indicating that this cell type is an important in vitro model in which to study this metalloid (Germolec et al., 1996; Hamadeh et al., 1999). The intracellular effects of sodium arsenite (AsIII) may overwhelm keratinocyte detoxification mechanisms, resulting in biochemical and molecular dysfunction and altered gene expression that leads to deregulated proliferation/differentiation, skin cancer, and other cutaneous abnormalities. Although a number of arsenic-regulated genes and processes have been described (Rossman et al., 2001), many of the molecular events that occur following exposure to inorganic AsIII remain unknown. In addition, many studies examining the effects of arsenic are limited or may lack physiological relevance because they have been performed using high concentrations of AsIII. Many studies also have used established epithelial cell lines, nontarget cell types, or nonuniversally accepted animal models. Animals appear to be more resistant
306
EFFECT OF INORGANIC ARSENIC ON KERATINOCYTE GENE EXPRESSION
to the effects of arsenicals than humans, as evidenced by numerous studies exploring the effects of arsenicals in animals, including rodent (Kroes et al., 1974), monkey (Thorgeirsson et al., 1994), and dog (Byron et al., 1967). The lack of a universally accepted animal model for inorganic arsenic carcinogenesis necessitates the use of representative normal human tissue such as normal human epidermal keratinocytes (NHEK) to investigate mechanism(s) of arsenic action. Normal human keratinocytes represent a primary in vivo target of arsenic, and thus provide a relevant and reasonable in vitro model in which to study the effects of arsenic on skin. To better understand the gene expression response in NHEK, following AsIII exposure, we generated the transcriptional profile of NHEK following short-term, nontoxic AsIII exposure at multiple dose and time points. Two-fluor cDNA microarray analysis provided new insight into the genes and biological processes involved in the arsenic response in skin, and demonstrated the complexity of the AsIII transcriptional profile in NHEK. The importance of this study is two-fold. First, it demonstrates effects on global gene expression induced by AsIII that may contribute to carcinogenicity and/or toxicity. Secondly, the study was conducted using nontransformed, target-relevant, primary normal human keratinocytes. It is anticipated that this data will contribute to a more complete understanding of the toxic and carcinogenic mechanism(s) of action of AsIII in skin.
MATERIALS AND METHODS Cell culture. Normal, nontransformed, human epidermal keratinocytes (NHEK) are a representative cell type that constitutes an appreciable percentage of the major target organ (skin) for arsenic carcinogenesis in humans. The lack of viral or oncogenic immortalization allows these cells to exhibit cellular functions comparable with those in their natural environment, indicating that they are a suitable model for assessment of arsenic’s effects on gene expression in human skin. Cryopreserved NHEK (lot #9F0638) were obtained from Clonetics Corp. (San Diego, CA), and were grown under low calcium (150 M) at 37°C, 5% CO 2 in keratinocyte basal medium supplemented with 5 g/ml insulin, 0.1 ng/ml recombinant epidermal growth factor, 0.4% bovine pituitary extract, 0.5 g/ml hydrocortisone, 50 g/ml gentamicin, transferrin, and epinephrine (KBM⫹). NHEK, at passage 3, were subcultured at a seeding density of 2000 cells/cm 2 in KBM⫹. Upon reaching 50 –70% confluence, the medium was replaced with KBM without hydrocortisone and bovine pituitary extract (KBM–). For gene expression experiments, the cells were allowed to acclimate for 1 h in KBM–, at which time they were treated with 0.005, 0.5, or 5 M AsIII (Sigma Chemical Co., St. Louis, MO) for 1, 8, or 24 h (time-matched controls ⫽ 0 M). The doses of 0.005 and 5 M were chosen to represent very low and relatively high nonlethal exposure, and the 0.5 M dose was chosen as a mid dose (see cytotoxicity determination, next section). A sample collection at 1 h was included to reveal potential early geneexpression alterations that signify relevant signaling processes in response to AsIII exposure. Exposures were also conducted at 0.005 and 2.5 M AsIII for 4 h. AsIII-treated cells and their respective time-matched, vehicle-treated controls were trypsinized and trypsin neutralized with soybean trypsin inhibitor/bovine serum albumin, pelleted and washed 3 times with Hanks balanced salt solution. Cell pellets were flash frozen on dry ice and stored at – 80°C prior to RNA isolation. Keratinocyte viability, determined using trypan blue staining, was determined to be ⬎80% during routine propagation.
307
Cytotoxicity determination. Neutral red dye, which is retained by viable cells, was used to investigate the viability status of NHEK as a result of AsIII treatment. NHEK were seeded into 96-well plates (2500 cells/well) and grown to approximately 60% confluence, at which time the media was replaced with (KBM–) supplemented with AsIII (Sigma). Viability was assessed 24 h later by incubation in the presence of neutral red dye (50 g/ml) for 3 h at 37°C. Media containing dye was removed and the cells were fixed in formaldehyde/ CaCl 2. Dye taken up by viable cells was extracted with ethanol/acetic acid prior to absorbency determination at 570 nm, using a microplate reader (Dynex Technologies, Inc., Chantilly, VA). Determination of cytotoxicity at the 24-h time point was done to define the toxicity status of the cells at the maximum treatment time. The 24-h point was selected because, at the density seeded, cells reached confluence by 48 or 72 h. To avoid confounding effects on gene expression that are associated with contact inhibition, NHEK were treated with AsIII at 50 –70% confluency. Measurements were made in triplicate wells and averaged for each concentration of AsIII. Chip manufacturing and microarray analysis. Sequence-verified human cDNA clones (Research Genetics, Huntsville, AL), termed the NIEHS human ToxChip, containing 1906 genes selected to represent major biochemical and toxicological processes, were used for this study. For a comprehensive list of all the clones on this chip, see dir.niehs.nih.gov/microarray/chips.htm and Nuwaysir et al., 1999. Methods for chip manufacturing were adapted from Duggan et al. (1999) and are also available at dir.niehs.nih.gov/microarray/ methods.htm. Efforts to re-sequence clones as part of the validation process are an ongoing activity in the NIEHS microarray center. Updated gene annotations are made to the website listed above. Total RNA corresponding to a pool of 6 biological replicate experiments was isolated using QIAGEN RNeasy kits (Qiagen, Valencia, CA). cDNA targets were prepared from 37.5–75 mg of total RNA by oligo dT-primed polymerization using SuperScript II reverse transcriptase (Life Technologies, Gaithersburg, MD). Reverse transcription and labeling with the fluorescent dyes Cy3 or Cy5 (Amersham Pharmacia, Piscataway, NJ) was performed according to protocols available at dir.niehs. nih.gov/microarray/methods.htm. Fluorescent intensities of the printed DNA targets were measured using the Axon 4000 scanner (Axon, Foster City, CA) and Array Suite (Scanalytics, Fairfax, VA) software was used to perform data acquisition and image analysis. Images corresponding to Cy3 and Cy5 fluorescent dyes were analyzed as previously described in Chen et al. (1997), using the ArraySuite v2.0 extensions of the IPLab image-processing software package (Scanalytics). This program allows location of targets on the array, measures local background for each target, and subtracts it from the target intensity value, and it identifies differentially expressed genes using a probability-based method. Intensity values corresponding to each gene on the cDNA microarray chips from the Cy3 and Cy5 channels were represented as a ratio of AsIII-exposed to time matched-control cells. For each individual chip, genes altered in a statistically significant manner at the 95% confidence level were determined (Chen et al., 1997). Replicate intensity values for each gene were documented from four independent hybridizations for each time and dose. A dye reversal procedure was employed, where two intensity values for a given gene on the chip were generated from instances where a sample was tagged with Cy3, and two more values from when the same sample was tagged with Cy5 to ensure minimization of error due to fluor-associated bias. Genes that indicated fluor bias or high variation were not considered for further analysis. Genes, significantly detected in three or four out of four arrays, were identified based upon a binomial distribution using MicroArray Project System (MAPS) (p ⱕ 0.00048) (Bushel et al., 2001). GeneSpring software (Silicon Genetics, Redwood City, CA) was used to perform the self-organizing maps (SOM) procedure on a set of genes constituting the union of all genes altered in a statistically significant manner from every dose and time point. Thymidine incorporation assay. Keratinocytes were seeded into 24-well tissue culture plates (4000 cells/well) in KBM⫹ and grown to ⬃50 – 60% confluence. Media were switched to fresh (KBM–) for AsIII treatment (triplicate wells for each concentration of AsIII). Forty-six-h after addition of AsIII, cells were labeled for 2 h with 2 Ci/ml [ 3H]thymidine (Amersham Pharma-
308
HAMADEH ET AL.
cia) and washed several times with ice-cold Hanks balanced salt solution. Several washes were performed with 10% trichloroacetic acid (Mallinckrodt, Phillipsburg, NJ) and radioactivity was eluted using 0.3 N NaOH. Thymidine incorporation into DNA was determined by scintillation counting. All measurements were performed in triplicate and repeated at least twice. Quantification of mitotic index. Keratinocytes were treated as previously described. Following a 6-, 8-, or 24-h incubation with different concentrations of AsIII, keratinocytes were fixed on 12-well plates by the gentle addition of cold methanol. After 10 min, methanol was removed and the plates were air-dried and stored at 4°C until staining with 0.1 g/ml 4⬘,6-diamidino-2phenylindole (DAPI). DAPI-stained cells were examined by fluorescence microscopy. The percentage of mitotic cells (the mitotic index) was determined from counts of a minimum of 2000 cells relative to controls. All measurements were performed in replicates of 6 and repeated at least two times. Northern blots. Total RNA was isolated from NHEKs treated with 0.005, 0.5, 5 M AsIII for 24 h as previously described, using the RNeasy midi-prep system. An additional sample of RNA was derived from NHEK pretreated for 2 h with 5 mM N-acetylcysteine (NAC) (Sigma, St. Louis, MO) and exposed to 5 M AsIII. Twenty-g aliquots of total RNA from these samples were fractionated by formaldehyde/agarose gel electrophoresis. Following transfer to nylon membranes, membrane-bound RNA was hybridized to 32P-labeled probes for human Protein kinase C delta, Fibroblast growth-factor receptor 4, MSH-5, cdc25b, p53, serine/threonine kinase 25,or NAD(P)H quinone oxidoreductase, all prepared using random-primers methodology (Invitrogen, Carlsbad, CA). 32P-labeled probes were derived from the same cDNA template as that spotted on the glass cDNA microarray. Individual membranes were exposed to phosphorimaging screens, and band intensity was quantified using the NIH Image software package for the purpose of graphing and comparing to microarray data.
RESULTS
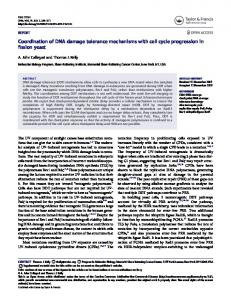
Arsenic Cytotoxicity and Proliferative Effects Different cell types and cell lines have varying sensitivity to the toxic effects of AsIII, and therefore the sensitivity of the NHEK strain used in this study was determined. Logarithmically growing cells were treated with AsIII (0.001–100 M) for 24 h. AsIII-induced cytotoxicity was quantified using the neutral red-viability assay that monitors the active transport of a dye into the lysosomes of viable cells. As demonstrated in Figure 1A, 24-h AsIII treatment did not cause a significant decrease in NHEK viability at concentrations of AsIII less than 10 M. Interestingly, the relatively low doses of AsIII significantly increased viability (an indirect measure of cell proliferation) of NHEK. Cytotoxicity, measured at 48 h of AsIII exposure, indicated that concentrations less than 5 M produced a negligible effect on cell viability (data not shown). Multiple studies indicate that AsIII influences cell proliferation and cell-cycle function. [ 3H]thymidine incorporation was used as an indirect measure to examine the effect of AsIII on NHEK proliferation. To maximize detectable changes in cell proliferation, [ 3H]thymidine incorporation was quantified at 48 h post-AsIII treatment. Incorporation of [ 3H]thymidine was markedly increased, relative to control levels, at all concentrations of AsIII (Fig. 1B) except at 0.1 M, consistent with the effects of AsIII on cell proliferation in other cell types (Trouba et al., 1999). To further confirm the effect of AsIII on proliferation, mi-
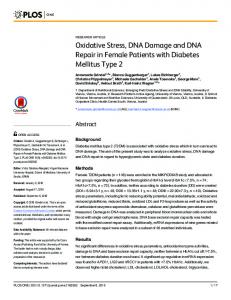
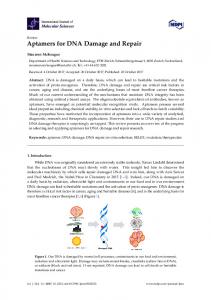
totic indices were determined in NHEK following AsIII exposure. The number of cells undergoing mitosis, measured by DAPI staining, was increased compared to control (0 M), following exposure to 0.005 and 0.5 M AsIII. A decrease in the mitotic index at 5 M AsIII at 6 and 8 h of exposure (Fig. 1C) (also at 2 and 4 h, data not shown) suggested a G 2/M arrest. However, 24 h after exposure to 5 M AsIII, cells undergoing mitosis were present in appreciably higher numbers relative to time-matched controls. Taken together, the NHEK viability and proliferation data suggest that there were no apparent confounding effects on cellular growth status (e.g., apoptosis, contact inhibition) that would complicate gene expression analysis and interpretation at the AsIII doses and time points tested. Arsenic-Mediated Gene Expression Changes NHEK exposed to AsIII (0.005–5 M) were collected for gene expression array measurements. Self-organizing maps (SOM), representing gene clusters that responded in time- and dose-dependent manner, were used to explore patterns of AsIII-modulated gene expression. A dose-time-response curve, generated from reproducibly changed gene expression indicated that there was an increase in detectable gene expression changes as the time and dose of AsIII exposure increased (Fig. 2). Specific gene expression changes (Table 1) indicated a majority of changes might be annotated to functional categories related to proliferation, DNA repair, and oxidative stress. A biological response to oxidative stress (Fig. 3A) following AsIII exposure was evident in the dose- and time-dependent upregulation of metallothionein I, which is a sulfhydryl-rich, metal-binding protein that provides protection against metal toxicity (Kreppel et al., 1993). In addition, increases in superoxide dismutase 1 (SOD1) and NAD(P)H quinone oxidoreductase gene expression (Table 1, Fig. 3A), which are protective from reactive oxygen species (Bayol-Denizot et al., 2000), further indicated a cellular response to AsIII-induced oxidative stress. Transcripts representing genes such as thioredoxin, thioredoxin reductase, glutathione S transferase, glutaredoxin, which are modulated in response to increased levels of reactive oxygen species (Prieto-Alamo et al., 2000), were also increased. The gene expression changes listed above were not present at 1-h AsIII exposures (at any dose); however, induction was observed as early as 4 h with doses ⱖ2.5 M for several of these genes. Gene expression alterations consistent with DNA repair/ replication disturbances constituted a common response to arsenic exposure (Fig. 3B). In the present study, a time- and dose-dependent downregulation was observed for several genes including the tumor suppressor gene p53, cdc25b, essential for initiation of mitosis, and mitotic feedback-control protein MAD2, involved in cell-cycle feedback control that allows cells to exit mitosis (Li and Murray, 1991). A reduction in the expression of several DNA repair genes including Mut S
EFFECT OF INORGANIC ARSENIC ON KERATINOCYTE GENE EXPRESSION
309
FIG. 2. Graphical representation of expression profiles corresponding to several genes selected by self-organizing maps (Silicon Genetics, Redwood City, CA) to constitute a unique trend of expression within the data set. This analysis demonstrates (A) dose- and (B) time-dependent gene expression in AsIII-treated NHEK relative to controls. Genes represented in panel A are different from the subset of genes in panel B.
FIG. 1. Growth characteristics of cells treated with arsenite. (A) Cytotoxicity of sodium arsenite on normal human epidermal keratinocytes (NHEK). Keratinocytes were seeded into 96-well plates (2500 cells/well) and grown to ⬃50% confluence at which time the indicated concentrations of AsIII were added. Cytotoxicity was assessed 24 h later by spectrophotometric quantification of neutral red uptake; data from 1 of 3 experiments performed is presented. Each point represents the mean of 3 samples expressed as percent control, error bars denote SEM. *Statistically significant (p ⬍ 0.05) difference from control (no AsIII) according to Student’s t-test. (B) Effect of short-term arsenite exposure on DNA synthesis in NHEK. Cells were exposed to the indicated concentrations of AsIII, and labeled with [ 3H]thymidine 46 h later. Acid precipitable 3H was quantitated by scintillation counting. Each data point indicates the mean of 4 samples represented as a percentage of time-matched controls (no AsIII); error bars denote SEM. *Statistically significant difference (p ⬍ 0.05) from the untreated controls according to Student’s t-test. (C) Mitotic index alteration in response to AsIII exposure. Ratio of raw counts of
homolog 5 (MSH5), involved in recombination (Edelmann et al., 1999), APEX nuclease, a DNA repair enzyme with exonuclease and apurinic/apyrimidinic endonuclease activities, DNA polymerase delta, and Damage specific DNA-binding protein 2 (DDB2) was also apparent in AsIII-treated NHEK (Table 1). Figure 3B shows the expression pattern of representative DNA repair genes that respond in a time- and dose-dependent manner following AsIII exposure.
cells undergoing mitosis (per 2000 cells counted) of exposed over control values plotted against dose and time of exposure to AsIII. *Statistical significance of change in treated samples with respect to time-matched control levels (n ⫽ 6, p ⬍ 0.05) according to Student’s t-test.
310
HAMADEH ET AL.
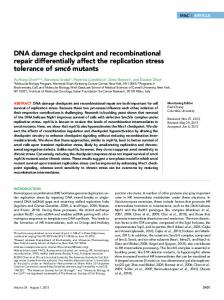
Finally, in the present study, gene expression relevant to proliferative signal transduction was altered in response to AsIII treatment (Table 1, Fig. 3C). These changes include the downregulation of several protein tyrosine phosphatases and differentiation genes (Fig. 3C), as well as an increase in protein kinase C delta expression and several growth factors (Fig. 3C). These changes may contribute to the increased proliferation in NHEK, as measured by elevated [ 3H]thymidine incorporation after 48 h of AsIII exposure (Fig. 1B). Gene Expression Validation We validated, via Northern blotting, the expression profile of 7 genes that are associated with oxidative stress, DNA repair, and proliferation from samples exposed to 0.005–5 M at 24 h. Comparison of data from cDNA microarray and Northern blotting demonstrated a high level of correlation between the two methods (Fig. 4), where the induction or repression of each gene was confirmed across multiple samples. Microarray measurements are typically only semi-quantitative, with compression of values occurring at high fold changes. The Northernblot measurements are likely to provide better quantitation, but generally the quantitative measurements with the two approaches shows a high degree of correlation (Amundson et al., 1999). Effect of N-Acetylcysteine We observed a change in DNA-repair gene expression concomitant with changes in gene expression correlated with oxidant stress. To determine whether there is a relationship between oxidative stress in AsIII-induced modulation of DNA repair and proliferation-associated gene expression, NHEKs, pretreated with a nontoxic concentration of N-acetylcysteine (NAC) (5 mM) for 2 h, were exposed to 5 M AsIII for 24 h. NAC is responsible for protective effects mainly due to its nucleophilic and antioxidant properties (De Flora et al., 2001). The effect of NAC pretreatment on expression of DNA repair and proliferation-associated genes in cells exposed to 5 M AsIII was quantified using Northern blot analysis (Fig. 5). The data indicates a partial or complete attenuation of AsIII-mediated gene expression alterations following NAC treatment for several of the genes examined (⬃1.5– 4.5 fold decrease). Interestingly, while the decrease in NAD(P)H quinone oxidoreductase and serine/threonine kinase 25 levels by NAC did not result in complete reversal of AsIII effects (⬃2.4 –1.5-fold decrease), levels of p53, PKC delta and cdc25b returned to control levels in NAC-pretreated, AsIII-exposed cells. These data suggest that oxidative stress induced by AsIII may contribute to the aforementioned gene expression changes relating to DNA repair and proliferation. DISCUSSION
This report provides a summary of gene expression changes that may contribute to arsenic’s carcinogenic and toxic mode of
action. We propose that AsIII exposure results in a simultaneous combination of biological effects including increased oxidative stress, decreased DNA repair efficiency, and increased proliferation in NHEK. Ultimately, these changes may contribute to the selection and proliferation of pre-malignant cells. The induction of oxidative stress-related genes by AsIII in this study suggests that oxidative stress generation occurs in AsIII-exposed NHEKs. Several in vivo and in vitro studies indicate that arsenic produces reactive oxygen species (ROS) such as the dimethylarsinic peroxy radical via dimethylarsine, a metabolite of dimethylarsinic acid (DMA), which in turn is the dimethylated metabolite of AsIII (Yamanaka and Okada, 1994). While high levels of ROS might be predictive of increased tumor formation in rodents, carcinogenesis has not been demonstrated in vivo with arsenic exposure solely (Kroes et al., 1974). Therefore, generation of ROS, while having a cooperative role, is not likely the primary, or the sole, mechanism of arsenic carcinogenicity. Our gene expression data suggest that DNA–protein damage resulting from AsIII induced oxidative stress, direct physical interaction of AsIII with cellular enzymes, or mimicking of phosphate by AsV does not occur at lower doses. At higher doses, where increased DNA damage would be predicted to occur, SOD1 and p21 were upregulated. The management of oxidative stress is the job of numerous cellular enzymes. One of these enzymes, NAD(P)H quinone oxidoreductase (NQO1), is a flavoprotein that catalyzes the reduction of quinones, quinone imines, and azo-dyes, thereby protecting cells against free radical and ROS-mediated mutagenicity and carcinogenicity (Jaiswal, 1994). Elevated NQO1 activity and gene expression also were observed in both preneoplastic tissues and established tumors (Cresteil and Jaiswal, 1991). In our study, NQO1 expression was robustly elevated following exposure of NHEK to AsIII. The significance of this finding is increased by a study demonstrating that arsenic can enhance TCDD-inducible NQO1 gene expression, indicating that co-exposure to arsenic and AHR ligands (which are prevalent in the environment) may disrupt the regulation of phase I and phase II detoxification genes (Maier et al., 2000). The latter may lead to imbalances in gene expression that have important consequences in skin toxicity and cancer. Because glutathione is central in the arsenic detoxification scheme, via its involvement in methylation, scavenging of free radicals, and direct binding to AsIII, we hypothesized that elevated levels of GSH would attenuate changes in gene expression mediated by AsIII in NHEK, an effect that has been largely unexplored in this model system. NAC, which was used to elevate intracellular GSH prior to AsIII exposure and subsequent gene expression analysis, attenuated many of the effects of AsIII on gene expression. Interestingly, the attenuation was not specific to oxidant stress-related genes but also genes associated with DNA repair and proliferation, suggesting a
311
EFFECT OF INORGANIC ARSENIC ON KERATINOCYTE GENE EXPRESSION
TABLE 1 Groups of Genes That Were Modulated by AsIII Treatment in a Statistically Significant Manner
Genes Stress Metallothionein Ie Metallothionein IL Metallothionein IH Metallothionein II Cyclooxygenase 2 Thioredoxin Thioredoxin reductase 1 Thioredoxin reductase 1 Thioredoxin reductase 1 Glutathione S-transferase (microsomal) Glutathione S-transferase P ␥ Glutamylcysteine synthetase Glutaredoxin Superoxide dismutase 1 (Cu/Zn) Clusterin Aldehyde dehydrogenase, mitochondrial NAD(P)H:quinone oxidoreductase DnaJ protein homolog 1, hsp40 DnaJ protein homolog 2, hsp40 Hsp40 homolog MAP kinase phosphatase 1 Serine/threonine kinase 25, Ste20-like Alkaline phosphatase Pou transcription factor 2 S100 calcium responsive protein A10 Decreased DNA repair Endonuclease G G/T mismatch-specific thymine DNA glycosylase FLAP endonuclease 1 Uracil DNA glycosylase 2 DNA polymerase delta APEX nuclease XP C Damage specific DNA binding protein 2 (p48) p53 DNA polymerase epsilon REV3 catalytic subunit of DNA polymerase zeta Mut S (E .coli) MSH 5 Mut Y (E. coli) homolog DNA (cytosine-5)-methyltransferase 1 HnRNP methyltransferase Signaling TNF-␣ NFB-1, p105 NFB-1, p65 Jun Fos CREB binding protein TGF- receptor TNF type 1 receptor-associated protein
Gene ID
Modulation
344345 297392 214162 484963 147050 415014 47458 280069 625871 292633 136235 203721 142123 37792 178176 197657 161566 486666 471708 546600 488150 487554 69232 429622 376402
1 1 1 1 1 1 1 1 1 1 1 1 1 1 1 1 1 1 1 1 1 1 1 1 1
985704
2
321997 49950 592605 591098 248532 2162079
2 2 2 2 2 2
209321 236338 321207
2 2 2
700572 1013142 268727 124424 470633
2 2 2 2 2
328694 114648 1089718 127089 26474 26474 510174 328694
2 2 2 2 2 2 2 2
Genes Increased proliferation Ras GTP-binding protein PKC delta GTPase-activating protein 1 GTPase-activating proteins (GAP) SH3 Guanine nucleotide exchange factor GDP-dissociation inhibitor protein MAP kinase phosphatase 3 Interferon-inducible guanylate binding protein 2 Interferon induced transmembrane protein 2 Interferon-stimulated protein, 15 kDa Gu protein Retinoic acid responsive protein Retinoic acid induced RIG E precursor Retinoic acid receptor ␥ 1 Early growth responsive protein 1 ERG1 binding protein 1 Cyclin G1 Zinc finger transcription factor hEZF Cyclin D2 Cdc25b Mitotic feedback control protein MAD2L1 MAD, MAX binding protein Growth arrest specific protein, gas Transferrin receptor, p90 PCTAIRE protein kinase 3, related to cdc2 FGFR4 Carcinogenesis biomarkers MM-1, c-myc binding protein p21, Cip1, WAF1 GRO 1 oncogene, melanoma growth stimulating Insulin-induced protein 1 Connective tissue growth factor Proliferation-associated gene A Kruppel factor 8 Tumor suppressor LUCA 1 Tumor-associated antigen L6 Tumor-associated signal transducer 2 V-yes oncogene Cellular adhesion/structural modeling Protein tyrosine phosphatase, receptor type f polypeptide Laminin  2 Integrin  4 Matrix metalloproteinase 2 Matrix metalloproteinase 1 Matrix metalloproteinase 1 Bullous pemphigoid antigen, plectin Capping protein, actin filament ␣ 1 Collagen binding protein 2, chaperone Cell membrane glycoprotein, antigen
Gene ID
Modulation
346396 123666 428733 24125 358841 375900 487374 42464
1 1 1 2 2 2 1 2
346117 487092 546256 305307 41159 322861 471252 162772 113941 321743 188232 359412 179373 129140 233176 512294 129778 222053 116781
2 2 2 2 2 2 2 2 2 1 2 2 2 2 2 2 1 1 1
376239 268652
1 1
489458 487407 87513 484685 39436 356890 280768 491637 193913
1 1 1 1 1 1 1 1 1
364982 485332 153737 146311 325050 549368 186409 510294 417358 546921
2 2 2 1 2 2 2 1 1 1
Note. Genes were determined statistically using binomial distribution, as indicated in the Materials and Methods section to change in both a time- and dose-dependent manner. Modulation indicates relative induction (1) or repression (2) in AsIII-exposed cells compared to time-matched controls.
312
HAMADEH ET AL.
relationship between oxidant stress and DNA repair and proliferation in response to AsIII exposure. In addition, there was evidence of suppression of DNA repair genes in response to AsIII treatment. The exact mechanism involved in the downregulation of DNA repair gene expression is currently unknown; however, p53 suppression might play a role in this process (Smith et al., 2000). p53 controls several aspects of the cell cycle that allow for DNA repair, and it also has been implicated directly in the regulation of DNA repair genes (Zhu et al., 2000). A previous report showed a decrease in p53 protein levels in immortalized keratinocytes (HaCaT) in response to AsIII exposure (Hamadeh et al., 1999) and hypermethylation of a p53 promoter region was observed in A549 cells exposed to AsIII (Mass and Wang, 1997). Arsenic-related basal cell carcinomas were found to express lower p53 staining compared to control patients exhibiting sporadic cell carcinomas (Boonchai et al., 2000). These data indicate that p53 downregulation occurs at both the transcription and protein level following arsenic exposure. p53 transcript suppression may also have consequences on cell cycle progression and G 2/M checkpoint function that might lead to altered damage repair. Repression of DNA repair enzyme gene expression is one of the novel findings in this report. Although DNA repair alterations have been cited in conjunction with arsenite exposure (Hartwig et al., 1997; Rossman et al., 2001), the mechanism of repair inhibition has been attributed to the physical affinity/ binding of AsIII to vicinal dithiol groups inherent to the repair enzymes. However, in this report we show that AsIII works at the transcriptional level to repress a suite of DNA repair enzyme genes (Table 1). This suggests that arsenic may work at more than one level to deregulate DNA repair that, in combination with other events, contributes to toxicity or cancer. The downregulation of DNA (cytosine-5-)-methyltransferase 1 occurred in a dose- and time-dependent fashion following AsIII treatment (Fig. 3B), and was of particular interest because altered biological (DNA and protein) methylation is proposed to contribute to arsenic carcinogenicity. While a decrease in methyltransferase 1 message was evident at higher doses (2.5 and 5 M), a slight, yet statistically significant increase was detected at lower doses (0.005 and 0.5 M). The role DNA methyltransferase plays in arsenic-induced toxicity
FIG. 3. (A) Expression patterns of representative genes corresponding to oxidative stress and detoxification. Data is represented in two-dimensional plots where the log2 ratio of intensity values of AsIII-exposed over timematched control samples are plotted against concentrations of AsIII. MT, metallothionein; CPP oxidase, coproporphyrinogen oxidase; NQO1, NAD(P)H quinone oxidoreductase; TRR1, thioredoxin reductase 1; STK25, serine/threonine kinase 25, ste20-like; SOD1, superoxide dismutase 1 (Cu/Zn); AP, alkaline phosphatase. (B) Expression patterns of representative genes corresponding to DNA repair. Data is represented in two-dimensional plots where the log2 ratio of intensity values of AsIII-exposed over time-matched control samples are plotted against concentrations of AsIII. DDB2, damage specific DNA binding protein 2; APEX, apurinic/apyrimidinic DNA lyase;
DMT1, DNA (cytosine-5-)-methyltransferase 1; HMT1, (hnRNP methyltransferase, S. cerevisiae)-like 2. (C) Expression patterns of representative genes corresponding to proliferation/cell cycle. Data is represented in 2-D plots where the log2 ratio of intensity values of AsIII-exposed over time-matched control samples are plotted against concentrations of AsIII. RARP, retinoic acid responsive protein; RAR ␥, retinoic acid receptor ␥; PTP zeta, protein tyrosine phosphatase, receptor type zeta; cdc25b, M phase inducer phosphatase 2 cdc25b; PKC delta, protein kinase C delta; IIP1, insulin induced protein 1; PAGA: proliferation-associated gene A; TR90, transferrin receptor 90; FGFR4, fibroblast growth factor receptor 4. *Gene expression altered by AsIII treatment in a statistically significant manner relative to time-matched control samples (p ⬍ 0.0048, n ⫽ 4).
EFFECT OF INORGANIC ARSENIC ON KERATINOCYTE GENE EXPRESSION
313
FIG. 4. Northern blot validation of transcript abundance corresponding to representative genes altered with AsIII treatment for 24 h. Left panel, Northern blot analysis of 20 g total RNA from NHEK exposed to AsIII for 24 h. Phosphorimages representing the expression of transcripts corresponding to 7 genes: FGFR4, PKC⭸, MSH5, serine/threonine kinase 25, NAD(P)H quinone oxidoreductase, cdc25b, and p53. Right panel, band intensities were quantified from digitized membranes using NIH Image software. Normalization of band intensities was performed by adjusting pixel value for each band (after background subtraction) to the 28S and 18S rRNA bands from an ethidium bromide-stained gel. Intensity values (normalized) from the Northern blots (open bars) were plotted with the corresponding values obtained from cDNA microarray analysis (filled bars).
FIG. 5. Graphical comparison of expression profiles corresponding to 7 genes in 5 M AsIII-treated cells, with and without n-acetyl cysteine pretreatment.
and cancer remains unclear; however, the linearity of the dose response at 8 and 24 h (0.96 and 0.98 respectively) (Fig. 3B) suggests a strong relationship between AsIII treatment and repression of DNA methyltransferase. This data is consistent with the dose- and time-dependent downregulation of HMT1 (hnRNP methyltransferase, S. cerevisiae)-like 2, which is responsible for the methylation of arginine residues on proteins, and may help to explain the reduction in monomethylarginine levels that occur following arsenic treatment of 3T3 fibroblasts (Wang et al., 1992). Data in this report reveal that AsIII (at low doses) increases cellular proliferation in NHEK as measured by an increase in cellular mitoses and [ 3H]thymidine incorporation. These observations confirm the effects of arsenic on cell proliferation observed in rodent cells and human fibroblasts and keratinocytes (Trouba et al., 1999; Vega et al., 2001). Our data suggest that the enhanced proliferation associated with AsIII exposure may be mediated in part by multiple mechanisms, including alterations in cell cycle regulators such as
314
HAMADEH ET AL.
Cyclin G1, whose upregulation is associated with proliferating tissue or rapidly dividing cells (Zhu et al., 1997), the downregulation of negative regulators of proliferation, such as protein tyrosine phosphatase signaling (Afshari and Barrett, 1994), TGF- (Gniadecki, 1998) or TNF-␣ signaling pathways (Detmar and Orfanos, 1990). Other events that may contribute to the enhancement of cell proliferation following arsenic exposure include the activation/ dysregulation of mitogen and stress-activated protein (MAP) kinase pathways (Trouba et al., 2000). Data demonstrate that PKC delta, a gene upregulated by AsIII in NHEK in our study, plays an important role in AsIII-induced AP-1 activation in JB6 cells through different MAP kinase pathways (e.g., ERKs, JNKs, and p38 kinases) (Huang et al., 2001). The latter, along with data in the present report, suggest that long-term alterations in PKC delta/Ca 2⫹-related signaling may contribute to abnormal cell growth and differentiation in the skin, the result of AsIII exposure. Indeed, this is consistent with our observations of decreased expression of differentiation-associated genes (Seewaldt et al., 1997) such as retinoic acid-responsive protein, retinoic acid-induced RIG precursor, and retinoic acid receptor ␥ 1 in AsIII-treated cells. The data in the current report suggests another novel mechanism by which arsenic may influence MAP kinase- and stress-related signal transduction pathways. Ste20-homologous proteins (e.g., STK25) are implicated in mammalian MAP kinase pathways as important transducers of oxidant-mediated signals from the p21 family of GTPases (Brown and Kitchin, 1996), and are activated by cellular stress (Pombo et al., 1997). We found that NHEK STK25 expression is elevated following AsIII exposure. At present, the long-term consequences of AsIII-induced STK25 gene expression in NHEK is unknown. However, our data implicate STK25 in the transduction of AsIII-mediated mitogenic and stress signals; signals that may contribute to skin carcinogenesis and toxicity To infer the mechanism of arsenic carcinogenicity from a relatively short duration of exposure has limitations. Longterm exposure of NHEK to AsIII is challenging due to the onset of differentiation, which makes it difficult to monitor long-term genotypic and phenotypic events that are consequences associated with alterations in gene expression. The gene expression alterations induced by AsIII in NHEKs can cooperatively lead to transforming events pertinent to carcinogenesis. This hypothesis is supported by the increase in several transformation or tumor associated biomarkers in AsIII-treated NHEKs. For example, gro-1 oncogene, v-yes oncogene, tumorassociated signal transducer 2, tumor associated antigen L6, capping protein, and MM-1 were observed to be induced in a dose- and time-dependent manner. The downregulation of cellular adhesion-related gene products, including laminin  2, metalloproteinase 1 and integrin  4, was also observed. Dysregulation of cellular adhesion has been documented in several cancers (Ota et al., 2001). Transcripts for Gro 1, tumor-associated antigen L6, and capping protein are abundantly ex-
pressed in both tumorigenic (Pam 212) and metastatic (Pam LY and LU) cell lines derived from BALB/c keratinocytes, as compared to primary keratinocytes (Dong et al., 2001). A reduction in laminin  2, DNA polymerase delta, and matrix metalloproteinase 1 transcript levels also were found in Pam 212 and Pam LY/LU cell lines when compared to the primary keratinocytes, a phenomenon that we also observed as a result of AsIII treatment. The relevance of these alterations to the carcinogenic action of AsIII is supported by the fact that squamous cell carcinoma is the same endpoint observed in human populations exposed to relatively high levels of arsenic in drinking water (Boonchai et al., 2000; Leonard and Lauwerys, 1980). Evidence that AsIII modulates the expression of these genes in a similar fashion suggests that the consequences of these mechanistic alterations are associated with similar transformation events as reported by Dong and coworkers (2001). The main observations of this study, the simultaneous increase in gene expression indicative of oxidative stress, decrease in transcript levels of DNA repair enzymes, and increase in cell proliferation gene expression, suggest an integrative mode of action of arsenic. The novelty of the results presented here is that AsIII concomitantly modulates gene expression associated with increased proliferation, decreased DNA repair, and increased oxidative stress in nontransformed NHEK. The data presented in the current report gives rise to multiple testable hypotheses regarding gene expression that may contribute to or play a role in arsenic toxicity and carcinogenesis. The use of specific pharmacological inhibitors and/or gene knockout models will provide invaluable tools for assessing the relationship between arsenic-induced gene expression, toxicity, and cancer. Further studies will also aim at distinguishing arsenic-specific effects from responses to other metals. These studies will, ultimately, help to integrate specific gene expression alterations with phenotypic endpoints germane to the carcinogenicity potential of arsenic and may lead to better biomarkers of exposure/effects. ACKNOWLEDGMENTS We thank Astrid Haugen, Neysa Garner, Jennifer Collins, Pierre Bushel, Ahmed Khan, Kristen Geisenhoffer, and Charles Tucker for their technical help in various aspects of these experiments. We also thank Drs. Raymond Tennant and Richard Paules for helpful discussions and Drs. Ben van Houten and Jamie Bonner for critical review of the manuscript.
REFERENCES Afshari, C. A., and Barrett, J. C. (1994). Disruption of G0 –G1 arrest in quiescent and senescent cells treated with phosphatase inhibitors. Cancer Res. 54, 2317–2321. Amundson, S. A., Bittner, M., Chen, Y., Trent, J., Meltzer, P., and Fornace, A. J., Jr. (1999). Fluorescent cDNA microarray hybridization reveals complexity and heterogeneity of cellular genotoxic stress responses. Oncogene 18, 3666 –3672. ATSDR (2000). Toxicological profile for arsenic. Agency for Toxic Sub-
EFFECT OF INORGANIC ARSENIC ON KERATINOCYTE GENE EXPRESSION
315
stances and Disease Registry, U.S. Department of Health and Human Services, Public Health Service.
excision repair in UV-irradiated human fibroblasts. Carcinogenesis 18, 399 – 405.
Bayol-Denizot, C., Daval, J. L., Netter, P., and Minn, A. (2000). Xenobioticmediated production of superoxide by primary cultures of rat cerebral endothelial cells, astrocytes, and neurones. Biochim. Biophys. Acta 1497, 115–126.
Huang, C., Bode, A. M., Chen, N. Y., Ma, W. Y., Li, J., Nomura, M., and Dong, Z. (2001). Transactivation of AP-1 in AP-1-luciferase reporter transgenic mice by arsenite and arsenate. Anticancer Res. 21, 261–267.
Boonchai, W., Walsh, M., Cummings, M., and Chenevix-Trench, G. (2000). Expression of p53 in arsenic-related and sporadic basal cell carcinoma. Arch. Dermatol. 136, 195–198. Brown, J. L., and Kitchin, K. T. (1996). Arsenite, but not cadmium, induces ornithine decarboxylase and heme oxygenase activity in rat liver: Relevance to arsenic carcinogenesis. Cancer Lett. 98, 227–231. Bushel, P. R., Hamadeh, H., Bennett, L., Sieber, S., Martin, K., Nuwaysir, E. F., Johnson, K., Reynolds, K., Paules, R. S., and Afshari, C. A. (2001). MAPS: A microarray project system for gene expression experiment information and data validation. Bioinformatics 17, 564 –565. Byron, W. R., Bierbower, G. W., Brouwer, J. B., and Hansen, W. H. (1967). Pathologic changes in rats and dogs from two-year feeding of sodium arsenite or sodium arsenate. Toxicol. Appl. Pharmacol. 10, 132–147. Chen, Y., Dougherty, E. R., and Bittner, M. L. (1997). Ratio-based decisions and the quantitative analysis of cDNA microarray images. J. Biomed. Optics 2, 364 –374.
Jaiswal, A. K. (1994). Human NAD(P)H:quinone oxidoreductase2: Gene structure, activity, and tissue-specific expression. J. Biol. Chem. 269, 14502–14508. Kitchin, K. T. (2001). Recent advances in arsenic carcinogenesis: Modes of action, animal model systems, and methylated arsenic metabolites. Toxicol. Appl. Pharmacol. 172, 249 –261. Kreppel, H., Bauman, J. W., Liu, J., McKim, J. M., Jr., and Klaassen, C. D. (1993). Induction of metallothionein by arsenicals in mice. Fundam. Appl. Toxicol. 20, 184 –189. Kroes, R., van Logten, M. J., Berkvens, J. M., de Vries, T., and van Esch, G. J. (1974). Study on the carcinogenicity of lead arsenate and sodium arsenate and on the possible synergistic effect of diethylnitrosamine. Food Cosmet. Toxicol. 12, 671– 679. Leonard, A., and Lauwerys, R. R. (1980). Carcinogenicity, teratogenicity, and mutagenicity of arsenic. Mutat. Res. 75, 49 – 62. Li, R., and Murray, A. W. (1991). Feedback control of mitosis in budding yeast. Cell 66, 519 –531.
Cresteil, T., and Jaiswal, A. K. (1991). High levels of expression of the NAD(P)H:quinone oxidoreductase (NQO1) gene in tumor cells compared to normal cells of the same origin. Biochem. Pharmacol. 42, 1021–1027.
Maier, A., Dalton, T. P., and Puga, A. (2000). Disruption of dioxin-inducible phase I and phase II gene expression patterns by cadmium, chromium, and arsenic. Mol. Carcinog. 28, 225–235.
De Flora, S., Izzotti, A., D’Agostini, F., and Balansky, R. M. (2001). Mechanisms of N-acetylcysteine in the prevention of DNA damage and cancer, with special reference to smoking-related end-points. Carcinogenesis 22, 999-1013.
Mass, M. J., and Wang, L. (1997). Arsenic alters cytosine methylation patterns of the promoter of the tumor suppressor gene p53 in human lung cells: A model for a mechanism of carcinogenesis. Mutat. Res. 386, 263–277.
Detmar, M., and Orfanos, C. E. (1990). Tumor necrosis factor-␣ inhibits cell proliferation and induces class II antigens and cell adhesion molecules in cultured normal human keratinocytes in vitro. Arch. Dermatol. Res. 282, 238 –245. Dong, G., Loukinova, E., Chen, Z., Gangi, L., Chanturita, T. I., Liu, E. T., and Van Waes, C. (2001). Molecular profiling of transformed and metastatic murine squamous carcinoma cells by differential display and cDNA microarray reveals altered expression of multiple genes related to growth, apoptosis, angiogenesis, and the NF-B signal pathway. Cancer Res. 61, 4797– 4808. Duggan, D. J., Bittner, M., Chen, Y., Meltzer, P., and Trent, J. M. (1999). Expression profiling using cDNA microarrays. Nat. Genet. 21, 10 –14. Edelmann, W., Cohen, P. E., Kneitz, B., Winand, N., Lia, M., Heyer, J., Kolodner, R., Pollard, J. W., and Kucherlapati, R. (1999). Mammalian MutS homologue 5 is required for chromosome pairing in meiosis. Nat. Genet. 21, 123–127. Germolec, D. R., Yoshida, T., Gaido, K., Wilmer, J. L., Simeonova, P. P., Kayama, F., Burleson, F., Dong, W., Lange, R. W., and Luster, M. I. (1996). Arsenic induces overexpression of growth factors in human keratinocytes. Toxicol. Appl. Pharmacol. 141, 308 –318. Gniadecki, R. (1998). Regulation of keratinocyte proliferation. Gen. Pharmacol. 30, 619 – 622. Gonsebatt, M. E., Vega, L., Salazar, A. M., Montero, R., Guzman, P., Blas, J., Del Razo, L. M., Garcia-Vargas, G., Albores, A., Cebrian, M. E., Kelsh, M., and Ostrosky-Wegman, P. (1997). Cytogenetic effects in human exposure to arsenic. Mutat. Res. 386, 219 –228. Hamadeh, H. K., Vargas, M., Lee, E., and Menzel, D. B. (1999). Arsenic disrupts cellular levels of p53 and mdm2: A potential mechanism of carcinogenesis. Biochem. Biophys. Res. Commun. 263, 446 – 449. Hartwig, A., Groblinghoff, U. D., Beyersmann, D., Natarajan, A. T., Filon, R., and Mullenders, L. H. (1997). Interaction of arsenic(III) with nucleotide
Matsui, M., Nishigori, C., Toyokuni, S., Takada, J., Akaboshi, M., Ishikawa, M., Imamura, S., and Miyachi, Y. (1999). The role of oxidative DNA damage in human arsenic carcinogenesis: Detection of 8-hydroxy-2⬘-deoxyguanosine in arsenic-related Bowen’s disease. J. Invest. Dermatol. 113, 26 –31. Mazumder, D. N., Das Gupta, J., Santra, A., Pal, A., Ghose, A., and Sarkar, S. (1998). Chronic arsenic toxicity in west Bengal—the worst calamity in the world. J. Indian Med. Assoc. 96, 4 –7, 18. Nuwaysir, E. F., Bittner, M., Trent, J., Barrett, J. C., and Afshari, C. A. (1999). Microarrays and toxicology: The advent of toxicogenomics. Mol. Carcinog. 24, 153–159. Ota, T., Maeda, M., Tanino, M., and Tatsuka, M. (2001). Functional suppression of integrin  4-mediated adhesion caused by in vivo sequential selection for cancer cell intravasation. Anticancer Res. 21, 205–211. Pombo, C. M., Tsujita, T., Kyriakis, J. M., Bonventre, J. V., and Force, T. (1997). Activation of the Ste20-like oxidant stress response kinase-1 during the initial stages of chemical anoxia-induced necrotic cell death. Requirement for dual inputs of oxidant stress and increased cytosolic [Ca2⫹]. J. Biol. Chem. 272, 29372–29379. Prieto-Alamo, M. J., Jurado, J., Gallardo-Madueno, R., Monje-Casas, F., Holmgren, A., and Pueyo, C. (2000). Transcriptional regulation of glutaredoxin and thioredoxin pathways and related enzymes in response to oxidative stress. J. Biol. Chem. 275, 13398 –13405. Rossman, T. G., Uddin, A. N., Burns, F. J., and Bosland, M. C. (2001). Arsenite is a cocarcinogen with solar ultraviolet radiation for mouse skin: An animal model for arsenic carcinogenesis. Toxicol. Appl. Pharmacol. 176, 64 –71. Seewaldt, V. L., Caldwell, L. E., Johnson, B. S., Swisshelm, K., Collins, S. J., and Tsai, S. (1997). Inhibition of retinoic acid receptor function in normal human mammary epithelial cells results in increased cellular proliferation and inhibits the formation of a polarized epithelium in vitro. Exp. Cell. Res. 236, 16 –28. Smith, M. L., Ford, J. M., Hollander, M. C., Bortnick, R. A., Amundson, S. A.,
316
HAMADEH ET AL.
Seo, Y. R., Deng, C. X., Hanawalt, P. C., and Fornace, A. J., Jr. (2000). p53-mediated DNA repair responses to UV radiation: Studies of mouse cells lacking p53, p21, and/or gadd45 genes. Mol. Cell. Biol. 20, 3705–3714. Thorgeirsson, U. P., Dalgard, D. W., Reeves, J., and Adamson, R. H. (1994). Tumor incidence in a chemical carcinogenesis study of nonhuman primates. Regul. Toxicol. Pharmacol. 19, 130 –151. Trouba, K. J., Glanzer, J. G., and Vorce, R. L. (1999). Wild-type and Rastransformed fibroblasts display differential mitogenic responses to transient sodium arsenite exposure. Toxicol. Sci. 50, 72– 81. Trouba, K. J., Wauson, E. M., and Vorce, R. L. (2000). Sodium arseniteinduced dysregulation of proteins involved in proliferative signaling. Toxicol. Appl. Pharmacol. 164, 161–170. Vega, L., Styblo, M., Patterson, R., Cullen, W., Wang, C., and Germolec, D. (2001). Differential effects of trivalent and pentavalent arsenicals on cell proliferation and cytokine secretion in normal human epidermal keratinocytes. Toxicol. Appl. Pharmacol. 172, 225–232. Vogt, B. L., and Rossman, T. G. (2001). Effects of arsenite on p53, p21, and
cyclin D expression in normal human fibroblasts—a possible mechanism for arsenite’s comutagenicity. Mutat. Res. 478, 159 –168. Wang, C., Lin, J. M., and Lazarides, E. (1992). Methylations of 70,000-Da heat shock proteins in 3T3 cells: Alterations by arsenite treatment, by different stages of growth, and by virus transformation. Arch. Biochem. Biophys. 297, 169 –175. Yamanaka, K., and Okada, S. (1994). Induction of lung-specific DNA damage by metabolically methylated arsenics via the production of free radicals. Environ. Health Perspect. 102(Suppl. 3), 37– 40. Zhu, N. L., Wu, L., Liu, P. X., Gordon, E. M., Anderson, W. F., Starnes, V. A., and Hall, F. L. (1997). Downregulation of cyclin G1 expression by retrovirus-mediated antisense gene transfer inhibits vascular smooth muscle cell proliferation and neointima formation. Circulation 96, 628 – 635. Zhu, Q., Wani, M. A., El-Mahdy, M., and Wani, A. A. (2000). Decreased DNA repair efficiency by loss or disruption of p53 function preferentially affects removal of cyclobutane pyrimidine dimers from nontranscribed strand and slow repair sites in transcribed strand. J. Biol. Chem. 275, 11492–11497.