... Great Barrier Reef 95. Disease state. Family or order. Species/ growth form. WS. SEB. BrB. BNS BBD Tumour Uniden- tified. Merulinidae. Hydnophora rigida â.
3
Coral Disease on the Great Barrier Reef Bette L. Willis, Cathie A. Page, Elizabeth A. Dinsdale
3.1 Introduction Coral disease is one of the most recent in a series of threats that is challenging the resilience of coral reef communities and is of particular concern because it may interact with and augment the impacts of other commonly recognised threats to coral health (e.g. bleaching, over-exploitation of fish stocks, destructive fishing practices and coastal developments). Since the first report of coral disease by Antonius in 1973, the rate of discovery of new diseases has increased dramatically with more than 29 coral diseases now described (Green and Bruckner 2000, Weil, this Vol.). Although coral disease is emerging as one of the major causes of coral reef deterioration in the Caribbean (Hayes and Goreau 1998; Harvell et al. 2002; Weil et al. 2002), at present we know very little about the ecology or pathology of coral disease on Indo-Pacific reefs. The comparatively few reports of coral disease from Indo-Pacific reefs, despite the region encompassing more than 80% of reefs worldwide (Bryant et al. 1998) is in contrast to the high proportion (>65%) of records in the Global Disease Database from the Caribbean reef region, now widely considered to be a coral disease hotspot (Green and Bruckner 2000; Weil, this Vol.). Such comparisons suggest that either disease is genuinely more prevalent in the Caribbean or lack of studies in other reef regions is underestimating its distribution and abundance. Distinguishing between these two alternatives represents an important step in advancing global epizootiological studies. The rising incidence of marine diseases worldwide in the past few decades (Harvell et al. 1999), and particularly of coral diseases in the Caribbean, underscores the need for assessment of the status of disease on a region-by-region basis. Such assessments will help to identify the origins and reservoirs of pathogens and vectors involved in disease transmission. The Great Barrier Reef (GBR) stretches over 2000 km along the eastern coastline of Australia, representing the largest reef tract under management worldwide. Its unique status as one of the few reef systems under government jurisdiction for timescales that have preceded recent increases in the prevalence of coral disease has the potential to provide important insights into factors influencing disease occurrence and the underlying causes of escalating disease incidence. In this chapter, we summarise the current state of knowledge of coral disease on the Great Barrier Reef by (1) describing syndromes and diseases observed in our studies on GBR reefs and interpreted in the light of published literature
70
Bette L. Willis, Cathie A. Page, Elizabeth A. Dinsdale
and (2) presenting the results of a 5-year, large-scale study in conjunction with a regional disease prevalence study that together provide an overview of the current status of disease occurring on reefs extending over 1200 km of the Great Barrier Reef.
3.2 Overview of Diseases Infecting Great Barrier Reef and Indo-Pacific Corals Until recently, it has been tacitly assumed that disease has had little impact on the population dynamics or community structure of coral assemblages on the Great Barrier Reef (GBR). However, there have been only two detailed studies of coral diseases on the GBR, both at Lizard Island in the northern sector: one on black band disease (BBD; Dinsdale 2002) and the other on skeletal eroding band (SEB; Antonius 1999; Antonius and Lipscomb 2001). A few additional sightings of coral diseases have been reported in anecdotal notes, i.e. BBD (Miller 1996) and white band disease (WBD; Baird 2000), although the report of WBD must be viewed with caution since a number of diseases are now known to produce white band-like symptoms (e.g. WBDI, WBDII, white plague I and II). Fungal pathogens have also been reported in gorgonians (Morrison-Gardiner 2001) and tumours in scleractinian corals (Loya et al. 1984). However, in general, there have been few studies specifically targeting coral disease, a factor likely to have contributed to the current paradigm of apparently low occurrence of coral disease on the GBR. Elsewhere in the Indo-Pacific, in addition to BBD, SEB and WBD (Antonius 1985), there are isolated reports of diseases generally not yet described from the Caribbean. For example, yellow band disease (YBD) affected ten species primarily from the families Acroporidae and Poritidae in the Arabian Gulf (Korrubel and Riegl 1998); the encysting stage of a trematode has infected Porites compressa in Hawaii causing enlarged pink polyps (Aeby 1991); and Porites ulcerative white spot disease (PUWSD) infected more than 20% of Porites colonies on 8 out of 10 reefs surveyed in the Philippines (Raymundo et al. 2003). In addition, fungal-algal associations have affected Porites lobata in French Polynesia (Le Champion-Alsumard et al. 1995), cyanobacteria have affected Porites luta- in the Indian Ocean (Ravindran and Raghukumar 2002), and a bacterial pathogen has infected coralline algae [coralline lethal orange disease (CLOD)] throughout a large part of the South Pacific (Cook Islands, Fiji, Solomon Islands and Papua New Guinea, GBR; Littler and Littler 1995; C. Page, pers. observ.). Thus, despite the paucity of studies of coral disease in the Indo-Pacific region, the occurrence of the more common and infectious Caribbean diseases, in combination with reports of diseases unique to the region, suggest that infectious pathogens are a common component of Indo-Pacific reef communities and that disease may have a greater role in structuring coral communities in the region than previously thought.
3. Coral Disease on the Great Barrier Reef
71
3.2.1 Black Band Disease on the Great Barrier Reef Black-band disease was first observed on GBR reefs in 1994 (Dinsdale 1994), more than two decades after the first Caribbean record (Antonius 1973) and a decade after the first Indo-Pacific record (Antonius 1985).Initial Indo-Pacific records were for two massive faviid species, Goniastrea pectinata and Platygyra lamellina, from the Philippines and a further seven massive faviids from the Red Sea (ibid), but BBD has subsequently been recorded on 21 species in five families from Lizard Island, GBR (Dinsdale 2002). Unlike in the Caribbean, where BBD primarily infects massive species (Kuta and Richardson 1996), branching pocilloporid and acroporid corals are important host species on the GBR (6.0 and 3.6% of corals in the families Pocilloporidae and Acroporidae, compared to 3.0 and 2.1% in the primarily massive families Faviidae and Poritidae; Dinsdale 2002; Fig. 3.1a, b). Dinsdale (2002) found a mean prevalence of 2.8% (and range of 1.3–4.9%) on Lizard Island reefs in the summer of 1994, which is comparable to the prevalence of BBD on most Caribbean reefs (Green and Bruckner 2000, Weil 2003). Seasonal increases in the prevalence of BBD on reefs in the Caribbean region are related to high summer seawater temperatures, but may also be related to water depth, coral diversity, population density and elevated nutrients (Kuta and Richardson 1996, 2002; Bruckner and Bruckner 1997; Bruckner et al. 1997). However, there are no studies of factors associated with the prevalence of BBD on GBR reefs, so the global generality of these patterns, particularly the associations between high temperatures and nutrients and increased abundance of BBD, remains unclear. BBD isolated from Caribbean corals was originally described as a consortium of microorganisms dominated by Phormidium corallyticum, a gliding filamentous cyanobacteria, but including heterotrophic bacteria, marine fungus, sulphide-oxidising bacteria (Beggiatoa) and sulphate-reducing bacteria (Desulfovibrio; Ducklow and Mitchell 1979; Richardson 1996). However, recent molecular studies have identified anomalies in the identification of the cyanobacteria suspected to be the causative agent and a range of additional microorganisms associated with BBD mats of corals from St Croix, US Virgin Islands, Curacao, Netherlands Antilles and New Britain, Papua New Guinea (Cooney et al. 2002; Frias-Lopez et al. 2002, 2003). rDNA sequence analysis of microorganisms isolated from BBD mats have revealed the presence of up to three unidentified taxa of cyanobacteria, whereas P. corallyticum, the previously identified causative agent, was not detected (Cooney et al. 2002; Frias-Lopez et al. 2002, 2003). The lack of concordance in the cyanobacterial species associated with BBD mats between these and earlier studies and the differences in cyanobacterial taxa between Caribbean and Indo-Pacific (PNG) corals (Frias-Lopez et al. 2003) raise questions about the causative agent. They also highlight the need for further microbial and molecular studies of BBD from different coral species and from different reef regions. There have been no studies of microorganisms associated with BBD mats on GBR corals and it is possible that cyano-
72
Bette L. Willis, Cathie A. Page, Elizabeth A. Dinsdale
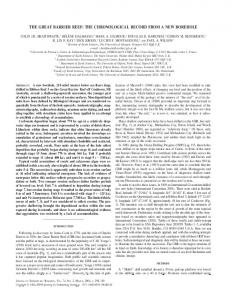
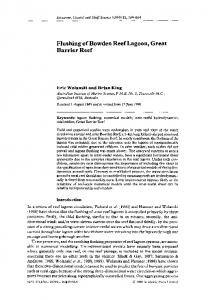
n Fig. 3.1A–H. Field appearance of diseases and syndromes infecting corals and gorgonians on
the Great Barrier Reef: a black band disease (BBD) on Acropora intermedia, b cyanobacterial mat, responsible for the black colouration of BBD, c unknown cyanobacteria forming a mat at tissue-skeleton interface, d unknown red-brown cyanobacteria forming BBD-like mat, e skeletal eroding band (SEB) on A. intermedia showing speckled appearance of band near tissue interface, f clusters of the ciliate, Halofolliculina corallasia, on live coral tissue ahead of the main SEB front, g white syndrome (WS) on Acropora hyacinthus in the Capricorn Bunker sector (photo AIMS LTMP), h WS on Acropora clathrata in the Lizard Is./Cooktown sector (photo AIMS LTMP)
3. Coral Disease on the Great Barrier Reef
n
73
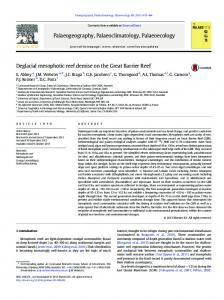
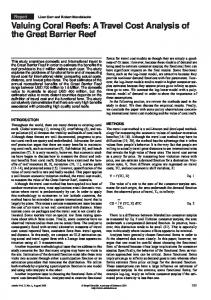
Fig. 3.1I–P.i brown band (BrB) on A. muricata, j clusters of the ciliates that cause the distinctive colouration of BrB, k black necrosing syndrome (BNS) on the gorgonian, Isis sp., l skeletal axis of Isis sp. exposed by BNS, m coral-algal interactions, n detail of filamentous algae overgrowing live coral tissue, o pink pigmented spots (PS) on massive Porites sp., p coral tumours on Acropora (photo L. Vail). All photographs were taken on Lizard Is. reefs by authors unless otherwise indicated
74
Bette L. Willis, Cathie A. Page, Elizabeth A. Dinsdale
bacteria associated with GBR infections may differ from those isolated from Caribbean and even PNG corals. During our regional disease prevalence surveys (see Sects. 3.3.1.2, 3.3.3), we identified more than one type of cyanobacteria associated with coral disease states that resembled BBD (Fig. 3.1c, d). Therefore, in our analysis we have included unidentified cyanobacterial syndromes in the BBD category. 3.2.2 Skeletal Eroding Band : an Indo-Pacific Coral Disease? Skeletal eroding band (SEB) is the only disease condition other than BBD for which there are more than anecdotal reports on the Great Barrier Reef. SEB is caused by the protozoan, Halofolliculina corallasia (Fig. 3.1e, f), which erodes the tissue and skeleton of corals as it produces a black lorica or test (Antonius 1999). Tissue damage occurs when the ciliates mechanically disrupt and lyse coral tissues through spinning and secretion of chemicals in the process of embedding their loricae within the coral skeletal matrix. Clusters of ciliates along the tissue-skeleton interface produce a black band (Fig. 3.1e) similar in appearance to black band disease, but the skeleton behind the advancing SEB is speckled with the remains of empty black loricae (Antonius and Lipscomb 2001), unlike the uniformly white skeleton exposed as BBD advances. Antonius and Libscomb (2001) report that the progression of SEB can be relatively slow, approximately 1 mm per week, further distinguishing it from BBD, but that it may also advance at rates up to 1 mm per day, comparable to BBD. SEB affects at least 24 species of corals on reefs throughout the Indo-Pacific, but despite searching, there are no records from the Caribbean or the Atlantic Ocean (Antonius and Lipscomb 2001). A qualitative, 6-point scale was used to measure the prevalence of SEB on Indo-Pacific reefs, scoring the abundance of disease from rare (1–3 cases of SEB/30-min swim) to catastrophic (>100 cases per 30-min swim) (ibid). Prevalence of SEB increased in all reef regions revisited; from rare to moderate (4–12 cases/30-min swim) in the 10 years between visits to Lizard Island, GBR (1988–1998), and from rare to frequent (13–25 cases) in the 8 years between visits to Mauritius (1990–1998) and in the 3 years between visits to the Sinai (1994–1997) (ibid). Apart from these records at Lizard Island in the northern sector, the geographic extent of SEB on the GBR is currently unknown (but see Sect. 3.3.3). 3.2.3 White Syndrome – a Collective Term for Conditions Producing White Symptoms on the Great Barrier Reef A proliferation of names for coral diseases that produce white symptoms in Caribbean corals presents challenges for relating Indo-Pacific white syndromes to the Caribbean white diseases based on macroscopic field characters. Rather than attempt to identify features such as the variable zone of bleached
3. Coral Disease on the Great Barrier Reef
75
tissue that distinguishes white band II (WBII) from white band I (WBI), or differences in the rates of movement that distinguish the faster moving white plague II (WPII) from white plague I (WPI; reviewed in Richardson 1998), we have chosen to use the collective term white syndrome (WS) to describe conditions resulting in white bands of tissue and/or skeleton on GBR corals (Fig. 3.1g, h). In addition to WBI/II and WPI/II, white syndrome could potentially encompass white pox (Patterson et al. 2002), patchy necrosis (Bruckner and Bruckner 1997; Rodriguez-Martinez et al. 2001), and even shut down reaction (Antonius 1977). However, WS is distinguished from feeding scars by the narrow width of the zone of recently exposed, white skeleton and the relatively regular appearance of the tissue front. These features are in contrast to the wide zone of white skeleton commonly exposed following Acanthaster planci predation and the scalloped or irregular tissue front produced by Drupella spp. Determining the relationship(s) between the Caribbean white diseases and WS and applying the appropriate name(s) will not be possible until pathogens infecting GBR corals are isolated and compared to those producing white symptoms in Caribbean corals. It is thus difficult to determine the accuracy of records of white band disease on the GBR (Baird 2000; Antonius and Lipscomb 2001) and of records of WBD infecting 20 coral species in the Philippines (Antonius 1985). However, since white band disease and white plague have caused major changes to coral communities in the Caribbean region (Aronson et al. 1998; Green and Bruckner 2000; Aronson and Precht 2001), the potential for their presence and impact on coral communities on the GBR should be viewed with concern (see Sect. 3.3.2 for current distribution and abundance of WS on the GBR). 3.2.4 Brown Band: a New Syndrome on the Great Barrier Reef Brown band (BrB) is a new syndrome that we have recorded for the first time infecting corals on surveys in the northern and southern sectors of the GBR (see Sect. 3.3.3). The distinctive macroscopic field symptom of corals infected with BrB is a brown zone of variable width, flanked by healthy tissue at the advancing front and exposed white skeleton at the trailing edge as the band progresses over the surface of the colony (Fig. 3.1i). There is often a white zone between the healthy tissue and brown band, which may comprise bleached tissue and/or denuded skeleton. Dense populations of ciliates, packed with zooxanthellae from engulfed coral tissue, cause the brown coloration of the band (Fig. 3.1j). As densities of ciliates decrease, the zone becomes lighter and may appear white at very low ciliate densities. In these latter cases, the condition would be assigned to the WS category based solely on field observations. It is possible that BrB is caused by the ciliate, Helicostoma nonatum, which is thought to produce a brown jelly-like condition on corals grown in aquaria (Borneman 2001), but to our knowledge, this ciliate infestation has not been reported previously from in situ corals. Note that an earlier report of a brown
76
Bette L. Willis, Cathie A. Page, Elizabeth A. Dinsdale
band on a colony of Acropora formosa (Dinsdale 1994) referred to a different, but unknown syndrome, and has subsequently been mistakenly quoted as affecting 20 coral species on the GBR (Santavy and Peters 1997; Borneman 2001). While it is possible that the unknown syndrome was caused by a cyanobacterium similar to the one causing red-band disease in the Caribbean, as suggested by Santavy and Peters (1997), in the absence of the specimen it is not useful to speculate further about this isolated observation; it is not to be considered a record of BrB as described here. 3.2.5 Gorgonian Infections on the Great Barrier Reef: Black Necrosing Syndrome Gorgonians are highly susceptible to disease in the Caribbean, where the fungal disease Aspergillosis has infected 12–90% of gorgonians on reefs in 13 countries (Nagelkerken et al. 1997a, b; Smith 2003) and black band disease has infected 13.8% of some species in the Florida Keys (Fengold 1988). However, little is known about gorgonian diseases on the GBR. The only study of GBR gorgonians to date reports that 10% of populations of Isis hippuris on Davies Reef were infected with a fungal disease that manifested as black necrotic areas and led to loss of both tissues and skeleton (Morrison-Gardiner 2001). Although two species of Penicillium isolated from infected gorgonians were able to infect healthy colonies of I. hippuris and Pinnigorgia sp., and could be re-isolated, they did not produce the typical symptoms of the disease (Morrison-Gardiner 2001). We have also observed black necrotic patches on many gorgonians at Lizard Island during our regional disease prevalence surveys (see Sect. 3.3.3) and will refer to the disease state as black necrosing syndrome (BNS; Fig. 3.1k, l). Whether gorgonian species on the GBR produce antifungal compounds similar to those produced by Caribbean gorgonians (Kim et al. 2000a, b), or vary in their susceptibility to fungal infections (Nagelkerken et al. 1997a) is unknown, but merits further study. 3.2.6 Coral-Algal Interactions: Algal Infections? The impacts of coral-algal interactions may be positive, neutral or negative for the coral (reviewed in McCook et al. 2001), with negative interactions generally being discussed in the context of competition. However, when interactions that negatively affect corals (1) result in net positive benefits for algae and (2) impede the functioning and growth of coral polyps (e.g. through direct overgrowth and/or invasion of coral tissue), they take on the character of a disease. On reefs in the central GBR, examples that appear to cross the boundary between a competitive interaction and disease include overgrowth of coral by (1) the filamentous algae, Coralliophila hurysmansii causing tissue swelling, and (2) by Anotrichium tenue, which traps mucus, sediments and possibly microbes
3. Coral Disease on the Great Barrier Reef
77
damaging the underlying tissues (McCook et al. 2001). We also found filamentous algae overgrowing live coral tissue in both the southern and northern GBR (Fig. 3.1m, n). What is unclear at this stage is whether some other stress or pathogen had previously weakened the corals’ resistance allowing algae to invade their tissues. Therefore, rather than attribute coral mortality solely to algal overgrowth in our disease prevalence surveys (Sect. 3.3.3), we assigned such cases to an unidentified syndrome category. However, reports of a coralline red alga, Pneophyllum conicum, overgrowing and killing up to 100% of colonies of nearly all coral species present on a patch of reef in Mauritius (Antonius and Afonso-Carillo 2001) suggest that algal overgrowth can reach epizootic status. Controlled experimental studies on the ability of algal species to infect healthy coral tissues will clarify the pathogenic nature these coral-algae interactions. 3.2.7 Pigmentation Response in Porites: A symptom with a variety of causes? The reef coral, Porites, appears to respond to a variety of competitive, invasive and parasitic challenges by producing pink or purple pigmentation in polyps adjacent to interaction sites (Fig. 3.1o). Hence pink lines, rings or spots are often visible in coral tissue bordering the margins of competing or boring organisms. The pigmentation appears to be a symptom of a response mounted by the coral to contain invading or competing organisms such as cyanobacteria (Ravindran and Raghukumar 2002), polychaetes, molluscs, and the intermediate metacercariae stage of the digenetic trematode, Podocotyloides stenometra (Aeby 1991, 1998). The trematode has been reported to encyst in tissues of the massive coral, Porites compressa, on Hawaiian reefs causing coral polyps to appear swollen and pink in colour (Aeby 1998). Infected polyps are unable to retract, reducing their function and increasing their vulnerability to predation by butterflyfish, the final host for the trematode. On Hawaiian reefs, the pink spots represent a parasitic infection, which reduces growth of heavily infected colonies by up to 50% (Aeby 1991). When the cysts were removed (through fish predation), healthy coral polyps were regenerated. We recorded the presence of pigmented spots (PS) on Porites colonies as a potential indicator of a parasitic infection in our GBR disease prevalence studies (see section 3.3.3). The pigmented spots appeared as small raised pink areas surrounded by healthy tissue, however the presence of trematodes has not been confirmed. Their location in the midst of healthy tissue is more consistent with a parasitic infection than a competitive interaction, unlike a variety of pink lines or rings that were commonly seen bordering dead patches and could generally be interpreted as a response to competitive interactions.
78
Bette L. Willis, Cathie A. Page, Elizabeth A. Dinsdale
3.2.8 Coral Tumours Coral tumours, manifesting as raised roughly spherical masses projecting about 4.5 cm above the surface of the colony, were reported to affect 18–24% of populations of Platygyra pini and P. sinensis on Magnetic Island, central GBR (Loya et al. 1984). Tumours were associated with increased growth rates of polyps and a general proliferation of all cell types, some atrophied and others normal, but in all cases macroscopic polyp structures were discernible and tissues remained pigmented (Loya et al. 1984). This type of abnormal growth has been termed a hyperplasia, in contrast to the bleached neoplasms that have been classified as calicoblastic epitheliomas. The latter appear as white, globular masses of skeleton raised above the surface of the colony and have few discernible polyp structures (reviewed in Peters et al. 1986). Tumours identified in our disease prevalence surveys were similar to the latter bleached neoplasms (Fig. 3.1p; see Sect. 3.3.3). Such tumours tend to be largest and most concentrated in the centre of colonies of table acroporids in the Gulf of Oman, whereas they tend to be similar in size along the length of branches in arborescent species (Coles and Seapy 1998). In high densities, tumours may reduce UV absorption rates (Coles and Seapy 1998), lipid storage capacity (Yamashiro et al. 2001) and linear growth rates of colonies (Bak 1983). Bleached neoplasms occur mainly on corals in the family Acroporidae and have been reported from throughout the Indo-Pacific, i.e. from Guam and Enewetak (Cheney 1975), French Polynesia (Le Champion-Alsumard et al. 1995), Japan (Yamashiro et al. 2001) and the Gulf of Oman (Coles and Seapy 1998).
3.3 Coral Disease Surveys on the Great Barrier Reef The diversity of diseases and syndromes infecting GBR corals as described above highlights the need for targeted surveys of coral disease in the region. Here, we present the results of two types of studies designed to redress this need: (1) a large-scale study comprising rapid annual surveys of coral disease abundance (# cases per site) on 48 reefs as part of the Australian Institute of Marine Science (AIMS) long-term monitoring program (LTMP; Sweatman et al. 2001), and (2) a regional study comprising belt transect surveys to estimate disease prevalence (i.e. the total number of cases of disease expressed as a proportion of the total number of colonies examined per reef, site, family/order or disease category as appropriate) at selected sites in the northern and southern GBR. The large-scale AIMS LTMP surveys provide a broad overview of the abundance of two coral diseases (WS and BBD) on reefs throughout the Great Barrier Reef and follow changes in the number of cases of each disease over the last 5 years. The regional disease prevalence surveys are designed to detect all diseases and syndromes present at selected GBR sites, to determine their prev-
3. Coral Disease on the Great Barrier Reef
79
alence with respect to species and family groups, and to determine changes in prevalence associated with season, coral cover and wave exposure. 3.3.1 Survey Protocols 3.3.1.1 Large-scale Australian Institute of Marine Science Long-Term Monitoring Program Surveys Forty-eight reefs spanning 1200 km of the Great Barrier Reef were surveyed for coral disease annually between 1998 and 2003 (Sweatman et al. 2001). Reefs were partitioned into six latitudinal sectors (i.e. Cooktown/Lizard Is., Cairns, Townsville, Whitsundays, Swains and Capricorn Bunkers sectors; Fig. 3.2) and three cross-shelf locations (inner, mid and outer-shelf). Within each sector, generally three reefs were surveyed in each of the three cross-shelf locations
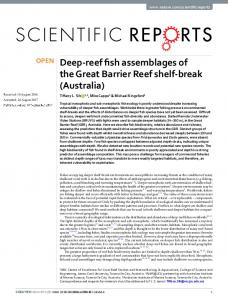
n Fig. 3.2. Map of the Great Barrier Reef showing (1) the six sectors, and (2) the inner-, mid- and
outer-shelf reefs in the Cooktown/Lizard Island sector and the outer-shelf reefs in the Capricorn Bunker sector that were surveyed as part of the Australian Institute of Marine Science Long Term Monitoring Program (AIMS LTMP), and (3) sites for the detailed surveys at Lizard Island and No Name Reef in the Cooktown/Lizard Is. sector and Heron Island in the Capricorn Bunker sector
80
Bette L. Willis, Cathie A. Page, Elizabeth A. Dinsdale
(full methods in Sweatman et al. 2001). In total, there were 15 cross-shelf/sector combinations, which we will refer to as regions. Five 50-m transects were surveyed at each of three sites on the northeast flank of each reef. Transects were permanently marked and followed depth contours on the reef slope at 6–9 m. Surveys in the first 2 years (1998/1999, 1999/2000) were spread over the warmer months (September–May), whereas in the last 3 years, surveys in some sectors included the austral winter months of July and August. Changes in the timing of the surveys are discussed further in the context of their impact on disease prevalence in Section 3.3.2.2. Coral mortality attributable to disease (BBD, WS), predation (Acanthaster planci, Drupella) and unknown sources was recorded in visual censuses (as per Bass and Miller 1996) of 2-m belts along each 50-m transect; thus an area of 1500 m2 was surveyed on each reef. Diseases were identified from macroscopic field symptoms as outlined in Sections 3.2.1 for BBD and 3.2.3 for WS. Counts of the number of coral colonies manifesting symptoms of the two disease states on each transect are hereafter referred to as the number of cases of BBD or WS. It is likely that some cases of skeletal eroding band (SEB) and brown band (BrB) are included in the WS category because both can appear as white zones when ciliate densities are low (discussed in Sect. 3.2.4). Mortality was attributed to A. planci or Drupella when white zones were consistent with the appearance of feeding scars (see Sect. 3.2.3) and/or these predators were visible in the vicinity of white zones adjacent to healthy coral tissue. If coral mortality could not be clearly attributable to disease or predation, it was recorded in the unknown category. Percent cover estimates of benthic groups were determined from video transects (further details in Page et al. 2001). 3.3.1.2 Regional Disease Prevalence Surveys To determine the prevalence of coral disease in summer, we surveyed eight sites in January 2003 in the northern and southern sectors of the GBR, where the AIMS LTMP found the highest number of cases of disease (see Sect. 3.3.2.2). The eight sites comprised: four mid-shelf sites at Lizard Island [two exposed (Bird Is., Lizard Head) and two sheltered (Vicki’s and Horseshoe Reefs)] and two outer-shelf sites at No Name Reef (the exposed NE front and sheltered NW back reef) in the northernmost sector; and two sites [one exposed (Coral Gardens) and one sheltered (Little Bay)] at Heron Island in the southernmost sector of the GBR (Fig. 3.2). The two sheltered Lizard Island sites were also surveyed in winter (July 2002) to initiate seasonal comparisons of disease prevalence. At each site, three random 20×2 m belt transects were surveyed along depth contours at 3–6 m and all hard corals, soft corals and gorgonians were identified to the lowest taxonomic level recognised or morphological group as appropriate.Each colony was then categorised as healthy, bleached, or assigned to one of eight disease categories: BBD (including BBD-like mats associated with a number of different cyanobacteria), SEB, WS, BrB, tumour, BNS, PS (pigmented spots on Porites), or
3. Coral Disease on the Great Barrier Reef
81
to an unidentified syndrome category. The unidentified syndrome category included filamentous algae overgrowing live coral tissue and unidentified syndromes causing deterioration in soft corals. Samples of diseased colonies were collected and examined microscopically to identify associated microorganisms and verify field identifications of disease states. To enable comparisons of disease prevalence with coral cover, we used line intercept surveys to record percent cover of the major benthic categories along the first 10 m of each transect. 3.3.1.3 Statistical Analysis Differences in the abundance of WS detected in the AIMS LTMP surveys among shelf positions, sectors and years were tested using split-plot ANOVA. The total number of diseased colonies were summed over transects on each reef. Data were log transformed [log (X+0.1)] to satisfy assumptions of normality and homogeneity of variances. Where significant changes in disease abundance over time among sectors and shelf positions were identified, available degrees of freedom were partitioned into single degree of freedom contrasts to determine the specific years in which changes occurred within each sector by shelf combination. The abundances of BBD were too low to allow formal analysis of change. Differences in distribution of WS among shelf positions, sectors and years were also examined by comparing changes in the proportion of transects on which WS was recorded using split-plot ANOVA. The number of transects with disease present was summed on each reef and divided by the number of transects sampled. The data were square root transformed to satisfy assumptions of normality and homogeneity of variances. As for WS abundance above, when significant changes over time in the proportion of transects with disease were identified among sectors and shelf positions, contrasts were used to determine the specific years in which changes occurred. The relationships between WS abundance and (1) hard coral cover and (2) Drupella spp. abundance were examined by including hard coral cover and abundance of Drupella as covariates in a split-plot ANOVA model. Interaction terms in the model were used to estimate how consistent differences in relationships with WS abundance were among sectors and shelf positions. The abundances of WS and Drupella were log (X+0.1) transformed for analysis as described above. Similarly, single degree of freedom contrasts were used to determine when the relationship between disease abundance and coral cover or Drupella abundances differed among sectors and shelf positions. The relationship between change in percent hard coral cover and change in WS abundance was also examined by including the change in cover of hard corals between years as a covariate in an additional split-plot ANOVA model. Variations in disease prevalence detected in the regional disease prevalence surveys were compared among reefs (Lizard Is., No Name, Heron Is.) and among seasons (winter vs. summer) and exposures (sheltered vs. exposed) on
82
Bette L. Willis, Cathie A. Page, Elizabeth A. Dinsdale
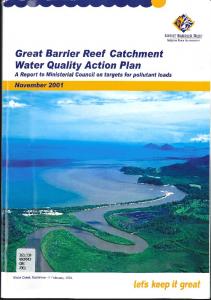
Lizard Is. reefs using separate 1-way ANOVAs. When Levene’s test determined that variances were heterogeneous, data were arcsine transformed. Differences in the distribution of the number of diseased vs. healthy colonies, pooled for the two sheltered and two exposed sites at Lizard Is., among the five scleractinian families in summer 2003 were tested using a χ2 homogeneity test. 3.3.2 Results of Large-Scale AIMS LTMP Surveys 3.3.2.1 Patterns in the Distribution and Abundance of Black Band Disease BBD is widespread throughout the GBR, occurring in all six sectors and all three cross-shelf locations. There were only three regions (mid-shelf Cooktown/Lizard Is., inner-shelf Cairns, and outer-shelf Townsville), of the 15 surveyed, in which BBD was not detected in any of the surveys.However,in any one year,BBD was recorded on a maximum of 2.5% of transects (n=720) from a maximum of 47% of regions (n=15). The abundances of BBD were too low to allow formal analysis of change, however, the number of colonies infected by BBD did not appear to change markedly between 1998 and 2003 (Fig. 3.3), infections occurring on 0.04–0.47 colonies per reef in any given year. The highest occurrence of BBD was a total of 22
n Fig. 3.3. Mean abundance (±SE) of black band disease (BBD) in survey years between 1998 and 2003. Histograms represent the mean of the total number of cases of BBD (±SE) in the 1500-m2 area surveyed on each of the n=48 reefs per survey season
3. Coral Disease on the Great Barrier Reef
83
cases across all reefs in 2002/2003. Thus, despite its widespread distribution, the general abundance of BBD has been very low and stable, for the last 5 years. 3.3.2.2 Patterns in the Distribution and Abundance of White Syndrome Abundance of WS In contrast to the stable abundance of BBD over the past 5 years, white syndrome has increased 20-fold (Fyear=52.12, df=4, P