mélanges binaires, jusqu'à 2000 bar sont utilisées. Les résultats des corrélations et des prédictions sont présentés pour l'équation de Peng-Robinson translatée ...
copyright C 1998, Institut Français du Pétrole
CORRELATION AND PREDICTION OF PHASE EQUILIBRIA AND VOLUMETRIC BEHAVIOUR OF HYPERBARIC BINARY FLUIDS S. K. STAMATAKI*, K. G. MAGOULAS, C. J. BOUKOUVALAS and D. P. TASSIOS
CORRƒLATION ET PRƒDICTION DES ƒQUILIBRES DE PHASES ET DU COMPORTEMENT VOLUMƒTRIQUE DE FLUIDES HYPERBARES BINAIRES.
National Technical University of Athens1
La capacitŽ des Žquations d'Žtat (EoS) cubiques pour corrŽler et prŽdire les Žquilibres de phases en conditions hyperbares est analysŽe. Les donnŽes PVT de corps purs ainsi que les donnŽes d'Žquilibres liquide-vapeur (VLE) et volumŽtriques pour des mŽlanges binaires, jusqu'ˆ 2000 bar sont utilisŽes. Les rŽsultats des corrŽlations et des prŽdictions sont prŽsentŽs pour l'Žquation de Peng-Robinson translatŽe et modifiŽe (t-mPR), ainsi que pour les mod•les EoS/GE. Les performances des EoS cubiques avec un param•tre d'interaction unique (kij) pour dŽcrire les VLE est remarquable si l'on consid•re le niveau des pressions pris en compte. Il en va de m•me pour les rŽsultats PVT, y compris les volumes relatifs liquides pour le syst•me C1/nC24. Avec des erreurs typiquement de 10 %, des Žcarts en pression de 100-200 bar sont bien entendu obtenus, ceux-ci pouvant •tre ŽliminŽs par l'utilisation d'un second coefficient d'interaction dans la r•gle de mŽlange pour le covolume. Les valeurs de kij tirŽes de corrŽlations gŽnŽralisŽes dŽveloppŽes ˆ partir des donnŽes VLE ˆ basse pression conduisent ˆ des rŽsultats raisonnables pour les syst•mes avec des hydrocarbures jusqu'au nC16, m•me aux pressions ŽlevŽes, mais conduisent ˆ des Žchecs pour les syst•mes plus asymŽtriques. La translation de volume est essentielle pour la qualitŽ des prŽdictions PVT. La translation indŽpendante de la tempŽrature de l'Žquation t-mPR, ainsi que celle de Jhaveri et Yougren, donnent de tr•s bons rŽsultats. La mŽthode LCVM fournit les meilleurs rŽsultats parmi les mod•les EoS/GE ŽtudiŽs, et donne de tr•s bonnes prŽdictions pour les syst•mes plut™t symŽtriques, lesquelles deviennent de moindre qualitŽ pour les syst•mes asymŽtriques aux pressions tr•s ŽlevŽes.
CORRELATION AND PREDICTION OF PHASE EQUILIBRIA AND VOLUMETRIC BEHAVIOUR OF HYPERBARIC BINARY FLUIDS (1) Laboratory of Thermodynamics and Transport Phenomena, Department of Chemical Engineering, * Department of Mining and Metallurgy, 9, Heroon Polytechniou Str., Zographou Campus, 15780 Athens - Greece
The capabilities of cubic Equations of State (EoS) in the correlation and the prediction of phase equilibria at hyperbaric conditions is examined. PVT data of pure compounds as well as VLE and volumetric data of binary mixtures up to 2000 bar are used.
REVUE DE L’INSTITUT FRANÇAIS DU PÉTROLE VOL. 53, N° 1, JANVIER-FÉVRIER 1998
59
CORRELATION AND PREDICTION OF PHASE EQUILIBRIA AND VOLUMETRIC BEHAVIOUR OF HYPERBARIC BINARY FLUIDS
Correlation and prediction results are presented with the translated and modified Peng-Robinson (t-mPR) EoS and EoS/GE models.
INTRODUCTION
The performance of cubic EoS with a single interaction parameter (kij) in describing VLE is remarkable considering the level of pressures involved. The same is valid for the PVT results including the relative liquid volumes of the C1/nC24 system. With typical errors of about 10% deviations in pressure of 100-200 bar are, of course, encountered which can be eliminated by the use of second interaction coefficient in the covolume combining rule.
In the last few years as higher depths are explored by drilling (down to approximately 7000 m) wider ranges of temperature (up to 250°C) and pressure (up to 1200 bars) are met in practice. Arnaud et al. (1995) have illustrated the increasing number of oil and gas fields that have been discovered in several regions around the world at such extreme conditions. Especially in the European section high pressure-high temperature gas condensate reservoirs are considered as an important upcoming fossil fuel resource and are anticipated to have a substantial contribution in the future oil and gas production. Reservoir fluids at such conditions are commonly referred to as hyperbaric fluids. They consist of methane (greater than 40% in mole fraction) and high amounts of heavy hydrocarbons mainly n-alkanes. They exhibit gas condensate behavior at high temperatures but they can become oils at moderate ones because of the presence of heavier compounds. Some of these methane-rich fluids are near critical as well. At lower temperatures, 10-30°C, crystallization of heavy hydrocarbons has also been observed. Experimental data in the open literature are very limited (basically only the C 1/nC24 binary has been fully investigated) and the capabilities of the cubic EoS, used for low pressure reservoir fluids modeling, in the field of hyperbaric fluids are not known. It is recognized that the generation of consistent, high quality experimental data of simple and complex (real) fluids, combined with the development of versatile thermodynamic models and computational tools for the prediction of their properties, provide the proper approach in the deep understanding of the physical status of these fluids and in the improvement of the technology related to their optimal treatment. We concentrate in this study on the thermodynamic modeling aspects of this endeavor and consider the traditional tool used in conventional reservoir conditions, i.e. cubic EoS. More specifically we examine: The capabilities and the limitations of the translated and modified Peng-Robinson (t-mPR EoS) in the: • Correlation of VLE data with – a single interaction parameter (kij); – two parameter mixing rules (kij and lij as well as linearly pressure-dependent kij).
Predicted kij values obtained from generalized correlations developed from low pressure VLE data provide reasonable results for systems with hydrocarbons up to nC16 even at high pressures, but fail for higher asymmetric ones. Volume translation is essential for PVT predictions. The temperature independent translation of t-mPR and that of Jhaveri and Yougren give very satisfactory results. LCVM provides the best results of the EoS/G E models studied and gives very good predictions for rather symmetric systems which become poorer with asymmetric ones at very high pressures.
CORRELACIîN Y PREDICCIîN DE LOS EQUILIBRIOS DE FASES Y DEL COMPORTAMIENTO VOLUMƒTRICO DE FLUIDOS HIPERBçRICOS BINARIOS Se analiza en este art’culo la capacidad de las ecuaciones de estado (EoS) cœbicas para la correlaci—n y predicci—n de los equilibrios de fase en condiciones hiperb‡ricas. Se utilizan para ello los datos PVT de cuerpos puros, as’ como tambiŽn los datos de los equilibrios l’quido-vapor (VLE) y volumŽtricos para las mezclas binarias, hasta una presi—n de 2000 bar. Se presentan los resultados de estas correlaciones y predicciones para la ecuaci—n de Peng-Robinson transferida y modificada (t-mPR), as’ como para los modelos EoS/GE. Los resultados de los EoS cœbicos con un par‡metro de interacci—n œnico (kij) para describir los VLE son destacados si se considera el nivel de las presiones tenidas en cuenta. Lo mismo ocurre al tratarse de los resultados PVT, e inclusive los volœmenes relativos l’quidos para el sistema C1/nC24. Con errores t’picamente expresados de un 10 %, las variaciones de presi—n de 100-200 bar se obtienen, naturalmente, diferencias que se pueden eliminar por la utilizaci—n de un segundo coeficiente de interacci—n en la regla de mezcla para el covolumen. Los valores de kij derivados de correlaciones generalizadas desarrolladas tomando como punto de partida los datos VLE a baja presi—n, conducen a resultados razonables para los sistemas con hidrocarburos hasta nC16, incluso con presiones elevadas, pero en cambio, conducen a fracasos para los sistemas m‡s asimŽtricos. La transferencia de volumen resulta primordial para la calidad de las predicciones PVT. La transferencia independiente de la temperatura de la ecuaci—n t-mPR, as’ como de aquella de Jhaveri y Yougren, permiten obtener resultados muy correctos. El mŽtodo LCVM permite conseguir los mejores resultados entre los modelos. EoS/GE estudiados y da buenos resultados en cuanto a las predicciones para los sistemas m‡s bien asimŽtricos, los cuales pasan a ser de menor calidad para los sistemas asimŽtricos que trabajan con presiones m‡s elevadas.
REVUE DE L’INSTITUT FRANÇAIS DU PÉTROLE VOL. 53, N° 1, JANVIER-FÉVRIER 1998
60
CORRELATION AND PREDICTION OF PHASE EQUILIBRIA AND VOLUMETRIC BEHAVIOUR OF HYPERBARIC BINARY FLUIDS
TABLE 1 Data base
System
Pressure range (bar)
Temperature range (K)
Type of data
Reference
27-489 27-706 4-893 20-1040 164-853 20-998 84-2137 49-490
320-432 288-363 303-370 315-453 374.1 305-413 321-434 373-423
x,T,P (BP) x,T,P (BP) x,T,P (BP) x,T,P (BP) x,T,P (BP) x,y,T,P (BP) x,T,P (BP) x,T,P (BP)
de Leeuw et al., 1992 Glaser et al., 1985 Van der Kooi et al., 1995 Floter et al., 1997 Arnaud et al., 1995 Legret et al., 1981 de Leeuw et al., 1992 IUPAC, 1982
201-1100 201-1100 86-690 159-690 124-690 27-690 201-853.2 163-836
374.1 374.1 344, 511 344,455 344,511 344, 511 374.1 388.5
T,P,V T,P,V x,T,P,V (IF) x,T,P,V (IF) x,T,P,V (IF) x,T,P,V (IF) x,T,P,Vmix,V1 (IF) x,T,P,Vmix,V1 (IF)
Arnaud et al., 1995 Arnaud et al., 1995 Reamer et al., 1958 Reamer et al., 1958 Reamer et al., 1942 Reamer et al., 1942 Arnaud et al., 1995 Bjorlykke and Firoozabadi, 1990
VLE C1/nC14 C1/nC16 C1/nC20 C1/nC24 (1) C1/nC24 (2) N2/nC7 N2/nC14 N2/nC16 PVT C1 nC24 C1/nC4 C1/cC6 C1/nC10 C2/nC10 C1/nC24 (oil) C1/nC24 (gas)
IF: isothermal flash. BP: bubble point.
1 CORRELATION AND PREDICTION RESULTS: VLE
• Prediction of the VLE behavior using – predicted from generalized correlations kij’s; – three EoS/GE models (LCVM, MHV2, PSRK). • Prediction of the PVT behavior of pure compounds and binary mixtures. The data base used for this purpose is presented in Table 1 and includes pure compounds and binary mixtures. Tc, Pc and w values for all compounds are obtained from DIPPR (Daubert and Danner, 1985), while the sets of predicted Tc, Pc and w values for the nC24 considered in this study are presented in Table 2.
Table 3 presents correlation and prediction results for the systems of this study. Typical ones are presented in Figures 1 to 12. The following comments summarize our observations on the obtained results. The performance of cubic EoS with a single kij in the correlation of VLE data is, even at hyperbaric conditions, remarkable taking into account the level of the pressures involved as suggested by the typical phase envelope of Figure 3. In general, for the systems considered in this study, average deviations in pressure less than about 10% have been obtained as shown in Table 3. Furthermore, no failure appeared even at very high pressures or in the cases of asymmetric systems. More specifically: – For systems at relatively low pressures, say up to 500 bars, (C1/nC14, N2/nC16) the results are, as expected, very good (Figs. 1 and 2) with typical average deviation of about 3%.
TABLE 2 Tc, Pc, and w values of nC24 estimated by different sources nC24
Source Magoulas et al., 1990 Del Sordo, 1994 Teja et al., 1990 (w from K-L) Twu et al., 1984 (w from K-L)
Tc (K)
Pc (bar)
w
802.7 802.5 809.9 804.4
18.97 10.10 10.49 19.29
1.0390 1.0488 1.0029 1.0125
REVUE DE L’INSTITUT FRANÇAIS DU PÉTROLE VOL. 53, N° 1, JANVIER-FÉVRIER 1998
61
CORRELATION AND PREDICTION OF PHASE EQUILIBRIA AND VOLUMETRIC BEHAVIOUR OF HYPERBARIC BINARY FLUIDS
500
500 C1/nC14 358 K
N2/nC16 373 K
300
300 P (bar)
400
P (bar)
400
200
200
100
100 Exp. Pts t-mPR/kij (corr.)
Exp. Pts t-mPR/kij (corr.)
0
0 0.0
0.2
0.4
0.6
0.8
1.0
0.0
0.1
0.2
X1
0.3
0.4
0.5
X1
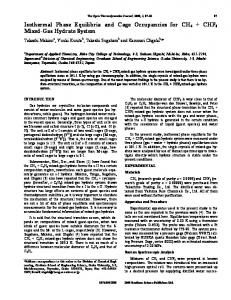
Figure 1
Figure 2
Correlation results for the bubble point pressures of the system C1/nC14 at 358 K (de Leeuw et al., 1992) with t-mPR and kij.
Correlation results for the bubble point pressures of the system N2/nC16 at 373 K (IUPAC, 1982) with t-mPR and kij.
800
15
Exp. Pts t-mPR/kij (= 0.0441) t-mPR/kij + Iij (= 0.0106, 0.0387) t-mPR/kij (= 0.11832 - 0.0003145 * P) LCVM
700
600
kij (= 0.1664) kij , Iij (= 0.10172, 0.02532) kij = f(P) (= 0.21529 - 0.00022412 * P)
10
5 Error in P (%)
P (bar)
500
400
0
300 -5
200 -10
100
N2/nC14 376 K
N2/nC7 376 K 0
-15
0.0
0.2
0.4
0.6
0.8
1.0
0
250
X1
500
750
1000
1250
1500
P (bar)
Figure 3
Figure 4
Correlation and prediction of the bubble point pressures of the system N2/nC7 at 376 K (Legret et al., 1981). Correlation with t-mPR/kij, kij + lij, kij = f(P). Prediction with the LCVM model.
Percent error in the bubble point pressures of the system N2/nC14 at 376 K (de Leeuw et al., 1992). Correlation with t-mPR/kij, kij + lij, kij = f(P).
REVUE DE L’INSTITUT FRANÇAIS DU PÉTROLE VOL. 53, N° 1, JANVIER-FÉVRIER 1998
62
1750
CORRELATION AND PREDICTION OF PHASE EQUILIBRIA AND VOLUMETRIC BEHAVIOUR OF HYPERBARIC BINARY FLUIDS
– For systems at pressures exceeding the 500 bars larger deviations up to about 20% are observed. Typical error distribution versus pressure are presented in Figures 4 and 5 and indicate that these errors are encountered in both high and low pressure range.
Arnaud et al. (1995) used the following procedure for determining the kij and lij values from their VLE and PVT data: kij from the VLE data and lij from the excess volume data. It is interesting to note that this set does not sacrifice the description of their VLE data since it is the same as the one obtained here by correlating them (Fig. 8). Both sets of kij and lij give satisfactory predictions of the VLE data for the same system but at temperature 50 K lower (Floter et al., 1997) as shown in Figure 9. This suggests that kij and lij for C1/HC systems may not very sensitive to temperature, at least for reasonable temperature ranges. The same conclusion was reached by Kordas et al. (1995) from the correlation of low pressure VLE data, however. The uncertainty in the predicted Tc, Pc and w values for nC24 is apparent from Table 2 where values from several correlations are presented. The more pronounced difference among the correlations for Pc as compared to that for Tc is not surprising. Experimental values for Pc are available only up to nC12 while for Tc up to nC18 plus nC24. For the latter Nikitin et al. (1994) suggest an uncertainty of 1%. Eventhough such differences are absorbed in the correlation of VLE data, especially the two parameter case, they do effect the prediction results of the vapor pressure as shown in Figure 10 for nC24 and, consequently, they may affect negatively multicomponent predictions. Of the three commonly used EoS/GE models: LCVM, MHV2 and PSRK, only the first one provides satisfactory results where Tc, Pc and w values are available including also the very high pressure data for the N2/nC14 (Figs. 3, 11 and 12). For more asymmetric systems (Fig. 5), however, increasing errors appear with increasing pressure. The MHV2 and PSRK models fail as shown with the typical results of Figures 11 and 12.
TABLE 3 VLE correlation and prediction results. VLE correlation results with the t-mPR EoS using one interaction parameter (kij), two interaction parameters (kij + lij) and one interaction parameter as linear function of pressure (kij = f(P)). VLE prediction results with t-mPR and one interaction parameter (kij) obtained from Kordas et al., 1995 for C1/HC and from Avlonitis et al., 1994 for N2/HC, and LCVM (Boukouvalas et al., 1994). Results
Correlation
Prediction
AAE in saturation pressure (%) System C1/nC14 C1/nC16 C1/nC20 C1/nC24 (Arnaud et al.) C1/nC24 (Floter et al.) N2/nC7 N2/nC14 N2/nC16
kij
kij+lij
kij=f(P)
kij
LCVM
1.2 4.7 10.9 6.7 12.6 8.5 9.9 5.3
0.9 3.6 3.8 4.3 4.3 1.3 2.5 1.0
0.8 4.2 9.9 6.5 9.3 2.1 2.4 2.0
1.2 5.1 14.7* failed 11.6* 23.7 9.9 5.4
9.1 4.5 10.2 10.9 16.8 4.6 8.6 5.0
* 7 points rejected
Use of predicted from generalized correlations kij values (Kordas et al., 1995) for C1/HC and Avlonitis et al. (1994) for N2/HC) gives reasonable results, equivalent to those obtained from correlation, for systems with hydrocarbons up to nC16 as shown in Table 3. For highly asymmetric ones such as C1/nC20 and C1/nC24, however, are totally unacceptable (Table 3 and Fig. 5). For example, the predicted kij value for C1/nC20 is –0.04 (Kordas et al., 1995) and the correlated, from high pressure VLE data, one is 0.06. There is a significant dependency of kij on pressure for both C1/HC and N2/HC mixtures which increases as the asymmetry of the system increases (Figs. 6 and 7). For C1/HC it appears to increase with P in a polynomial fashion while for the N2/HC ones a decrease with P in a linear fashion is observed. Use of a linearly depending on pressure kij, as suggested by Mohamed and Holder (1987) gives, consequently, good results for N2/HC but not for C1/HC (Figs. 3 and 4 and Fig. 5 respectively). Use, on the other hand, of kij and lij leads to very satisfactory results except in the neighborhood of the critical (Fig. 3 to 5).
2 PREDICTION RESULTS: PVT 2.1 Pure compounds Table 4 presents the volumetric predictions with t-mPR for C1 and nC24 when the different values of the volume translation, also given in Table 4, are used. Notice that: – The translation is useful not only for the liquid nC24 but also for the gaseous C1, where it reduces the
REVUE DE L’INSTITUT FRANÇAIS DU PÉTROLE VOL. 53, N° 1, JANVIER-FÉVRIER 1998
63
CORRELATION AND PREDICTION OF PHASE EQUILIBRIA AND VOLUMETRIC BEHAVIOUR OF HYPERBARIC BINARY FLUIDS
40
0.08
kij (= 0.0581) kij , Iij (= 0.06871, - 0.01890) kij = f(P) (= 0.05100 + 0.00001499 * P) LCVM kij (= -0.0341 from Kordas et al., 1995)
30
20
0.06
0.04
kij
Error in P (%)
10
0
0.02
-10 0.00 -20 -0.02
C1/nC16 at 351 K C1/nC20 at 353 K C1/nC24 at 374 K
-30 C1/nC20 353 K -40
-0.04 0
100
200
300
400
500
600
700
800
0
100
200
300
400
P (bar)
500
600
700
800
900
P (bar)
Figure 5
Figure 6
Percent error in the bubble point pressures of the system C1/nC20 at 353 K (van der Kooi et al., 1995). Correlation and prediction results.
Optimum kij versus pressure for various C1/HC systems.
1100
0.30
Exp. Pts t-mPR/kij + Iij (= 0.0511, -0.019, corr.) PR/kij + Iij (= 0.0532, -0.022, Arnaud et al., 1995)
1000 0.25
900 800
0.20
P (bar)
kij
700 0.15
600 500
0.10
400 300
0.05
200
N2/nC7 at 373 K N2/nC14 at 376 K
C1/nC24 374 K (Arnaud et al., 1995)
100
0.00 0
250
500
750
1000
1250
1500
0.5
1750
0.6
0.7
0.8
0.9
X1
P (bar)
Figure 7
Figure 8
Optimum kij versus pressure for various N2/HC systems.
Correlation results for the bubble point pressures of the system C1/nC24 at 374 K (Arnaud et al., 1995).
REVUE DE L’INSTITUT FRANÇAIS DU PÉTROLE VOL. 53, N° 1, JANVIER-FÉVRIER 1998
64
1.0
CORRELATION AND PREDICTION OF PHASE EQUILIBRIA AND VOLUMETRIC BEHAVIOUR OF HYPERBARIC BINARY FLUIDS
error from 7% to 0.6% using the generalized correlation for t, or to 0.5% using the t value obtained by fitting the experimental data. – The t-mPR without translation gives the same results as the PR EoS. – The Tc, Pc and w set used for nC24 has a significant effect on the obtained results.
for C1/nC24 has been used in these calculations. It is expected that the incorporation of a second interaction parameter lij in the covolume combing mixing rule can improve the obtained predictions. In both cases, gas and oil system, the effect of translation factor (t) on the prediction of the PVT behavior is examined. To this purpose, t values derived from: – correlations of Vs1 pure compound data up to nC20 such as those of t-mPR (Eq. (A3) of Appendix) and of Jhaveri and Yougren, 1984 (Eq. (A6) and (A7) of Appendix); – and high pressure PVT data for nC24 of Arnaud et al. have been utilized and are presented in Table 4. Prediction results shown in Figures 13 and 14 indicate that although volume translation values for nC24 differ by as much as 20% they have a small effect on the prediction of the relative liquid volumes. The generalized expression of t0 (Eq. (A3) of Appendix) coupled with the t-mPR EoS performs quite well for both gas and oil system as compared to the values derived by fitting high pressure PVT data for nC24 and C1.
TABLE 4 Prediction of the PVT behavior of C1 and nC24 with t-mPR. The volume translation values given by Arnaud et al. (1995) have been obtained by fitting their high pressure PVT data with PR EoS and Tc, Pc and w values obtained from Del Sordo (1994). The other values are obtained from the generalized correlations presented in Appendix, with the different sets of Tc, Pc and w values. C1 t (cm3/mole)
nC24 AAE (%)
Tc, Pc, w
t (cm3/mole) Method
Value
AAE (%)
C B
0.0 –4.461 –4.965
7.0 0.7 0.5
A D A D D
– – C C B
0.0 0.0 126.77 112.56 106.84
40.2 24.8 10.7 1.5 0.7
A
0.0 –4.732
6.8 0.6
A D A D
– – A A
0.0 0.0 143.61 129.56
40.2 24.8 12.7 0.5
CONCLUSIONS The performance of cubic EoS with a single interaction parameter (kij) in describing VLE is remarkable considering the level of pressures involved. However, the extend to which this approach will be sufficient for hyperbaric fluids remains to be seen as more experimental data, especially for synthetic hyperbaric fluids, will become available. Use of a second interaction parameter lij in the covolume combining rule, provides overall better results but it still suffers in the neighborhood of critical. Eventhough it appears that a two parameter (kij and lij) mixing rule is more effective for the successful correlation of high temperature-high pressure VLE, it is doubtful that this approach will be a practical solution for natural fluids. VLE prediction results with kij values from generalized correlations developed from low pressure VLE data are satisfactory at high pressure region for binary systems with hydrocarbons up to nC16. For high asymmetric ones such as C1/nC20 and C1/nC24 predicted kij values are totally unacceptable and suggest the use of high pressure binary VLE data to derive proper values.
A: Magoulas and Tassios (1990); B: Arnaud et al. (1995); C: Jhaveri and Yougren (1985); D: Del Sordo (1994).
2.2 Binary mixtures Table 5 presents PVT results for several binary systems. Excellent results are obtained through correlation with T-independent kij as well as prediction using kij from generalized correlations and LCVM. Also, satisfactory results are obtained for the more difficult C1/nC24 hyperbaric gas system of Bjorlykke and Firoozabadi (1990) and for the C1/nC24 hyperbaric oil system of Arnaud et al. (1995) as shown in Figures 13 and 14 respectively. The performance of the cubic EoS in the prediction of the relative liquid volumes through an isothermal pressure decrease is very satisfactory for the case of oil system (Fig. 14). It also remarkable enough for the case of gas condensate system where the obtained maximum deviation of 10% can be considered reasonable (Fig. 13). A single interaction parameter (kij) obtained from the correlation of the aforementioned VLE data
REVUE DE L’INSTITUT FRANÇAIS DU PÉTROLE VOL. 53, N° 1, JANVIER-FÉVRIER 1998
65
CORRELATION AND PREDICTION OF PHASE EQUILIBRIA AND VOLUMETRIC BEHAVIOUR OF HYPERBARIC BINARY FLUIDS
15
10
t-mPR/Magoulas et al. t-mPR/Del Sordo t-mPR/Teja et al. t-mPR/Twu et al.
kij = 0.0532, Iij = -0.022 (Arnaud et al., 1995) kij = 0.0511, Iij = -0.019 (this work) 5
Error in vapor pressure (%)
10
Error in P (%)
0
-5
-10
5
0 -15 C1/nC24 323 K (Floter et al., 1997) -20
-5 0
200
400
600
800
1000
1200
10-3
10-2
P (bar)
10-1
Vapor pressure (bar)
Figure 9
Figure 10
Percent error in the bubble point pressures of the system C1/nC24 at 323 K (Floter et al., 1997). Prediction results.
Percent error in predicted vapor pressure values with t-mPR for nC24 using the four different sets of Tc, Pc and w values.
800
2500
700
Exp. Pts t-mPR/kij , Iij LCVM PSRK
xN = 0.6970 2
2250
x1 = 0.9620
2000 600 1750 xN = 0.4990
500
400
P (bar)
P (bar)
Exp. Pts LCVM PSRK MHV2 kij = 0.0454, kij = -0.0038
2
1500
1250
300 1000 x1 = 0.4970 200
750
C1/nC16
N2/nC14 100
500 310
320
330
340
350
360
370
300
T (K)
350
400 T (K)
Figure 11
Figure 12
Correlation and prediction of the bubble point pressures of the system C1/nC16 (Glaser et al., 1985). Correlation with t-mPR/kij + lij. Prediction with the LCVM, PSRK and MHV2 models.
Correlation and prediction of the bubble point pressures of the system N2/nC14 (de Leeuw et al., 1992). Correlation with t-mPR/kij + lij. Prediction with the LCVM, and PSRK models.(The prediction results with PSRK for the 0.6970 isopleth are not included due to large deviations).
REVUE DE L’INSTITUT FRANÇAIS DU PÉTROLE VOL. 53, N° 1, JANVIER-FÉVRIER 1998
66
450
CORRELATION AND PREDICTION OF PHASE EQUILIBRIA AND VOLUMETRIC BEHAVIOUR OF HYPERBARIC BINARY FLUIDS
TABLE 5 Correlation and prediction results of PVT for binary mixtures AE in V (%) (1)/(2)
T (K)
P (bar)
x1
t-mPR (corr.)
t-mPR (pred.)
LCVM
344.26
86.2-689.5 139.7-698.5
0.3960 0.6002
2.18 0.89
2.23 1.36
2.21 1.46
510.93
13.8-689.5 138.0-689.5
0.3960 0.6002
1.26 0.70
1.29 0.74
1.27 0.71
344.26
159.1-689.5 239.1-689.5
0.4000 0.6000
0.72 0.56
1.60 1.07
1.69 1.26
455.37
166.1-689.5 200.5-689.5
0.4000 0.6000
2.17 1.22
2.41 1.42
2.62 1.78
344.26
124.7-689.5 219.1-689.5
0.3945 0.5822
0.24 0.16
1.36 1.81
1.29 1.68
510.93
123.5-689.5 183.0-689.5
0.3945 0.5822
1.62 1.09
1.63 1.23
1.61 1.06
344.26
27.2-689.5 44.1-689.5
0.4000 0.6000
0.53 0.88
0.72* 1.03*
0.72 1.01
510.93
65.0-689.5 97.2-689.5
0.4000 0.6000
2.40 1.91
2.42* 2.02*
2.40 1.93
C1/nC4
C1/cC6
C1/nC10
C2/nC10
* kij = 0.0
V: liquid volume
100
30 Exp. Pts t-mPR Arnaud et al., 1995 Jhaveri and Yougren, 1984
25
C3/nC24
80 70 Liquid volume (%)
20 Liquid volume (%)
Exp. Pts t-mPR Arnaud et al., 1995 Jhaveri and Yougren, 1984
90
15
10
60 50 40
t (cm3/mole) 5 t-mPR t-PR (t: Arnaud et al.) t-PR (t: Jhavei and Yougren)
C1 -4.732 -4.965 -4.461
30
nC24 129.56 106.84 112.56
20 C1/nC24
0
10 100
200
300
400
500
600
700
800
900
100
200
P (bar)
300
400
500
600
700
800
P (bar)
Figure 13
Figure 14
Effect of the volume translation on the prediction of % liquid volume for the C1/nC24 system (Bjorlykke and Firoozabadi, 1990).
Effect of the volume translation on the prediction of % liquid volume for the C1/nC24 oil system (Arnaud et al., 1995).
REVUE DE L’INSTITUT FRANÇAIS DU PÉTROLE VOL. 53, N° 1, JANVIER-FÉVRIER 1998
67
900
CORRELATION AND PREDICTION OF PHASE EQUILIBRIA AND VOLUMETRIC BEHAVIOUR OF HYPERBARIC BINARY FLUIDS
and the t-mPR Equation of State. Fluid Phase Equilibria, 92, 75-106.
Also, remarkable is the performance of the cubic EoS with a single interaction parameter (kij) in the prediction of the PVT behavior of binary mixtures including the relative liquid volumes of the C1/nC24 system. Volume translation is essential for PVT predictions. It is shown that there is no need for high pressure pure compound PVT data to obtain proper volume translation values generalized expressions for translation factor estimation such as the temperature independent translation of t-mPR and that of Jhaveri and Yougren give very satisfactory results. Of the EoS/GE models considered, LCVM gives very successful predictions for rather symmetric systems which become poorer with asymmetric ones at very high pressures.
Daubert T.E. and Danner R.P. (1985) DIPPR Data, AIChE, New York. de Leeuw V.V., de Loos Th.W., Kooijman H.A. and de Swaan Arons J. (1992) The experimental determination and modelling of VLE for binary subsystems of the quaternary system N2+CH4+C4H10+C14H30 up to 1000 bar and 440 K. Fluid Phase Equilibria, 73, 285-231. Del Sordo E. (1994) Étude de l’équation Chain of Rotators. DEA Report, École nationale supérieure des industries chimiques de Nancy (in French). Floter E., de Loos Th.W. and de Swaan Arons J. (1997) Highpressure solid-fluid and vapour-liquid equilibria in the system (methane-tetracosane). Fluid Phase Equilibria, 127, 129-146. Glaser M., Peters C.J., van der Kooi H.J. and Lichtenhaler R.N. (1985) Phase equilibria of (methane+n-hexadecane) and (p,Vm, T) of n-hexadecane. J. Chem. Thermodynamics, 17, p. 803. IUPAC (1982) Nitrogen and Air, Solubility Data Series, 10, 1st ed., Pergamon Press, Oxford.
LIST OF SYMBOLS BP Eq. () HC kij lij P Pc T t t0 Tc
Jhaveri B.S. and Yougren G.K. (1984) Tree-parameter modification of the Peng-Robinson Equation of State to improve volumetric predictions. SPE Paper 13118.
bubble point equation number hydrocarbons interaction parameter interaction parameter pressure critical pressure temperature volume translation temperature independent volume translation critical temperature.
Kordas A., Magoulas K., Stamataki S. and Tassios D. (1995) Methane-hydrocarbon interaction parameters correlation for the Peng-Robinson and the t-mPR Equation of State. Fluid Phase Equilibria, 112, 33-44. Legret D., Richon D. and Renon H. (1981) Vapor liquid equilibria up to 100 MPa: A new apparatus. AIChE Journal, 27, 2, 203. Magoulas K. and Tassios D. (1990) Thermophysical properties of n-alkanes from C1 to C20 and their prediction for higher ones. Fluid Phase Equilibria, 56, 119-140. Nikitin E.D., Pavlov P.A. and Bessonova N.V. (1994) Critical constants of n-alkanes with 17 and 24 carbon atoms. J. Chem. Thermodynamics, 26, 177-182. Reamer H.H., Olds R.H., Sage B.H. and Lacey W.N. (1942) Phase equilibria in hydrocarbon systems. Methane-decane system. Ind. Eng. Chem., 34, 12, 1526-1531.
Greek symbols w acentric factor.
Reamer H.H., Sage B.H. and Lacey W.N. (1958) Phase equilibria in hydrocarbon systems. Volumetric and phase behavior of the methane-cyclohexane system. Ind. Eng. Chem., 3, 1, 240-245.
REFERENCES
Soreide I. (1989) Improved phase behavior predictions of the petroleum reservoir fluids from a cubic Equation of State. PhD Thesis, University of Trondheim.
Arnaud J.F., Ungerer P., Behar E., Moracchini G. and Sanchez J. (1995) Improvement of EoS mixing rules from excess volume measurements. Application to the methane+n-tetracosane mixtures at 374 K. Institut français du pétrole, Report 42 492.
Teja A.S., Lee R.J., Rosenthal D. and Anselme M. (1990) Correlation of the critical properties of alkanes and alkanols. Fluid Phase Equilibria, 56, 153-169.
Avlonitis G., Mourikas G., Stamataki S. and Tassios D. (1994) A generalized correlation for the interaction coefficients of nitrogen-hydrocarbon binary mixtures. Fluid Phase Equilibria, 101, 53-68.
Twu C.H. (1984) An internally consistent correlation for predicting the critical properties and molecular weights of petroleum and coal-tar liquids. Fluid Phase Equilibria, 16, 137-150.
Bjorlykke O.P and Firoozabadi A. (1990) Measurements and computation of retrograde condensation and near-critical phase behavior. SPE Paper 20524.
Van der Kooi H.J., Floter E. and de Loos Th.W. (1995) Highpressure phase equilibria of {(1-x)CH4+xCH3(CH2)18CH3}. J. Chem. Thermodynamics, 27, 847-861.
Boukouvalas C., Spiliotis N., Coutsikos N., Tsouvaras N. and Tassios D. (1994) Prediction of vapor-liquid equilibrium with the LCVM model: a linear combination of the Vidal and Michelsen mixing rules coupled with the original UNIFAC
Final manuscript received in December 1997
REVUE DE L’INSTITUT FRANÇAIS DU PÉTROLE VOL. 53, N° 1, JANVIER-FÉVRIER 1998
68
CORRELATION AND PREDICTION OF PHASE EQUILIBRIA AND VOLUMETRIC BEHAVIOUR OF HYPERBARIC BINARY FLUIDS
APPENDIX
dependent on the component of interest. This factor is determined as s = c/b, where b is the covolume parameter of the EoS and c is the correction of the volume that is given by the EoS (V = VEoS – c). The s values up to nC6 are obtained by matching the experimental molar volumes at Tr = 0.7 of the pure compound and they are presented in the next table:
The t-mPR The t-mPR involves a single expression for m = f(w) which covers the whole range of w values. It provides similar Ps results with a PR EoS but improved ones at low Ps levels. m = 0.384401 + 1.52276w – 0.213808w2 + 0.034616w3 – 0.001976w4
Compound
(A1)
CH4 C2H6 C3H8 i-C4H10
It also provides successful liquid volumes through the following translation expression: t = t0 + (tc - t0) exp(b |1 – Tr|)
tc =
RTc Pc
(0.3074 – Zc )
Compound
–0.15400 –0.10020 –0.08501 –0.07935
s
n-C4H10 i-C5H12 n-C5H12 n-C6H14
–0.06413 –0.04350 –0.04183 –0.01478
(A2) For supercritical CH4, the proposed by Ingolf Soreide (1989), expression is used:
where: RTc t= (– 0.014471 + 0.067498w – 0.084852w 2 Pc (A3) + 0.067298w 3 – 0.017366w 4) b = – 10.2447 – 28.6312w
s
s = – 0.037*Tr – 0.094
(A6)
For larger hydrocarbons, the following expression is used: d (A7) s= 1– MW e
(A4) (A5)
where MW is the molecular weight. Values for d, e are given in the next table:
The volume translation of Jhaveri-PR Jhaveri and Yougren (1984), based on PR EoS, suggested a dimensionless correcting factor s, that is
Compound
d
e
n-alkanes napthenics aromatics
2.258 3.004 2.516
0.1823 0.2324 0.2008
REVUE DE L’INSTITUT FRANÇAIS DU PÉTROLE VOL. 53, N° 1, JANVIER-FÉVRIER 1998
69