Rana Mohammed Al-Kahdaar/ Assistant Lecturer ... south wards from Ammarah as far as Zubair and Nahr Omar (Buringh, 1960) as shown in figure (2). ... In (1982) Abdel-Rahman has made correlation between index tests and the engineering.
Number 4
Volume 16 December 2010
Journal of Engineering
CORRELATIONS BETWEEN PHYSICAL AND MECHANICAL PROPERTIES OF AL-AMMARAH SOIL IN MESSAN GOVERNORATE Rana Mohammed Al-Kahdaar/ Assistant Lecturer Abbas Fadhil Ibrahim Al-Ameri /Assistant Lecturer
ABSTRACT: This paper describes the geotechnical properties of Al-Ammarah soil of Ammarah city in Messan Governorate-southern parts of Iraq. Data and other information taken from numbers of geotechnical reports that performed under the supervision of Consulting Engineering Bureau of Baghdad University. This research is devoted to study the correlation between different physical properties such as (LL, PI, LI, n,t, e) with different mechanical properties such as (qu, cc, cs, SPT). The correlation is verified using simple regression analysis. From the regression results it was found that there is direct correlation between different parameters. By using the correlation-with some information- preliminary investigation stages and studies of any structure can be performed to find indicative design parameters. :الخالصة في هذا البحث تم االستفادة من.تم في هذا البحث وصف الخصائص الهندسية لتربة مدينة العمارة في محافظة ميسان
المعمومات والبيانات المتوفرة من التقارير الصادرة من مكتب األستشارات الهندسية التابع لجامعة بغداد واألستفادة منها في تخمين
) باستخدامqu, cc, cs, SPT( ) والخصائص الميكانيكيةLL, PI, LI, n ,t, e( بعض العالقات بين الخصائص الفيزيائية أن هذه العالقات مهمة في مرحمة الدراسة والتخطيط والتصميم االولي الي منشأ وبأستخدام هذه العالقات يمكن.التحميل األحصائي .اعطاء مجموعة من المعامالت الخاصة بالتصميم دون الحاجة الجراء تحريات تربة تفصيمية KEY WORDS: Ammarah city, Liquidity index, Plasticity index, Unconfined compressive strength, Natural water content, simple regression. NTRODUCTION: Ammarah city is a land which subjected periodically to erosion and accumulated fluctuation of the sea. The thickness of sediments that consists of clayey silt to silty clay is about (150-200)m. The bearing capacity at shallow depth is ranging from (6-8) ton/m2, the area imposes high water table 5946
R.M. Al-Kahdaar A. F. I. Al-Ameri
Correlations between Physical and Mechanical Properties of Al-Ammarah Soil in Messan Governorate
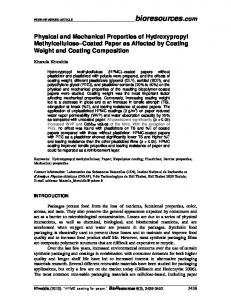
between (1-3)m below nature ground level. In general the area consist of an erratic distribution of the layers at shallow depth. This is may be attributed to the nature of the area which can be described as a recent sediments (Buringh, 1960). This study use geotechnical properties of Ammarah soil from about 40 boreholes taken at different locations within Ammarah city as shown in Figure (1). All data was taken from geotechnical reports performed by the CEB. Some of these reports and investigations were made by or under the supervision of the researchers. Any unusual data and test results have been excluded from the analysis. The statistical analysis was made using simple regression analysis using Microsoft office software.
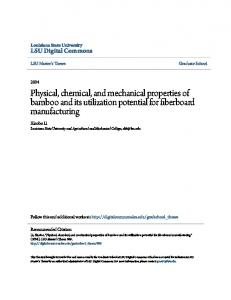
GEOLOGY OF MISSAN Millions of years ago, Iraq was laying in a large hollow part of the surface called the Tethgs geosyncline. It was submerged by the sea and bordered by plateaus and tablelands. The youngest geological process is the sedimentation of fines material of loamy sand, silt and clay in the extensive lower Mesopotamia plain, a process which still continuous at present time. The surface of the area covered with recent of flood plain deposit by Tigris with some sediments came by air as dust during the end of spring and the beginning of summer. The recent sediment is of silt clay, and some fine sand. The light minerals consists of carbonate (20% - 30%) quarts, Albite, clay minerals as montmorllionite and some gypsum and halite because of arid climate of AlAmmarah. Because of an advantages geographic position and morphological situation the basin of the Mesopotamia plain was most probably subjected to periodically repeating phases of accumulation and erosion in accordance with the periodical fluctuations of the sea level caused by the cyclic changes during Pleistocene. The thickness of the sediments is about (150-200)m. Marine in layers were described at Hammar formations. The formation is composed of sand and silts in its lower part and clay in the upper part. The formation is up to 20m thick and is distributed south wards from Ammarah as far as Zubair and Nahr Omar (Buringh, 1960) as shown in figure (2).
5947
Number 4
Volume 16 December 2010
Journal of Engineering
Figure (1) Administrative Map of Al-Ammarah city.
Figure (2) Geological Map of Iraq
5948
R.M. Al-Kahdaar A. F. I. Al-Ameri
Correlations between Physical and Mechanical Properties of Al-Ammarah Soil in Messan Governorate
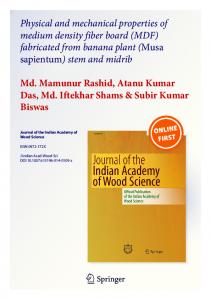
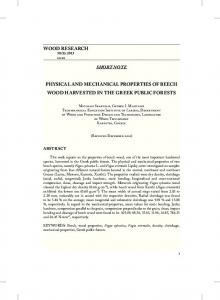
PREVIOUS WORK In the last decay, many research was performed to correlate the physical properties with the mechanical properties. This approach was adopted for the purpose of time saving and reduce cost of investigations. This approach was adopted from the earlier researcher in the filed of soil mechanics and foundation engineering. Some of these correlations are listed in Bowles (1996). However, the following are some of the present works. In (1982) Abdel-Rahman has made correlation between index tests and the engineering properties of Egyption clay from different locations along the Nile valley and Delta. In (1994) Khamehchiyan and Iwao studied the properties of Ariak soft clay (the most problematic soil in Japan). They made intensive study on its geotechnical properties and make a correlations between physical and mechanical properties with simple regression and multiple regression analysis in spite of the simple regression were enough for estimating. Isik Yilmaz (2000) perform another study to evaluate the shear strength of clayey soil by using the liquidity index from various locations in Turkey. On the other hand; USDA published a data and make a correlation between soil plasticity as well as plasticity index and strength parameter (residual strength) (USDA, 2004). Al-Busoda (2009) evaluate and correlate between physical and engineering properties of Baghdad cohesive soil based on Atterberg limits and unit weight tests. GEOTECHNICAL PROPERTIES OF Al-AMMARAH SOIL. Physical Properties The collected physical and mechanicsl properties of Al-Ammarah silty clay soil is presented in Table (1). The plasticity chart is shown in Figure (3); the relation between plasticity index PI, and liquid limit LL, is shown in Figure (4). Table (1) The soil properties of Al-Ammarah soil Soil properties Physical properties: Gs Void ratio e Liquid limit Plasticity Index Liquidity Index Natural water content Total unit weight (kN/m3) Mechanical properties: SPT Unconfined compressive strength (kN/m2) Compression index Swelling index 5949
Range 2.62-2.82 0.687-0.998 22-62 5-34 0.43-2.78 10.27-39.2 18.29-20.17 3-50 44.0-296.6 0.125-0.458 0.016-0.043
Number 4
Volume 16 December 2010
Journal of Engineering
PLASTICITY CHART (ASTM D2487) 60
L U-
50
IN
E CH
OR
OH
NE LI A
Plasticity Index (PI)
40
30
20
OR
CL CL - ML
10 7 4
MH OR OH
OL
ML OR OL
0 0
10
20
30
40
50
60
70
80
90
100
110
Liquid Limit (LL)
Figure (3) The Unified Soil Classification chart for Ammarah soil.
40
PI = 0.535783 (LL -0.71) R-squared = 0.636
36
32
Plasticity Index, %
28
24
20
16
12
8
4
0 0
5
10
15
20
25
30
35
40
45
50
55
60
Liquid Limit, %
Figure (4) Relation between plasticity index and liquid limit.
From these figures it can be seen that all the cohesive soil-according to USCS-at the investigated area are clayey soil with low to high plasticity (CH to CL). To compare these results with the plasticity chart; Figure (4) was drawn. From this figure it can be seen that the fitting line can be described by the following equation: PI = 0.536 (LL-0.71)
(1)
While the equation of the A-Line is [PI = 0.73 (LL-10)]
5950
R.M. Al-Kahdaar A. F. I. Al-Ameri
Correlations between Physical and Mechanical Properties of Al-Ammarah Soil in Messan Governorate
The relation between total density and initial void ration is presented in Figure (5). The correlation for this figure can be given by the nonlinear equation with correlation coefficient of 0.811: t = 30.28 – 21.46 e + 10.17 eo2
(2)
The relation between initial void ratio e and natural water content n is given in Figure (6) and can be represented by the following equation with correlation coefficient equals 0.945. e = 0.025 n + 0.078
(3)
4.2 MECHANICAL PROPERTIES The summary of the ranges for mechanical properties of Ammarah city are presented in Table (1). Single regression analysis was adopted to obtain the relations between mechanical properties and physical properties of Ammarah city.
COMPRESSIBILITY
The variation of swelling index cs with compression index cc is presented in Figure (7) and this variation can be represented by the following equation with a correlation coefficient of 0.97. cs =0.091 cc
(4)
Equation (4) satisfies the variation of cs with cc for most clayey soils. Bowles (1996) stated that cs=0.05 to 0.10 cc. The relation between compression index cc and liquidity index LI, is shown in Figure (8). This variation can be described by the following equation with correlation coefficient of 0.61 as. cc = 0.24 LI + 0.21
(5)
In Figure (9) the relation between compression index and natural water content. This relation can be written by the following equation with correlation coefficient of 0.946. cc = 0.0092 n
(6)
The relation between swelling index and natural water content is shown in Figure (10) with a correlation coefficient of 0.975. cs = 0.00087 n
(7)
The relation between compression index and liquid limit as shown in figure (14) with coefficient of 0.868, when compared this equation with correlation equation of Terzaghi and Peck its found that the curve run above Terzaghi line. cc = 0.00556 LL
(8)
cc = 0.009 (LL-10) (Terzaghi and Peck)
(9)
5951
Number 4
Volume 16 December 2010
Journal of Engineering
21.00
Unit Weigth=30.28 - 21.46 eo + 10.17 eo^2 (R-squared) = 0.810377
20.75
20.50
Total Unit Weigth, kN/m^3
20.25
20.00
19.75
19.50
19.25
19.00
18.75
18.50
18.25 0.60
0.65
0.70
0.75
0.80
0.85
0.90
0.95
1.00
1.05
1.10
Initial Void Raio, eo
Figure (5) Relation between total unit weight and initial void ratio. 1.10
eo = 0.025 * W + 0.078 R-squared = 0.945
1.05
1.00
Initial Void Ratio, eo
0.95
0.90
0.85
0.80
0.75
0.70
0.65
0.60 20
22
24
26
28
30
32
34
36
38
40
Natural Water Content, w, %
Figure (6) Relation between initial void ratio and natural water content. 0.040
Cs = 0.091 * Cc, R-squared = 0.97
0.035
Swelling Index, Cs
0.030
0.025
0.020
0.015
0.010 0.10
0.15
0.20
0.25
0.30
0.35
0.40
0.45
0.50
Compression Index, Cc
Figure (7) Relation between swelling index and compression index.
5952
R.M. Al-Kahdaar A. F. I. Al-Ameri
Correlations between Physical and Mechanical Properties of Al-Ammarah Soil in Messan Governorate 0.50
Cc = 0.24 * LI+ 0.21 R-squared = 0.61
0.45
0.40
Compression Index, Cc
0.35
0.30
0.25
0.20
0.15
0.10
0.05
0.00 -0.4
-0.2
0.0
0.2
0.4
0.6
0.8
1.0
Liquidity Index, LI
Figure (8) Relation between Compression index and Liquidity index.
0.60
Cc= 0.00918 * W R-squared = 0.94
0.55
0.50
Compression Index, Cc
0.45
0.40
0.35
0.30
0.25
0.20
0.15
0.10
0.05
0.00 20
22
24
26
28
30
32
34
36
38
40
Water Content, %
Figure (9) Relation between compression index and natural water content.
0.050
Cs = 0.00087 * W R-squared = 0.975
0.045
0.040
Swelling Index, Cs
0.035
0.030
0.025
0.020
0.015
0.010
0.005
0.000 16
18
20
22
24
26
28
30
32
34
36
38
40
Water Content, %
Figure (10) Relation between swelling index and natural water content. 5953
Number 4
Volume 16 December 2010
Journal of Engineering
Unconfined Compressive Strength The shear strength of a soil is the internal resistance per unit area that the soil mass can offer to resist failure and sliding along any plane inside it. Therefore, the engineer should understand the nature of shearing resistance in order to analyze soil stability problems such as bearing capacity, slope stability and lateral pressure on earth retaining structures (Das, 2002). The shear strength parameters dependent on type of laboratory test, previous stress history, particle packing, grain shape and water table, one of the tests that obtained from it the shear strength helping for obtained the bearing capacity that used in design is unconfined compression test. With these considerations, from figure (11) the relation between unconfined compressive strength qu and liquidity index LI, with correlation coefficient 0.53. qu = 186.3-172.5 LI + 24.2 LI2
(10)
The relation between unconfined compressive strength to standard penetration test qu /SPT to plasticity index PI, with coefficient of 0.872 as shown in figure (12). qu/SPT = 0.186 PI
(11)
From figure (13) the relation of qu to standard penetration test SPT with coefficient of 0.898. qu = 4.24 SPT
(12)
350
Qu=186.3 - 172.5 LI + 24.2 LI^2 325
R-squared=0.53
Unconfined Compressive Strength, qu, kPa
300 275 250 225 200 175 150 125 100 75 50 25 0 -0.6
-0.4
-0.2
0.0
0.2
0.4
0.6
0.8
1.0
1.2
1.4
Liquidity Index, LI
Figure (11) Relation between unconfined compressive strength and liquidity index.
5954
R.M. Al-Kahdaar A. F. I. Al-Ameri
Correlations between Physical and Mechanical Properties of Al-Ammarah Soil in Messan Governorate
10
qu/SPT = 0.186 * PI Coef of determination, R-squared = 0.872
9
8
qu/SPT (kPa)
7
6
5
4
3
2
1
0 0
5
10
15
20
25
30
35
Plasticity Index, PI
Figure (12) Relation between unconfined compressive strength to standard penetration test and plasticity index. 350
qu = 4.24 * SPT Coef of determination, R-squared = 0.898
Unconfined Compressive Strength, qu, kPa
300
250
200
150
100
50
0 0
5
10
15
20
25
30
35
40
45
50
55
60
SPT, Number
Figure (13) Relation between unconfined compressive strength and standard penetration test.
0.50
Cc=0.00556 LL, R-squared = 0.868 0.45
Cc=0.009(LL-10) as cited in Bowles (1996)
0.40
Compression Index, Cc
0.35
0.30
0.25
0.20
0.15
0.10
0.05
0.00 20
25
30
35
40
45
50
55
60
65
Liquid Limit, LL, %
Figure (14) Relation between Compression index and liquid limit. 5955
Number 4
Volume 16 December 2010
Journal of Engineering
SUMMARY OF THE RESULT From all the correlation that connect between physical and mechanical propreties of Ammarah soil, it can be summarized in table (2):
Table (2) Summary of the correlations between physical and mechanical properties of Ammarah soil. Parameter
Equation
R2
|PI t e cs cc cc cs cc qu qu/SPT qu
PI = 0.536 (LL-0.71) t = 30.28 – 21.46 e + 10.17 eo2 e = 0.025 n + 0.078 cs =0.091 cc cc = 0.24 LI + 0.21 cc = 0.0092 n cs = 0.00087 n cc = 0.00556 LL qu = 186.3-172.5 LI + 24.2 LI2 qu/SPT = 0.186 PI qu = 4.24 SPT
0.636 0.811 0.945 0.97 0.61 0.946 0.975 0.868 0.53 0.872 0.898
Equation Figure number number 1 4 2 5 3 6 4 7 5 8 6 9 7 10 8 14 10 11 11 12 12 13
CONCLISION The soil of Al-Ammarah city is found to be clayey silt to silty clay with low to high plasticity with:
For physical properties the equation of (1-3) can be useful and easy to find plasticity index, total unit weight and initial void ratio without using and preliminary test from liquid limit, initial void ratio or natural water content.
The cost of consolidation test is high in comparison with other tests. So, the equation (48) it’s easy way and power full for estimating the compression index and swelling index.
Also, the unconfined compressive test is not always available. So, equation (10-12) consider convenient and simple for estimating the compressive strength by knowing plasticity index , liquidity index or number of drops.
The correlation equation of 4 and equation 8 is considered more convenient, simple and easy for estimating swell index and compressibility index.
LIST OF SYMBOLS cc = compressibility index. cs = swelling index. 5956
R.M. Al-Kahdaar A. F. I. Al-Ameri
Correlations between Physical and Mechanical Properties of Al-Ammarah Soil in Messan Governorate
e= initial void ratio. LI= Liquit index. LL= Liquid limit. Qu = Unconfined compressive strength. R2 = Coefficient of determination SPT = Standard compressive strength. t = Total unit weigth. n = natural water content. REFERENCES
Abdel-Rahman, G. E. (1982) “ Correlations Between index tests and the properties of Egyption Clay”. Ms.C. Thesis, college of engineering, university of Cairo.
Al-Busoda, b. S. Z. (2009) “Evaluation and correlations Associated with liquid Limit and Plasticity index of Baghdad Cohesive Soil”, The 6th Engineering Conference, Proceedings of the Conference, Civil Engineering, Volume 1.
Bowels, J.E. (1996) “ Foundation Analysis and Design”. McGraw-Hill Companies.
Buringh, P. (1960) “ Soil and condition in Iraq” Ministry of Agriculture, Baghdad.
Das, B.M. (2002) “ Principles of Geotechnical Engineering”. Fifth edition, Wadsworth Group.
Khamehchiyan, M. and Iwao, Y. (1994) “Geotechnical properties of Ariake clay in Saga Plain- Japan”. Journal of Geotechnical Engineering, No.505, V.29, PP. 11-18, December.
Rahardjo, P.P. (2007) “ In situ testing and soil properties correlations”. In conjunction with International Conference on In Situ Measurement of Soil Properties and Case Histories, Parahyangan Catholic University.
USDA, (2004) “ Correlations between soil plasticity and strength Parameters”. Advanced Engineering Geology & Geotechnics.
Yilmaz., Isik (2000) “Evaluation of shear strength of of clayey soils by using their liquidity index”. Bull Eng. Geo. Env., V. 59, P. 227-229.
5957