www.nature.com/scientificreports
OPEN
received: 06 October 2016 accepted: 28 December 2016 Published: 31 January 2017
Cortisol Awakening Response and Acute Stress Reactivity in First Nations People Maximus Berger1,2, Anthony Leicht3, Angela Slatcher2, Ann Katrin Kraeuter1,2, Sarangan Ketheesan1,2, Sarah Larkins4,5 & Zoltán Sarnyai1,2 First Nations people globally have a higher incidence of mental disorders and non-communicable diseases. These health inequalities are partially attributed to a complex network of social and environmental factors which likely converge on chronic psychosocial stress. We hypothesized that alterations in stress processing and the regulation of the hypothalamic-pituitary-adrenal axis might underlie health disparities in First Nations people. We assessed the cortisol awakening response and the dynamic response to a laboratory induced psychosocial stress of young Indigenous tertiary students (n = 11, mean age 23.82 years) and non-Indigenous students (n = 11) matched for age and gender. Indigenous participants had a blunted cortisol awakening response (27.40 (SD 35.00) vs. 95.24 (SD 55.23), p = 0.002), which was differentially associated with chronic experience of stress in Indigenous (r = −0.641, p = 0.046) and non-Indigenous (r = 0.652, p = 0.03) participants. The cortisol response to the laboratory induced psychosocial stress did not differ between groups. Self-reported racial discrimination was strongly associated with flattened cortisol response to stress (r = −0676, p = 0.022) and with heart rate variability (r = 0.654, p = 0.040). Our findings provide insight into potential biological factors underlying health discrepancies in ethnic minority groups. Ethnic minority groups are often confronted with social challenges that can affect their mental health. Migration is among the best-established risk factors for poor mental health1,2 and this risk persists well into the second generation3, indicating that it is not just the experience of migration that drives this increased risk but rather ethnic minority position4. Similarly, there is evidence that First Nations people who represent ethnic minorities in their own country have poorer health relative to the mainstream population5. There is mounting evidence that First Nations people globally are affected by worse mental health relative to the mainstream population, including Aboriginal Canadians6,7, Maori in New Zealand8 and Aboriginal and Torres Strait Islander (respectfully hereafter Indigenous) people in Australia, who are more than twice as likely to be hospitalised due to a mental disorder9. It is estimated that by closing the health gap in Australia, 5600 disability adjusted life years (DALYs) could be saved each year10. Despite substantial improvements in some areas such as infant mortality over the last decades, persisting health inequalities particularly in mental health remain a major source of disadvantage to First Nations people globally5. Social determinants are thought to contribute substantially to the health inequalities affecting First Nations people. Social determinants include education and employment, culturally appropriate access to health care and prevention, adequate housing conditions, and freedom from racial discrimination11. In a broader context they also include control over life circumstances, empowerment and social inclusion12. Indigenous peoples and ethnic minority groups more generally continue to face a complex set of interacting social factors that likely converge on stress13 and may together drive a substantial proportion of the social gradient in health. Indeed, population-based studies show that Indigenous groups experience more stressful life events relative to the general population14,15. The notion that unequal exposure to stressful social and environmental factors shapes the ways in which the brain processes them has been highlighted as a potential pathway from social disadvantage to health inequalities16. 1
Laboratory of Psychiatric Neuroscience, Australian Institute of Tropical Health and Medicine, 1 James Cook Drive, Townsville, 4811 QLD, Australia. 2College of Public Health, Medical and Veterinary Sciences, 1 James Cook Drive, Townsville, 4811 QLD, Australia. 3College of Healthcare Sciences, 1 James Cook Drive, Townsville, 4811 QLD, Australia. 4Anton Breinl Research Centre for Health Systems Strengthening, AITHM, 1 James Cook Drive, Townsville, 4811 QLD, Australia. 5College of Medicine and Dentistry, 1 James Cook Drive, Townsville, 4811 QLD, Australia. Correspondence and requests for materials should be addressed to Z.S. (email:
[email protected]) Scientific Reports | 7:41760 | DOI: 10.1038/srep41760
1
www.nature.com/scientificreports/ Indigenous (n = 11) N (%) Age
M (SD)
Non-Indigenous (n = 11) N (%)
23.82 (3.52)
M (SD)
p-value
23.18 (4.69)
0.422
Gender
1.000
male
3 (27.3%)
3 (27.3%)
female
8 (72.7%)
8 (72.7%)
21–75 hrs/fortnight
2 (18.2%)
0 (0%)
1–20 hrs/fortnight
3 (27.3%)
4 (40.0%)
Not working
6 (54.5%)
6 (60.0%)
Work
0.611
Sleep Sleep duration
8:50:56 hrs
7:18:44 hrs
0.735
Wake-up time
7:31:48 am
6:48:11 am
0.187
Tobacco
1 (9.1%)
0 (0%)
>3 days/week
1 (9.1%)
2 (18.2%)
≤3 days/week
8 (72.7%)
7 (63.6%)
never
2 (18.2%)
2 (18.2%)
Hormonal contraception
2 (25.0%)
2 (25.0%)
Antidepressants
2 (18.2%)
1 (9.1%)
1.000
Alcohol
SES
0.676
4.73 (1.35)
1.000 1.000 6.09 (1.04)
0.015
Table 1. Demographic characteristics of Indigenous and non-Indigenous participants. M = Mean, SD = Standard deviation, SES = Socio-economic status. Indeed, altered processing of social and environmental stimuli has been demonstrated in experimental designs17 and is thought to underlie health disparities in psychiatric epidemiology18. Stress plays a major role in the development of a number of somatic and mental disorders and is a mediator of the effect of socioeconomic status on health19. Stress triggers the activation of the hypothalamic-pituitary-adrenal (HPA) axis, resulting in the production of glucocorticoids in the adrenal cortex20. These powerful hormones bind to glucocorticoid receptors (GR), which are expressed throughout the brain and body. Initially, this helps the body to react to acute stress and initiates a ‘fight or flight’ response. Chronically altered cortisol concentrations contribute to pathological processes termed ‘allostatic overload’, resulting in disease conditions such as metabolic syndrome, type-II diabetes, increased susceptibility to addictions and mental disorders, anxiety and depression, as well as cognitive impairment21,22. The concept of allostasis refers to chronic adaptation to changing demands of the HPA axis, the autonomic nervous system, immune system and metabolic function23. These mechanisms may be highly relevant to First Nation status associated risk as both exposure to stress24 and adverse health outcomes5 are well documented. Allostatic indices (e.g. cortisol) that are both biomarkers (that is, they are quantifiable) and mediators (as they exert effects on target tissues) of the effects of chronic stress exposure may serve as useful indices of longer-term health risks. However, such changes in neuroendocrine and autonomic function are poorly understood in First Nations people. Therefore, the aim of this study was to examine the effect of chronic stress and discrimination on altered basal activity of the HPA-axis and the body’s multisystem response to social stress. Firstly, we hypothesised that Indigenous people would exhibit different circadian cortisol profiles relative to non-Indigenous people, specifically a heightened or attenuated cortisol awakening response (CAR). We further hypothesised that this would be explained by chronic stress and discrimination. Secondly, we hypothesised that the acute stress response of Indigenous people, measured with the Trier Social Stress Test (TSST), would be similarly altered (heightened or attenuated) and associated with the level of stress and discrimination experienced.
Results
Of the 26 Indigenous and 26 non-Indigenous participants, 11 participants in each group completed all assessments, returned satisfactory data and were matched by age and gender. The dropout rate was 34.6% (9 of 26 subjects initially included). Four participants had missing data or returned empty saliva collection devices. One participant was excluded due to a pituitary adenoma, one participant was excluded from the analysis because of outliers (>3 SD above group mean) in two variables that appeared biologically implausible. Participants who did not complete the study were younger in the non-Indigenous group but older in the Indigenous group, and had higher somatic and anxiety scores in the Hopkins Symptom Checklist (HSCL). No difference in self-reported stress was found between participants who did and who did not complete the study. Indigenous participants reported significantly lower socio-economic status (SES) compared to non-Indigenous participants and we thus included SES as a covariate. No significant differences were found in any of the other socio-demographic variables (all p > 0.05, Table 1). Similarly, no statistically significant differences between Indigenous and non-indigenous students were found in scores for chronic stress, depressive symptoms, anxiety, adverse childhood events and number of negative life events in the past year (all p > 0.05, Table 2). Scores for perceived interpersonal racism in
Scientific Reports | 7:41760 | DOI: 10.1038/srep41760
2
www.nature.com/scientificreports/ Indigenous (n = 11)
Non-Indigenous (n = 11)
M (SD)
M (SD)
Test
Effect size (Cohen’s d)
Chronic stress (PSS)
15.27 (3.85)
17.09 (5.22)
T = 0.929
−0.40
p-value 0.364
Chronic stress (K6)
11.09 (2.43)
12.36 (3.20)
T = 1.105
−0.45
0.306
Depression
17.09 (5.49)
16.55 (2.66)
T = 0.841
0.13
0.410
Anxiety
9.36 (2.94)
8.46 (2.77)
T = 0.746
0.32
0.464
Negative life events
3.00 (1.95)
1.91 (2.63)
T = 1.107
0.47
0.282
Childhood adversity
33.40 (15.45)
25.13 (17.31)
T = 0.288
0.50
0.402
SEWB
12.80 (8.56)
na
Depression
5.83 (2.92)
na
Anxiety
1.78 (3.77)
na na
Suicide risk
0.28 (0.75)
Resilience1
4.94 (3.80)
na
Interpersonal racism
7.91 (7.08)
na
3.73 (1.10)
na
Diurnal cortisol (AUCg) (nmol/h/L)
Internalised racism
74.37 (38.53)
157.24 (64.77)
F = 11.893
−1.55
0.003a
CAR (AUCi) (nmol/min/L)
27.40 (35.00)
95.24 (55.23)
F = 13.553
−1.47
0.002a
Wake-up cortisol (nmol/L)
8.10 (3.23)
15.12 (7.11)
F = 6.991
−1.27
0.016a
+30 min cortisol (nmol/L)
9.89 (4.82)
21.47 (9.29)
F = 11.520
−1.56
0.003a
Evening cortisol (nmol/L)
3.14 (1.93)
3.21 (2.01)
F = 0.343
−0.04
0.566a
TSST cortisol stress response (nmol/L)
3.95 (5.02)
5.23 (4.94)
F = 0.195
−0.26
0.664a
TSST cortisol stress recovery (nmol/L)
6.02 (5.55)
4.72 (4.14)
F = 2.581
0.26
0.125a
Table 2. Psychological measures, diurnal cortisol and cortisol stress response. PSS = Perceived Stress Scale, K6 = Kessler Distress Questionnaire, HSCL = Hopkins Symptoms Checklist, NLES = Negative Life Evens Scale, SWEB = social and emotional wellbeing, SSQ = Strong Souls Questionnaire, Measure of Indigenous Racism Experience; SSQ and MIRE were completed by Indigenous participants only. 1The resilience sub-scale of the SSQ is reverse-scored and a higher score therefore represents lower SEWB. 2Cortisol response to stress refers to the increase in cortisol from the lowest cortisol level observed before the Trier Social Stress Test to the highest cortisol level observed during or after the stressor. 3Cortisol recovery from stress refers to the decrease in cortisol from the highest cortisol level during the Trier Social Stress Test to the lowest cortisol level observed after cessation of the stressor. aAdjusted for socioeconomic status.
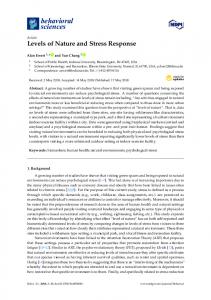
Figure 1. Circadian cortisol profile in Indigenous and non-Indigenous participants. Diurnal cortisol profiles of Indigenous and non-Indigenous participants. We collected three saliva samples across three days to assess diurnal cortisol profiles and found lower morning cortisol and lower cortisol 30 minutes after awakening. *p